
Smart Homes Market
Smart Homes Market Forecasts to 2028 - Global Analysis By Product (Lighting Control, Security Systems, Access Control System and Other Products), By Type (Proactive Software & Services and Behavioral Software & Services), By Protocols & Standards (Wired Protocols, Hybrid Protocols and Wireless Protocols), By Sales Channel, By Application and By Geography

|
Years Covered |
2020-2028 |
|
Estimated Year Value (2022) |
US $135.2 BN |
|
Projected Year Value (2028) |
US $516.8 BN |
|
CAGR (2022 - 2028) |
25.04% |
|
Regions Covered |
North America, Europe, Asia Pacific, South America, and Middle East & Africa |
|
Countries Covered |
US, Canada, Mexico, Germany, UK, Italy, France, Spain, Japan, China, India, Australia, New Zealand, South Korea, Rest of Asia Pacific, South America, Argentina, Brazil, Chile, Middle East & Africa, Saudi Arabia, UAE, Qatar, and South Africa |
|
Largest Market |
North America |
|
Highest Growing Market |
Asia Pacific |
According to Stratistics MRC, the Global Smart Homes Market is accounted for $135.2 billion in 2022 and is expected to reach $516.8 billion by 2028 growing at a CAGR of 25.04% during the forecast period. Smart home gadgets are appropriate for a home setup where appliances may be controlled remotely from any location around the world with an Internet connection using a mobile or other networked device. Because a smart home's gadgets are all connected to the Internet, the consumer can control services like security access, temperature, lighting, and home entertainment. By enabling homeowners to operate smart gadgets, smart home technology, commonly referred to as "home automation," offers them security, comfort, convenience, and energy efficiency. Either the terms "home automation" or "smart homes" may refer to a variety of monitoring, controlling, and automating methods used in a home. Smart home systems require a web portal or an application for smartphones as a user interface to communicate with an automated system, in contrast to simple home automation solutions (which could range from motorised garage doors to automated security systems).
According to the New York State Energy Research and Development Authority (NYSERDA), enabling smart technologies and real-time energy management systems can decrease costs by an average of 15% and improve the bottom line by creating an ecosystem that reduces energy waste.
Market Dynamics:
Driver:
Rise in adoption of home automated technologies
Traditional home automation systems were designed to function with an average degree of connectivity. Users could only use operating systems that were within a specific range. But the development of smart home technology is creating a whole new universe of opportunities. Connectivity is being used to give owners remote access to their properties. An estimated 175 million smart homes exist worldwide. The most recent application trend blends automation and A.I. to offer household assistance in a creative and novel technique. The most modern technological advancements ensure security and sophisticated devices. Some of the most popular security features in smart homes are video door alarms, facial recognition technology, ultra-modern burglar alarms, and remote-controlled locks.
Restraint:
Compatibility issues between devices of various companies
The market for smart homes has become very fragmented. Many players are currently developing various systems using various technologies. Devices built by the same manufacturer or vendor are simple to integrate and connect, but linking systems created by various manufacturers or vendors is laborious and may lead to unreliable services, limited functionality, and incompatibility problems. However, end consumers consequently frequently install devices that can only be managed through the manufacturer's app.
Opportunity:
Growing consumer demand for aesthetic home interiors
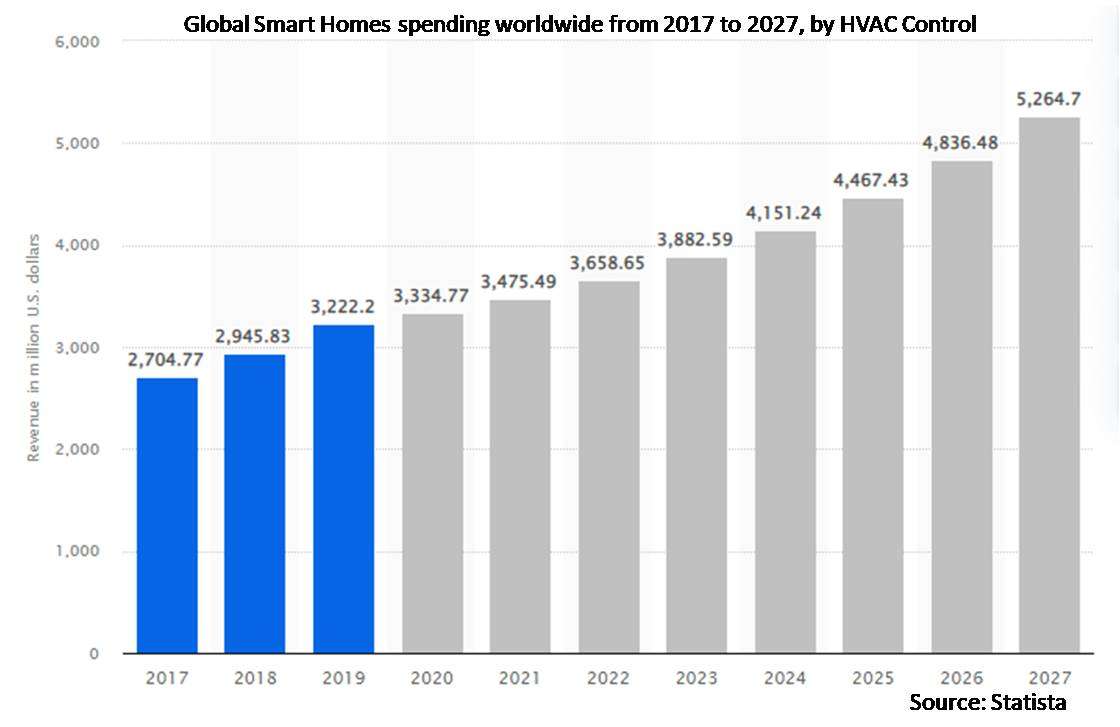
Consumers admire advanced smart home automation because of its effective service and attractive designs. This includes security & access control, entertainment and lighting control systems, and HVAC control systems. In the third quarter of 2021, more than 220 million smart home gadgets were shipped globally. Moreover, with 78.3 million units, the majority of them were video entertainment devices, which considerably boosted market expansion during the projection period.
Threat:
High Security threats to restrain the market expansion
The growing cyberattack in high-end connected technology is the main barrier to market expansion. All of the connected endpoints pose a security risk to smart home technology. Intelligent technology connects to every system and gadget in the house, which makes it vulnerable to hackers if not adequately protected. 80% of IoT devices are susceptible to various attacks, according to Rambus Incorporated, a designer, developer, and licensee of chip interface technology. It is apparent that connecting previously "standalone" smart devices like lights, appliances, and locks raises many new cyber security issues. Parents who were alarmed to learn that hackers were able to contact their young children through a hacked device discovered that even connected baby monitors are susceptible to digital invasions.
Covid-19 Impact:
Industries shut down, and manufacturing was impacted by the COVID-19 pandemic. Due to the rapid closure of international and nation-wide borders, which caused damage and lost revenue, the pandemic interrupted operational efficiency and had an impact on value chains. Existing smart products like TVs and refrigerators continued to be in demand because they helped customers who were compelled to stay at home with their entertainment and convenience needs. The availability of raw materials was negatively impacted by the value chain, which had an adverse effect on the growth of the smart home industry. Moreover, due to factors including more companies entering the market and a greater proportion of online and internet sales, the industry has grown to include a wide range of midrange and entry-level, low-cost home automation products.
The smart kitchen segment is expected to be the largest during the forecast period
Due to rising customer preference for modular kitchens and rising disposable income in developing nations, the smart kitchen segment is anticipated to have the largest share over the estimated period. The value of a smart kitchen has increased as a result of lifestyle changes and an increase in time spent outside of the home. Additionally, as the number of internet, smartphone, and tablet users increases, it has become simpler for customers to monitor their appliances using mobile devices, which is particularly tempting to people who lead hectic lives.
The proactive software and services segment is expected to have the highest CAGR during the forecast period
Over the anticipated period, proactive software and services segment are anticipated to increase profitably since they make it simpler to transmit data on energy consumption to end users and execute the best potential solutions. Compared to behavioural versions, proactive software and services allow for the transfer of a larger volume of data; they can also give end users input on efficient energy use and directions on how to change physical elements, like the temperature and humidity of the environment, to save energy.
Region with largest share:
Due to rising consumer security concerns spurred on by the availability of technologically sophisticated monitoring systems, the North American region held the largest share over the extrapolated period. However, nearly 30 million US households are expected to install smart home equipment in the near future, signalling the growing popularity of smart homes. Additionally, consumers are most interested in adding linked cameras to their homes, followed by video doorbells, connected light bulbs, smart locks, and smart speakers.
Region with highest CAGR:
Owing to increasing demand for automation solutions from residential applications, Asia Pacific is anticipated to expand at the highest CAGR throughout the projection period. The leading firms in the area are concentrating on collaborating with other well-known businesses to develop and market cutting-edge smart home products. Furthermore, the market's expansion is due to the area's growing standard of living and greater disposable income. Additionally, the rapid adoption of smartphones, the internet, and other cutting-edge technologies is expected to propel the region's market.

Key players in the market
Some of the key players in Smart Homes market include Shenzhen Zhuohao Intelligent Electronic Development Co. Ltd (ACTOP), Control4 Corporation, Smarthome Inc., United Technologies Corporation, Lutron Electronics Co. Inc., Legrand SA, IBM Corporation, General Electric Company, Microsoft Corporation, Google Inc., Cisco Systems Inc., LG Electronics Inc., Siemens AG, Emerson Electric Co., Honeywell International Inc., Schneider Electric SE, ABB Ltd, Johnson Controls, Inc., Samsung Group and Ingersoll Rand.
Key Developments:
In January 2023, giant tech company Apple announced to step into the smart home application market. Apple is developing a smart display for the home that includes a magnetic wall attachment and can be used to adjust the thermostat and turn on and off lighting.
In January 2023, Amazon announced support for the new global wireless smart home standard, Matter, which aims to make your connected life simpler.
In January 2023, Eve Systems, a manufacturer of smart home accessories, announced the release of its products with Matter compatibility built in. Eve Energy smart plug, Eve Motion and Eve Door and Window sensors are a few products among them. The new Eve accessories are compatible with Apple HomeKit, Amazon Alexa, Google Home, and Samsung SmartThings, and all three will be shipped to the US in March 2023.
In January 2023, Samsung Electronics unveiled Smart Things Station, a cheap and user-friendly hub for smart homes that also doubles as a fast-charging station. The new, user-friendly smart home hub enables easy interoperability and control of numerous connected devices. Samsung's SmartThings Find, a fast-expanding asset tracking service, is also connected with SmartThings Station. Users can use it to locate lost gadgets.
In March 2021, Emerson and Ameren Missouri announced a partnership to give away Emerson’s Sensi smart thermostats to Ameren Missouri customers. Through instant discounts and participation in the Peak Time Savings program, Ameren Missouri customers will be getting Emerson’s Sensi smart thermostat at no cost other than the required sales tax. Participants can significantly save on their bills while using advanced technology that will enable them to control their thermostats from anywhere with a smartphone.
In January 2021, Samsung launched large-capacity Variable Refrigerant Flow (VRF) air conditioning systems in India that can be installed in just 0.5 sq. m of space in premium apartments, villas, bungalows, and houses as commercial and retail establishments. The Wi-Fi-enabled DVM S Eco series offers smart features, such as voice control and a connected home experience, using the SmartThings app on any smartphone.
Products Covered:
• Lighting Control
• Security Systems
• Access Control System
• HVAC Control
• Entertainment and Other Controls
• Home Healthcare
• Smart Speaker
• Smart Kitchen
• Smart Furniture
• Home Appliances
• Smart Appliances
• Healthcare Services
• Security Services
• Energy Consumption & Management Services
• Smart Laundry
• Other Products
Types Covered:
• Proactive Software & Services
• Behavioral Software & Services
Protocols & Standards Covered:
• Wired Protocols
• Hybrid Protocols
• Wireless Protocols
Sales Channels Covered:
• Indirect Sales Channel
• Direct Sales Channel
• Mono Brands
• Department Stores
• Online Retailers
• Supermarkets & Hypermarkets
• Speciality Stores
• Other Sales Channels
Applications Covered:
• Retrofit
• New Construction
• Other Applications
Regions Covered:
• North America
o US
o Canada
o Mexico
• Europe
o Germany
o UK
o Italy
o France
o Spain
o Rest of Europe
• Asia Pacific
o Japan
o China
o India
o Australia
o New Zealand
o South Korea
o Rest of Asia Pacific
• South America
o Argentina
o Brazil
o Chile
o Rest of South America
• Middle East & Africa
o Saudi Arabia
o UAE
o Qatar
o South Africa
o Rest of Middle East & Africa
What our report offers:
- Market share assessments for the regional and country-level segments
- Strategic recommendations for the new entrants
- Covers Market data for the years 2020, 2021, 2022, 2025, and 2028
- Market Trends (Drivers, Constraints, Opportunities, Threats, Challenges, Investment Opportunities, and recommendations)
- Strategic recommendations in key business segments based on the market estimations
- Competitive landscaping mapping the key common trends
- Company profiling with detailed strategies, financials, and recent developments
- Supply chain trends mapping the latest technological advancements
Free Customization Offerings:
All the customers of this report will be entitled to receive one of the following free customization options:
• Company Profiling
o Comprehensive profiling of additional market players (up to 3)
o SWOT Analysis of key players (up to 3)
• Regional Segmentation
o Market estimations, Forecasts and CAGR of any prominent country as per the client's interest (Note: Depends on feasibility check)
• Competitive Benchmarking
Benchmarking of key players based on product portfolio, geographical presence, and strategic alliances
Table of Contents
1 Executive Summary
2 Preface
2.1 Abstract
2.2 Stake Holders
2.3 Research Scope
2.4 Research Methodology
2.4.1 Data Mining
2.4.2 Data Analysis
2.4.3 Data Validation
2.4.4 Research Approach
2.5 Research Sources
2.5.1 Primary Research Sources
2.5.2 Secondary Research Sources
2.5.3 Assumptions
3 Market Trend Analysis
3.1 Introduction
3.2 Drivers
3.3 Restraints
3.4 Opportunities
3.5 Threats
3.6 Product Analysis
3.7 Application Analysis
3.8 Emerging Markets
3.9 Impact of Covid-19
4 Porters Five Force Analysis
4.1 Bargaining power of suppliers
4.2 Bargaining power of buyers
4.3 Threat of substitutes
4.4 Threat of new entrants
4.5 Competitive rivalry
5 Global Smart Homes Market, By Product
5.1 Introduction
5.2 Lighting Control
5.2.1 Accessories
5.2.2 Daylight Sensors
5.2.3 Dimmers
5.2.4 Occupancy Sensors
5.2.5 Relays
5.2.6 Switches
5.2.7 Timers
5.2.8 Other Lighting Controls
5.3 Security Systems
5.3.1 Hardware
5.3.1.1 Cameras
5.3.1.1.1 Analog Cameras
5.3.1.1.2 IP Cameras
5.3.1.2 Monitors
5.3.1.3 Storage Devices
5.3.1.4 Other Hardwares
5.3.2 Video Surveillance
5.3.3 Services
5.3.4 Software
5.3.4.1 Neural Networks and Algorithms
5.3.4.2 Video Management Software
5.3.4.3 Video Analytics Software
5.4 Access Control System
5.4.1 Hardware
5.4.1.1 Biometric Readers
5.4.1.2 Card-based Readers
5.4.1.3 Controllers
5.4.1.4 Electronic Locks
5.4.1.5 Multi Technology Readers
5.4.1.6 Iris Recognition
5.4.1.7 Palm Recognition
5.4.1.8 Facial Recognition
5.4.1.9 Fingerprint Recognition
5.4.1.10 Voice Recognition
5.4.1.11 Other Hardwares
5.4.2 Other Access Control Systems
5.5 HVAC Control
5.5.1 Actuators
5.5.2 Control Valves
5.5.3 Dampers
5.5.4 Heating & Cooling Coils
5.5.5 Pumps & Fans
5.5.6 Sensors
5.5.7 Smart Thermostats
5.5.8 Smart Vents
5.6 Entertainment and Other Controls
5.6.1 Entertainment Control
5.6.1.1 Touch Screen & Keypads
5.6.1.2 Home Theatre System Controls
5.6.1.3 Audio & Volume Controls
5.6.2 Other Controls
5.6.2.1 Smart Plugs
5.6.2.2 Smart Locks
5.6.2.3 Smart Meters
5.6.2.4 Smoke Detectors
5.6.2.5 Smart Hubs
5.7 Home Healthcare
5.7.1 Physical Activity Monitors
5.7.2 Health Status Monitors
5.7.2.1 Blood Pressure Monitors
5.7.2.2 Continuous Glucose Meters
5.7.2.3 Fitness and Heart Rate Monitors
5.7.2.4 Blood Glucose Meters
5.7.2.5 Pulse Oximeters
5.7.3 Fall Detectors
5.8 Smart Speaker
5.9 Smart Kitchen
5.9.1 Smart Cookers
5.9.2 Smart Cooktops
5.9.3 Smart Ovens
5.9.4 Smart Dish Washers
5.9.5 Smart Kettles
5.9.6 Smart Coffee Makers
5.9.7 Smart Refrigerators
5.10 Smart Furniture
5.10.1 Smart Chairs
5.10.2 Smart Sofas
5.10.3 Smart Stools & Benches
5.10.4 Smart Desks
5.10.5 Smart Tables
5.11 Home Appliances
5.11.1 Smart Vacuum Cleaners
5.11.2 Smart Water Heaters
5.11.3 Smart Dryers
5.11.4 Smart Washers
5.12 Smart Appliances
5.12.1 Smart Air Conditioners
5.12.2 Washing Machines
5.13 Healthcare Services
5.13.1 Emergency Response Services
5.13.2 E Health Services
5.14 Security Services
5.14.1 Assisted Living Services
5.14.2 Intrusion Detection Services
5.14.3 Fire Protection Services
5.15 Energy Consumption & Management Services
5.15.1 Energy Security Services
5.15.2 Ambient Assisted Services
5.15.3 Energy Efficiency Services
5.16 Smart Laundry
5.17 Other Products
6 Global Smart Homes Market, By Type
6.1 Introduction
6.2 Proactive Software & Services
6.3 Behavioral Software & Services
7 Global Smart Homes Market, By Protocols & Standards
7.1 Introduction
7.2 Wired Protocols
7.2.1 Konnex (KNX)
7.2.2 Ethernet
7.2.3 Modbus
7.2.4 LonWorks
7.2.5 Bacnet
7.2.6 X10
7.2.7 Universal Powerline Bus (UPB)
7.3 Hybrid Protocols
7.3.1 C-Bus
7.3.2 Insteon
7.4 Wireless Protocols
7.4.1 Enocean
7.4.2 Bluetooth
7.4.3 Zigbee
7.4.4 Thread
7.4.5 Z Wave
7.4.6 Wi-fi
8 Global Smart Homes Market, By Sales Channel
8.1 Introduction
8.2 Indirect Sales Channel
8.3 Direct Sales Channel
8.4 Mono Brands
8.5 Department Stores
8.6 Online Retailers
8.7 Supermarkets & Hypermarkets
8.8 Speciality Stores
8.9 Other Sales Channels
9 Global Smart Homes Market, By Application
9.1 Introduction
9.2 Retrofit
9.3 New Construction
9.4 Other Applications
10 Global Smart Homes Market, By Geography
10.1 Introduction
10.2 North America
10.2.1 US
10.2.2 Canada
10.2.3 Mexico
10.3 Europe
10.3.1 Germany
10.3.2 UK
10.3.3 Italy
10.3.4 France
10.3.5 Spain
10.3.6 Rest of Europe
10.4 Asia Pacific
10.4.1 Japan
10.4.2 China
10.4.3 India
10.4.4 Australia
10.4.5 New Zealand
10.4.6 South Korea
10.4.7 Rest of Asia Pacific
10.5 South America
10.5.1 Argentina
10.5.2 Brazil
10.5.3 Chile
10.5.4 Rest of South America
10.6 Middle East & Africa
10.6.1 Saudi Arabia
10.6.2 UAE
10.6.3 Qatar
10.6.4 South Africa
10.6.5 Rest of Middle East & Africa
11 Key Developments
11.1 Agreements, Partnerships, Collaborations and Joint Ventures
11.2 Acquisitions & Mergers
11.3 New Product Launch
11.4 Expansions
11.5 Other Key Strategies
12 Company Profiling
12.1 Shenzhen Zhuohao Intelligent Electronic Development Co. Ltd (ACTOP)
12.2 Control4 Corporation
12.3 Smarthome Inc.
12.4 United Technologies Corporation
12.5 Lutron Electronics Co. Inc.
12.6 Legrand SA
12.7 IBM Corporation
12.8 General Electric Company
12.9 Microsoft Corporation
12.10 Google Inc.
12.11 Cisco Systems Inc.
12.12 LG Electronics Inc.
12.13 Siemens AG
12.14 Emerson Electric Co.
12.15 Honeywell International Inc.
12.16 Schneider Electric SE
12.17 ABB Ltd
12.18 Johnson Controls, Inc.
12.19 Samsung Group
12.20 Ingersoll Rand
List of Tables
1 Global Smart Homes Market Outlook, By Region (2020-2028) ($MN)
2 Global Smart Homes Market Outlook, By Product (2020-2028) ($MN)
3 Global Smart Homes Market Outlook, By Lighting Control (2020-2028) ($MN)
4 Global Smart Homes Market Outlook, By Accessories (2020-2028) ($MN)
5 Global Smart Homes Market Outlook, By Daylight Sensors (2020-2028) ($MN)
6 Global Smart Homes Market Outlook, By Dimmers (2020-2028) ($MN)
7 Global Smart Homes Market Outlook, By Occupancy Sensors (2020-2028) ($MN)
8 Global Smart Homes Market Outlook, By Relays (2020-2028) ($MN)
9 Global Smart Homes Market Outlook, By Switches (2020-2028) ($MN)
10 Global Smart Homes Market Outlook, By Timers (2020-2028) ($MN)
11 Global Smart Homes Market Outlook, By Other Lighting Controls (2020-2028) ($MN)
12 Global Smart Homes Market Outlook, By Security Systems (2020-2028) ($MN)
13 Global Smart Homes Market Outlook, By Hardware (2020-2028) ($MN)
14 Global Smart Homes Market Outlook, By Video Surveillance (2020-2028) ($MN)
15 Global Smart Homes Market Outlook, By Services (2020-2028) ($MN)
16 Global Smart Homes Market Outlook, By Software (2020-2028) ($MN)
17 Global Smart Homes Market Outlook, By Access Control System (2020-2028) ($MN)
18 Global Smart Homes Market Outlook, By Hardware (2020-2028) ($MN)
19 Global Smart Homes Market Outlook, By Other Access Control Systems (2020-2028) ($MN)
20 Global Smart Homes Market Outlook, By HVAC Control (2020-2028) ($MN)
21 Global Smart Homes Market Outlook, By Actuators (2020-2028) ($MN)
22 Global Smart Homes Market Outlook, By Control Valves (2020-2028) ($MN)
23 Global Smart Homes Market Outlook, By Dampers (2020-2028) ($MN)
24 Global Smart Homes Market Outlook, By Heating & Cooling Coils (2020-2028) ($MN)
25 Global Smart Homes Market Outlook, By Pumps & Fans (2020-2028) ($MN)
26 Global Smart Homes Market Outlook, By Sensors (2020-2028) ($MN)
27 Global Smart Homes Market Outlook, By Smart Thermostats (2020-2028) ($MN)
28 Global Smart Homes Market Outlook, By Smart Vents (2020-2028) ($MN)
29 Global Smart Homes Market Outlook, By Entertainment and Other Controls (2020-2028) ($MN)
30 Global Smart Homes Market Outlook, By Entertainment Control (2020-2028) ($MN)
31 Global Smart Homes Market Outlook, By Other Controls (2020-2028) ($MN)
32 Global Smart Homes Market Outlook, By Home Healthcare (2020-2028) ($MN)
33 Global Smart Homes Market Outlook, By Physical Activity Monitors (2020-2028) ($MN)
34 Global Smart Homes Market Outlook, By Health Status Monitors (2020-2028) ($MN)
35 Global Smart Homes Market Outlook, By Fall Detectors (2020-2028) ($MN)
36 Global Smart Homes Market Outlook, By Smart Speaker (2020-2028) ($MN)
37 Global Smart Homes Market Outlook, By Smart Kitchen (2020-2028) ($MN)
38 Global Smart Homes Market Outlook, By Smart Cookers (2020-2028) ($MN)
39 Global Smart Homes Market Outlook, By Smart Cooktops (2020-2028) ($MN)
40 Global Smart Homes Market Outlook, By Smart Ovens (2020-2028) ($MN)
41 Global Smart Homes Market Outlook, By Smart Dish Washers (2020-2028) ($MN)
42 Global Smart Homes Market Outlook, By Smart Kettles (2020-2028) ($MN)
43 Global Smart Homes Market Outlook, By Smart Coffee Makers (2020-2028) ($MN)
44 Global Smart Homes Market Outlook, By Smart Refrigerators (2020-2028) ($MN)
45 Global Smart Homes Market Outlook, By Smart Furniture (2020-2028) ($MN)
46 Global Smart Homes Market Outlook, By Smart Chairs (2020-2028) ($MN)
47 Global Smart Homes Market Outlook, By Smart Sofas (2020-2028) ($MN)
48 Global Smart Homes Market Outlook, By Smart Stools & Benches (2020-2028) ($MN)
49 Global Smart Homes Market Outlook, By Smart Desks (2020-2028) ($MN)
50 Global Smart Homes Market Outlook, By Smart Tables (2020-2028) ($MN)
51 Global Smart Homes Market Outlook, By Home Appliances (2020-2028) ($MN)
52 Global Smart Homes Market Outlook, By Smart Vacuum Cleaners (2020-2028) ($MN)
53 Global Smart Homes Market Outlook, By Smart Water Heaters (2020-2028) ($MN)
54 Global Smart Homes Market Outlook, By Smart Dryers (2020-2028) ($MN)
55 Global Smart Homes Market Outlook, By Smart Washers (2020-2028) ($MN)
56 Global Smart Homes Market Outlook, By Smart Appliances (2020-2028) ($MN)
57 Global Smart Homes Market Outlook, By Smart Air Conditioners (2020-2028) ($MN)
58 Global Smart Homes Market Outlook, By Washing Machines (2020-2028) ($MN)
59 Global Smart Homes Market Outlook, By Healthcare Services (2020-2028) ($MN)
60 Global Smart Homes Market Outlook, By Emergency Response Services (2020-2028) ($MN)
61 Global Smart Homes Market Outlook, By E Health Services (2020-2028) ($MN)
62 Global Smart Homes Market Outlook, By Security Services (2020-2028) ($MN)
63 Global Smart Homes Market Outlook, By Assisted Living Services (2020-2028) ($MN)
64 Global Smart Homes Market Outlook, By Intrusion Detection Services (2020-2028) ($MN)
65 Global Smart Homes Market Outlook, By Fire Protection Services (2020-2028) ($MN)
66 Global Smart Homes Market Outlook, By Energy Consumption & Management Services (2020-2028) ($MN)
67 Global Smart Homes Market Outlook, By Energy Security Services (2020-2028) ($MN)
68 Global Smart Homes Market Outlook, By Ambient Assisted Services (2020-2028) ($MN)
69 Global Smart Homes Market Outlook, By Energy Efficiency Services (2020-2028) ($MN)
70 Global Smart Homes Market Outlook, By Smart Laundry (2020-2028) ($MN)
71 Global Smart Homes Market Outlook, By Other Products (2020-2028) ($MN)
72 Global Smart Homes Market Outlook, By Type (2020-2028) ($MN)
73 Global Smart Homes Market Outlook, By Proactive Software & Services (2020-2028) ($MN)
74 Global Smart Homes Market Outlook, By Behavioral Software & Services (2020-2028) ($MN)
75 Global Smart Homes Market Outlook, By Protocols & Standards (2020-2028) ($MN)
76 Global Smart Homes Market Outlook, By Wired Protocols (2020-2028) ($MN)
77 Global Smart Homes Market Outlook, By Konnex (KNX) (2020-2028) ($MN)
78 Global Smart Homes Market Outlook, By Ethernet (2020-2028) ($MN)
79 Global Smart Homes Market Outlook, By Modbus (2020-2028) ($MN)
80 Global Smart Homes Market Outlook, By LonWorks (2020-2028) ($MN)
81 Global Smart Homes Market Outlook, By Bacnet (2020-2028) ($MN)
82 Global Smart Homes Market Outlook, By X10 (2020-2028) ($MN)
83 Global Smart Homes Market Outlook, By Universal Powerline Bus (UPB) (2020-2028) ($MN)
84 Global Smart Homes Market Outlook, By Hybrid Protocols (2020-2028) ($MN)
85 Global Smart Homes Market Outlook, By C-Bus (2020-2028) ($MN)
86 Global Smart Homes Market Outlook, By Insteon (2020-2028) ($MN)
87 Global Smart Homes Market Outlook, By Wireless Protocols (2020-2028) ($MN)
88 Global Smart Homes Market Outlook, By Enocean (2020-2028) ($MN)
89 Global Smart Homes Market Outlook, By Bluetooth (2020-2028) ($MN)
90 Global Smart Homes Market Outlook, By Zigbee (2020-2028) ($MN)
91 Global Smart Homes Market Outlook, By Thread (2020-2028) ($MN)
92 Global Smart Homes Market Outlook, By Z Wave (2020-2028) ($MN)
93 Global Smart Homes Market Outlook, By Wi-fi (2020-2028) ($MN)
94 Global Smart Homes Market Outlook, By Sales Channel (2020-2028) ($MN)
95 Global Smart Homes Market Outlook, By Indirect Sales Channel (2020-2028) ($MN)
96 Global Smart Homes Market Outlook, By Direct Sales Channel (2020-2028) ($MN)
97 Global Smart Homes Market Outlook, By Mono Brands (2020-2028) ($MN)
98 Global Smart Homes Market Outlook, By Department Stores (2020-2028) ($MN)
99 Global Smart Homes Market Outlook, By Online Retailers (2020-2028) ($MN)
100 Global Smart Homes Market Outlook, By Supermarkets & Hypermarkets (2020-2028) ($MN)
101 Global Smart Homes Market Outlook, By Speciality Stores (2020-2028) ($MN)
102 Global Smart Homes Market Outlook, By Other Sales Channels (2020-2028) ($MN)
103 Global Smart Homes Market Outlook, By Application (2020-2028) ($MN)
104 Global Smart Homes Market Outlook, By Retrofit (2020-2028) ($MN)
105 Global Smart Homes Market Outlook, By New Construction (2020-2028) ($MN)
106 Global Smart Homes Market Outlook, By Other Applications (2020-2028) ($MN)
Note: Tables for North America, Europe, APAC, South America, and Middle East & Africa Regions are also represented in the same manner as above.
List of Figures
RESEARCH METHODOLOGY

We at ‘Stratistics’ opt for an extensive research approach which involves data mining, data validation, and data analysis. The various research sources include in-house repository, secondary research, competitor’s sources, social media research, client internal data, and primary research.
Our team of analysts prefers the most reliable and authenticated data sources in order to perform the comprehensive literature search. With access to most of the authenticated data bases our team highly considers the best mix of information through various sources to obtain extensive and accurate analysis.
Each report takes an average time of a month and a team of 4 industry analysts. The time may vary depending on the scope and data availability of the desired market report. The various parameters used in the market assessment are standardized in order to enhance the data accuracy.
Data Mining
The data is collected from several authenticated, reliable, paid and unpaid sources and is filtered depending on the scope & objective of the research. Our reports repository acts as an added advantage in this procedure. Data gathering from the raw material suppliers, distributors and the manufacturers is performed on a regular basis, this helps in the comprehensive understanding of the products value chain. Apart from the above mentioned sources the data is also collected from the industry consultants to ensure the objective of the study is in the right direction.
Market trends such as technological advancements, regulatory affairs, market dynamics (Drivers, Restraints, Opportunities and Challenges) are obtained from scientific journals, market related national & international associations and organizations.
Data Analysis
From the data that is collected depending on the scope & objective of the research the data is subjected for the analysis. The critical steps that we follow for the data analysis include:
- Product Lifecycle Analysis
- Competitor analysis
- Risk analysis
- Porters Analysis
- PESTEL Analysis
- SWOT Analysis
The data engineering is performed by the core industry experts considering both the Marketing Mix Modeling and the Demand Forecasting. The marketing mix modeling makes use of multiple-regression techniques to predict the optimal mix of marketing variables. Regression factor is based on a number of variables and how they relate to an outcome such as sales or profits.
Data Validation
The data validation is performed by the exhaustive primary research from the expert interviews. This includes telephonic interviews, focus groups, face to face interviews, and questionnaires to validate our research from all aspects. The industry experts we approach come from the leading firms, involved in the supply chain ranging from the suppliers, distributors to the manufacturers and consumers so as to ensure an unbiased analysis.
We are in touch with more than 15,000 industry experts with the right mix of consultants, CEO's, presidents, vice presidents, managers, experts from both supply side and demand side, executives and so on.
The data validation involves the primary research from the industry experts belonging to:
- Leading Companies
- Suppliers & Distributors
- Manufacturers
- Consumers
- Industry/Strategic Consultants
Apart from the data validation the primary research also helps in performing the fill gap research, i.e. providing solutions for the unmet needs of the research which helps in enhancing the reports quality.
For more details about research methodology, kindly write to us at info@strategymrc.com
Frequently Asked Questions
In case of any queries regarding this report, you can contact the customer service by filing the “Inquiry Before Buy” form available on the right hand side. You may also contact us through email: info@strategymrc.com or phone: +1-301-202-5929
Yes, the samples are available for all the published reports. You can request them by filling the “Request Sample” option available in this page.
Yes, you can request a sample with your specific requirements. All the customized samples will be provided as per the requirement with the real data masked.
All our reports are available in Digital PDF format. In case if you require them in any other formats, such as PPT, Excel etc you can submit a request through “Inquiry Before Buy” form available on the right hand side. You may also contact us through email: info@strategymrc.com or phone: +1-301-202-5929
We offer a free 15% customization with every purchase. This requirement can be fulfilled for both pre and post sale. You may send your customization requirements through email at info@strategymrc.com or call us on +1-301-202-5929.
We have 3 different licensing options available in electronic format.
- Single User Licence: Allows one person, typically the buyer, to have access to the ordered product. The ordered product cannot be distributed to anyone else.
- 2-5 User Licence: Allows the ordered product to be shared among a maximum of 5 people within your organisation.
- Corporate License: Allows the product to be shared among all employees of your organisation regardless of their geographical location.
All our reports are typically be emailed to you as an attachment.
To order any available report you need to register on our website. The payment can be made either through CCAvenue or PayPal payments gateways which accept all international cards.
We extend our support to 6 months post sale. A post sale customization is also provided to cover your unmet needs in the report.
Request Customization
We offer complimentary customization of up to 15% with every purchase. To share your customization requirements, feel free to email us at info@strategymrc.com or call us on +1-301-202-5929. .
Please Note: Customization within the 15% threshold is entirely free of charge. If your request exceeds this limit, we will conduct a feasibility assessment. Following that, a detailed quote and timeline will be provided.
WHY CHOOSE US ?

Assured Quality
Best in class reports with high standard of research integrity

24X7 Research Support
Continuous support to ensure the best customer experience.

Free Customization
Adding more values to your product of interest.

Safe & Secure Access
Providing a secured environment for all online transactions.

Trusted by 600+ Brands
Serving the most reputed brands across the world.