Sustainable Chemicals Market
Sustainable Chemicals Market Forecasts to 2034 – Global Analysis By Product Category (Bio-Based Chemicals, Recycled and Circular Chemicals, Low-Carbon and Reduced-Footprint Chemicals, and Green Specialty Chemicals), Feedstock Source, Production Technology, Chemical Product, End-Use Industry, and By Geography

Market Dynamics:
Driver:
Customer demand for verified material and footprint improvements
Manufacturers seeking to improve the environmental performance of finished goods need credible alternatives for their chemical inputs. Packaging converters, consumer-product companies, and industrial buyers can influence demand through material specifications and supplier qualification. Chemical producers respond with renewable feedstocks, recycled content, more efficient processes, and products designed to reduce hazardous substances. Adoption is strongest when these improvements preserve the properties required in the final application. Verified product information helps buyers compare alternatives and substantiate their own claims. This creates a commercial driver for suppliers that can document meaningful benefits while delivering consistent performance and dependable quantities through established purchasing channels.
Restraint:
Feedstock consistency and the cost of scaling new processes
Alternative chemical routes often depend on feedstocks whose availability, composition, and collection costs vary by location and season. Fermentation, recycling, and carbon-utilization processes may also require substantial development before achieving stable commercial output. Plants need reliable energy, purification, and downstream logistics, while customers require qualification data before changing formulations. These demands can leave producers facing high initial costs and uncertain sales volumes at the same time. Competition with mature conventional production further limits pricing flexibility. The resulting gap between technical feasibility and repeatable industrial economics can delay capacity additions, particularly where customers are unwilling to enter supportive long-term purchasing agreements.
Opportunity:
Combining circular feedstocks with established chemical value chains
Existing chemical and materials networks offer opportunities to introduce recovered or renewable inputs without redesigning every downstream application. Molecular recycling can return suitable waste streams to useful chemical building blocks, while process electrification can improve production footprints where low-emission electricity is available. Partnerships among waste suppliers, technology developers, chemical producers, and brand owners can align quality requirements and purchasing commitments. Such coordination reduces the risk of creating capacity without a dependable feedstock or customer base. Additional opportunities arise in specialty formulations where improved performance and environmental attributes together justify qualification effort and support a commercially viable alternative to conventional ingredients.
Threat:
Weak sustainability claims and unfavorable conventional price cycles
Market confidence can weaken if product claims omit significant lifecycle impacts or imply that renewable and recycled materials are automatically harmless. Disputes over accounting methods, feedstock origin, or end-of-life outcomes can increase scrutiny and slow customer approval. Conventional chemical prices present a separate threat: periods of low fossil-input costs can widen the premium required for alternative production. Buyers under margin pressure may postpone switching unless performance or procurement requirements justify the difference. Suppliers therefore need transparent evidence and resilient cost structures. Projects built around optimistic premiums or unverified environmental advantages risk losing customer support before achieving sufficient operating scale.
Covid-19 Impact:
The pandemic affected sustainable chemicals through uneven changes in end-market demand, interruptions to production schedules, and difficulties coordinating feedstock and equipment deliveries. Demand for cleaning and hygiene applications contrasted with weakness in sectors such as transport and construction. For emerging producers, delayed customer trials and restricted access to plants could slow qualification and commercialization. The episode highlighted the value of supply resilience alongside environmental performance. Subsequent market development has required suppliers to demonstrate consistent product quality and dependable delivery, with purchasing decisions shaped by the economics of individual applications rather than sustainability positioning alone.
The Bio-Based Chemicals segment is expected to be the largest during the forecast period
Bio-Based Chemicals are expected to hold the largest product-category share because renewable feedstocks support a broad range of established and emerging chemical applications. Alcohols, organic acids, solvents, polymers, and selected surfactants create several routes to commercialization rather than reliance on one material family. Industrial biotechnology and conventional chemical processing can both contribute, depending on the molecule and feedstock. Existing agricultural and fermentation infrastructure offers a foundation for some products, although sustainability outcomes remain process-specific. The segment's expected leadership reflects this breadth of use and production experience, with buyers continuing to weigh functional performance, land and resource considerations, and reliable feedstock sourcing.
The Recycled and Circular Chemicals segment is expected to have the highest CAGR during the forecast period
Recycled and Circular Chemicals are forecast to achieve the highest product-category CAGR as customers pursue materials that recover value from waste and retain useful molecules in circulation. Demand is supported where recycling technologies produce outputs suitable for demanding downstream specifications and can complement available mechanical recycling routes. Chemical producers and brand owners can improve commercialization prospects through coordinated collection, qualification, and purchasing arrangements. Growth will depend on actual process performance, waste availability, and credible accounting of material flows. The segment's acceleration is therefore expected to favor projects with well-defined feedstocks and product outlets, rather than treating every proposed recycling technology as equally mature.
Region with largest share:
Europe is expected to represent the largest regional share, supported by an established chemical industry and sustained work on circular materials, industrial biotechnology, and lower-emission production. The region combines specialty-chemical expertise with customers that evaluate product environmental attributes during qualification. Demonstration facilities and partnerships among producers, technology providers, and downstream brands support commercialization, particularly where performance requirements are demanding. Energy costs and industrial competitiveness remain important constraints on local production. Regional leadership is therefore associated with technical capability, customer engagement, and product differentiation, while the ability to convert demonstrations into reliable commercial operations will shape the durability of that position.
Region with highest CAGR:
Asia Pacific is projected to post the highest regional CAGR as its substantial manufacturing base creates demand for alternative materials across packaging, textiles, consumer products, and transport. International customers can encourage suppliers to qualify recycled, renewable, or lower-footprint inputs within existing production networks. The region also offers diverse agricultural resources and chemical-processing capabilities, although access to consistent sustainable feedstocks varies considerably. Commercial growth will require credible product documentation and dependable volumes at competitive costs. Investments that connect feedstock collection, manufacturing, and downstream qualification are positioned to benefit as environmental attributes become more integrated into purchasing decisions across regional supply chains.
Key players in the market
Some of the key players in the Sustainable Chemicals Market include BASF SE, Dow Inc., Covestro AG, SABIC, Arkema S.A., Evonik Industries AG, Cargill, Incorporated, Archer-Daniels-Midland Company, Braskem S.A., Corbion N.V., Novonesis A/S, LanzaTech Global, Inc., Avantium N.V., Mitsubishi Chemical Group Corporation, TotalEnergies Corbion B.V., Neste Oyj, Eastman Chemical Company, and Solvay S.A..
Key Developments:
In October 2026, UPM inaugurated its Leuna biorefinery in Germany, with stable enzymatic hydrolysis and lignin-derived specialty-chemical production. Its subsequent quarterly update placed integrated production in the second quarter of 2027 following required modifications to the glycols process. The project illustrates staged commercialization of renewable chemicals made from wood.
In September 2026, Avantium announced the first FDCA batch from its Delfzijl flagship plant after commissioning major process units. The company outlined product qualification and a transition toward continuous operation, with commercial sales anticipated at the end of 2026, advancing its route to plant-based PEF materials.
In April 2024, BASF, SABIC, and Linde inaugurated their demonstration plant for electrically heated steam-cracking furnaces in Ludwigshafen. The project was designed to test electric heating under industrial operating conditions, addressing process-energy emissions within the broader sustainable chemicals production landscape.
Product Categories Covered:
• Bio-Based Chemicals
• Recycled and Circular Chemicals
• Low-Carbon and Reduced-Footprint Chemicals
• Green Specialty Chemicals
Feedstock Sources Covered:
• Biomass and Agricultural Feedstocks
• Waste and Recycled Feedstocks
• Captured Carbon Dioxide
• Green Hydrogen
• Reduced-Carbon Fossil Feedstocks
Production Technologies Covered:
• Industrial Biotechnology and Fermentation
• Green Chemistry and Catalysis
• Chemical and Advanced Recycling
• Carbon Capture and Utilization
• Process Electrification and Efficiency
Chemical Products Covered:
• Bio-Alcohols
• Bio-Organic Acids
• Biopolymers
• Bio-Based Solvents
• Surfactants
• Platform and Intermediate Chemicals
• Other Sustainable Chemical Products
End-Use Industries Covered:
• Packaging and Plastics
• Automotive and Transportation
• Construction
• Agriculture
• Textiles
• Consumer Products and Personal Care
• Electronics
• Pharmaceuticals and Healthcare
• Other Industries
Regions Covered:
• North America
o United States
o Canada
o Mexico
• Europe
o United Kingdom
o Germany
o France
o Italy
o Spain
o Netherlands
o Belgium
o Sweden
o Switzerland
o Poland
o Rest of Europe
• Asia Pacific
o China
o Japan
o India
o South Korea
o Australia
o Indonesia
o Thailand
o Malaysia
o Singapore
o Vietnam
o Rest of Asia Pacific
• South America
o Brazil
o Argentina
o Colombia
o Chile
o Peru
o Rest of South America
• Rest of the World (RoW)
o Middle East
Saudi Arabia
United Arab Emirates
Qatar
Israel
Rest of Middle East
o Africa
South Africa
Egypt
Morocco
Rest of Africa
What our report offers:
- Regional and country market-share assessments across sustainable chemical categories
- Recommendations for new entrants on feedstock strategy, product positioning, and market access
- Market data covering the years 2023, 2024, 2025, 2026, 2027, 2028, 2030, 2032 and 2034
- Review of growth drivers, constraints, opportunities, threats, challenges, investment openings, and recommendations
- Strategic recommendations for key chemical business segments informed by market estimations
- Competitive mapping of recurring trends in circularity, renewable inputs, and process innovation
- Company profiles addressing strategies, financials, and recent developments in commercialization
- Supply-chain trends connecting feedstock developments with the latest production technologies
Free Customization Offerings:
For this sustainable chemicals report, customers are entitled to one of these free customization selections:
• Company Profiling
o Additional detailed profiles of relevant chemical market participants (up to 3)
o SWOT reviews of key players selected for deeper analysis (up to 3)
• Regional Segmentation
o Market estimates, forecasts, and CAGR for a prominent country of the client’s choice (Note: Depends on feasibility check)
• Competitive Benchmarking
o Evaluation of key companies by chemical product portfolio, geographical presence, and strategic alliances
Table of Contents
1 Executive Summary1.1 Market Snapshot and Key Highlights
1.2 Growth Drivers, Challenges, and Opportunities
1.3 Competitive Landscape Overview
1.4 Strategic Insights and Recommendations
2 Research Framework
2.1 Study Objectives and Scope
2.2 Stakeholder Analysis
2.3 Research Assumptions and Limitations
2.4 Research Methodology
2.4.1 Data Collection (Primary and Secondary)
2.4.2 Data Modeling and Estimation Techniques
2.4.3 Data Validation and Triangulation
2.4.4 Analytical and Forecasting Approach
3 Market Dynamics and Trend Analysis
3.1 Market Definition and Structure
3.2 Key Market Drivers
3.3 Market Restraints and Challenges
3.4 Growth Opportunities and Investment Hotspots
3.5 Industry Threats and Risk Assessment
3.6 Technology and Innovation Landscape
3.7 Emerging and High-Growth Markets
3.8 Regulatory and Policy Environment
3.9 Impact of COVID-19 and Recovery Outlook
4 Competitive and Strategic Assessment
4.1 Porter's Five Forces Analysis
4.1.1 Supplier Bargaining Power
4.1.2 Buyer Bargaining Power
4.1.3 Threat of Substitutes
4.1.4 Threat of New Entrants
4.1.5 Competitive Rivalry
4.2 Market Share Analysis of Key Players
4.3 Product Benchmarking and Performance Comparison
5 Global Sustainable Chemicals Market, By Product Category
5.1 Bio-Based Chemicals
5.2 Recycled and Circular Chemicals
5.3 Low-Carbon and Reduced-Footprint Chemicals
5.4 Green Specialty Chemicals
6 Global Sustainable Chemicals Market, By Feedstock Source
6.1 Biomass and Agricultural Feedstocks
6.2 Waste and Recycled Feedstocks
6.3 Captured Carbon Dioxide
6.4 Green Hydrogen
6.5 Reduced-Carbon Fossil Feedstocks
7 Global Sustainable Chemicals Market, By Production Technology
7.1 Industrial Biotechnology and Fermentation
7.2 Green Chemistry and Catalysis
7.3 Chemical and Advanced Recycling
7.4 Carbon Capture and Utilization
7.5 Process Electrification and Efficiency
8 Global Sustainable Chemicals Market, By Chemical Product
8.1 Bio-Alcohols
8.2 Bio-Organic Acids
8.3 Biopolymers
8.4 Bio-Based Solvents
8.5 Surfactants
8.6 Platform and Intermediate Chemicals
8.7 Other Sustainable Chemical Products
9 Global Sustainable Chemicals Market, By End-Use Industry
9.1 Packaging and Plastics
9.2 Automotive and Transportation
9.3 Construction
9.4 Agriculture
9.5 Textiles
9.6 Consumer Products and Personal Care
9.7 Electronics
9.8 Pharmaceuticals and Healthcare
9.9 Other Industries
10 Global Sustainable Chemicals Market, By Geography
10.1 North America
10.1.1 United States
10.1.2 Canada
10.1.3 Mexico
10.2 Europe
10.2.1 United Kingdom
10.2.2 Germany
10.2.3 France
10.2.4 Italy
10.2.5 Spain
10.2.6 Netherlands
10.2.7 Belgium
10.2.8 Sweden
10.2.9 Switzerland
10.2.10 Poland
10.2.11 Rest of Europe
10.3 Asia Pacific
10.3.1 China
10.3.2 Japan
10.3.3 India
10.3.4 South Korea
10.3.5 Australia
10.3.6 Indonesia
10.3.7 Thailand
10.3.8 Malaysia
10.3.9 Singapore
10.3.10 Vietnam
10.3.11 Rest of Asia Pacific
10.4 South America
10.4.1 Brazil
10.4.2 Argentina
10.4.3 Colombia
10.4.4 Chile
10.4.5 Peru
10.4.6 Rest of South America
10.5 Rest of the World (RoW)
10.5.1 Middle East
10.5.1.1 Saudi Arabia
10.5.1.2 United Arab Emirates
10.5.1.3 Qatar
10.5.1.4 Israel
10.5.1.5 Rest of Middle East
10.5.2 Africa
10.5.2.1 South Africa
10.5.2.2 Egypt
10.5.2.3 Morocco
10.5.2.4 Rest of Africa
11 Strategic Market Intelligence
11.1 Industry Value Network and Supply Chain Assessment
11.2 White-Space and Opportunity Mapping
11.3 Product Evolution and Market Life Cycle Analysis
11.4 Channel, Distributor, and Go-to-Market Assessment
12 Industry Developments and Strategic Initiatives
12.1 Mergers and Acquisitions
12.2 Partnerships, Alliances, and Joint Ventures
12.3 New Product Launches and Certifications
12.4 Capacity Expansion and Investments
12.5 Other Strategic Initiatives
13 Company Profiles
13.1 BASF SE
13.2 Dow Inc.
13.3 Covestro AG
13.4 SABIC
13.5 Arkema S.A.
13.6 Evonik Industries AG
13.7 Cargill, Incorporated
13.8 Archer-Daniels-Midland Company
13.9 Braskem S.A.
13.10 Corbion N.V.
13.11 Novonesis A/S
13.12 LanzaTech Global, Inc.
13.13 Avantium N.V.
13.14 Mitsubishi Chemical Group Corporation
13.15 TotalEnergies Corbion B.V.
13.16 Neste Oyj
13.17 Eastman Chemical Company
13.18 Solvay S.A.
List of Tables
1 Global Sustainable Chemicals Market Outlook, By Region (2023–2034) ($MN)
2 Global Sustainable Chemicals Market Outlook, By Product Category (2023–2034) ($MN)
3 Global Sustainable Chemicals Market Outlook, By Bio-Based Chemicals (2023–2034) ($MN)
4 Global Sustainable Chemicals Market Outlook, By Recycled and Circular Chemicals (2023–2034) ($MN)
5 Global Sustainable Chemicals Market Outlook, By Low-Carbon and Reduced-Footprint Chemicals (2023–2034) ($MN)
6 Global Sustainable Chemicals Market Outlook, By Green Specialty Chemicals (2023–2034) ($MN)
7 Global Sustainable Chemicals Market Outlook, By Feedstock Source (2023–2034) ($MN)
8 Global Sustainable Chemicals Market Outlook, By Biomass and Agricultural Feedstocks (2023–2034) ($MN)
9 Global Sustainable Chemicals Market Outlook, By Waste and Recycled Feedstocks (2023–2034) ($MN)
10 Global Sustainable Chemicals Market Outlook, By Captured Carbon Dioxide (2023–2034) ($MN)
11 Global Sustainable Chemicals Market Outlook, By Green Hydrogen (2023–2034) ($MN)
12 Global Sustainable Chemicals Market Outlook, By Reduced-Carbon Fossil Feedstocks (2023–2034) ($MN)
13 Global Sustainable Chemicals Market Outlook, By Production Technology (2023–2034) ($MN)
14 Global Sustainable Chemicals Market Outlook, By Industrial Biotechnology and Fermentation (2023–2034) ($MN)
15 Global Sustainable Chemicals Market Outlook, By Green Chemistry and Catalysis (2023–2034) ($MN)
16 Global Sustainable Chemicals Market Outlook, By Chemical and Advanced Recycling (2023–2034) ($MN)
17 Global Sustainable Chemicals Market Outlook, By Carbon Capture and Utilization (2023–2034) ($MN)
18 Global Sustainable Chemicals Market Outlook, By Process Electrification and Efficiency (2023–2034) ($MN)
19 Global Sustainable Chemicals Market Outlook, By Chemical Product (2023–2034) ($MN)
20 Global Sustainable Chemicals Market Outlook, By Bio-Alcohols (2023–2034) ($MN)
21 Global Sustainable Chemicals Market Outlook, By Bio-Organic Acids (2023–2034) ($MN)
22 Global Sustainable Chemicals Market Outlook, By Biopolymers (2023–2034) ($MN)
23 Global Sustainable Chemicals Market Outlook, By Bio-Based Solvents (2023–2034) ($MN)
24 Global Sustainable Chemicals Market Outlook, By Surfactants (2023–2034) ($MN)
25 Global Sustainable Chemicals Market Outlook, By Platform and Intermediate Chemicals (2023–2034) ($MN)
26 Global Sustainable Chemicals Market Outlook, By Other Sustainable Chemical Products (2023–2034) ($MN)
27 Global Sustainable Chemicals Market Outlook, By End-Use Industry (2023–2034) ($MN)
28 Global Sustainable Chemicals Market Outlook, By Packaging and Plastics (2023–2034) ($MN)
29 Global Sustainable Chemicals Market Outlook, By Automotive and Transportation (2023–2034) ($MN)
30 Global Sustainable Chemicals Market Outlook, By Construction (2023–2034) ($MN)
31 Global Sustainable Chemicals Market Outlook, By Agriculture (2023–2034) ($MN)
32 Global Sustainable Chemicals Market Outlook, By Textiles (2023–2034) ($MN)
33 Global Sustainable Chemicals Market Outlook, By Consumer Products and Personal Care (2023–2034) ($MN)
34 Global Sustainable Chemicals Market Outlook, By Electronics (2023–2034) ($MN)
35 Global Sustainable Chemicals Market Outlook, By Pharmaceuticals and Healthcare (2023–2034) ($MN)
36 Global Sustainable Chemicals Market Outlook, By Other Industries (2023–2034) ($MN)
Note: Tables for North America, Europe, APAC, South America, and Rest of the World (RoW) Regions are also represented in the same manner as above.
List of Figures
RESEARCH METHODOLOGY
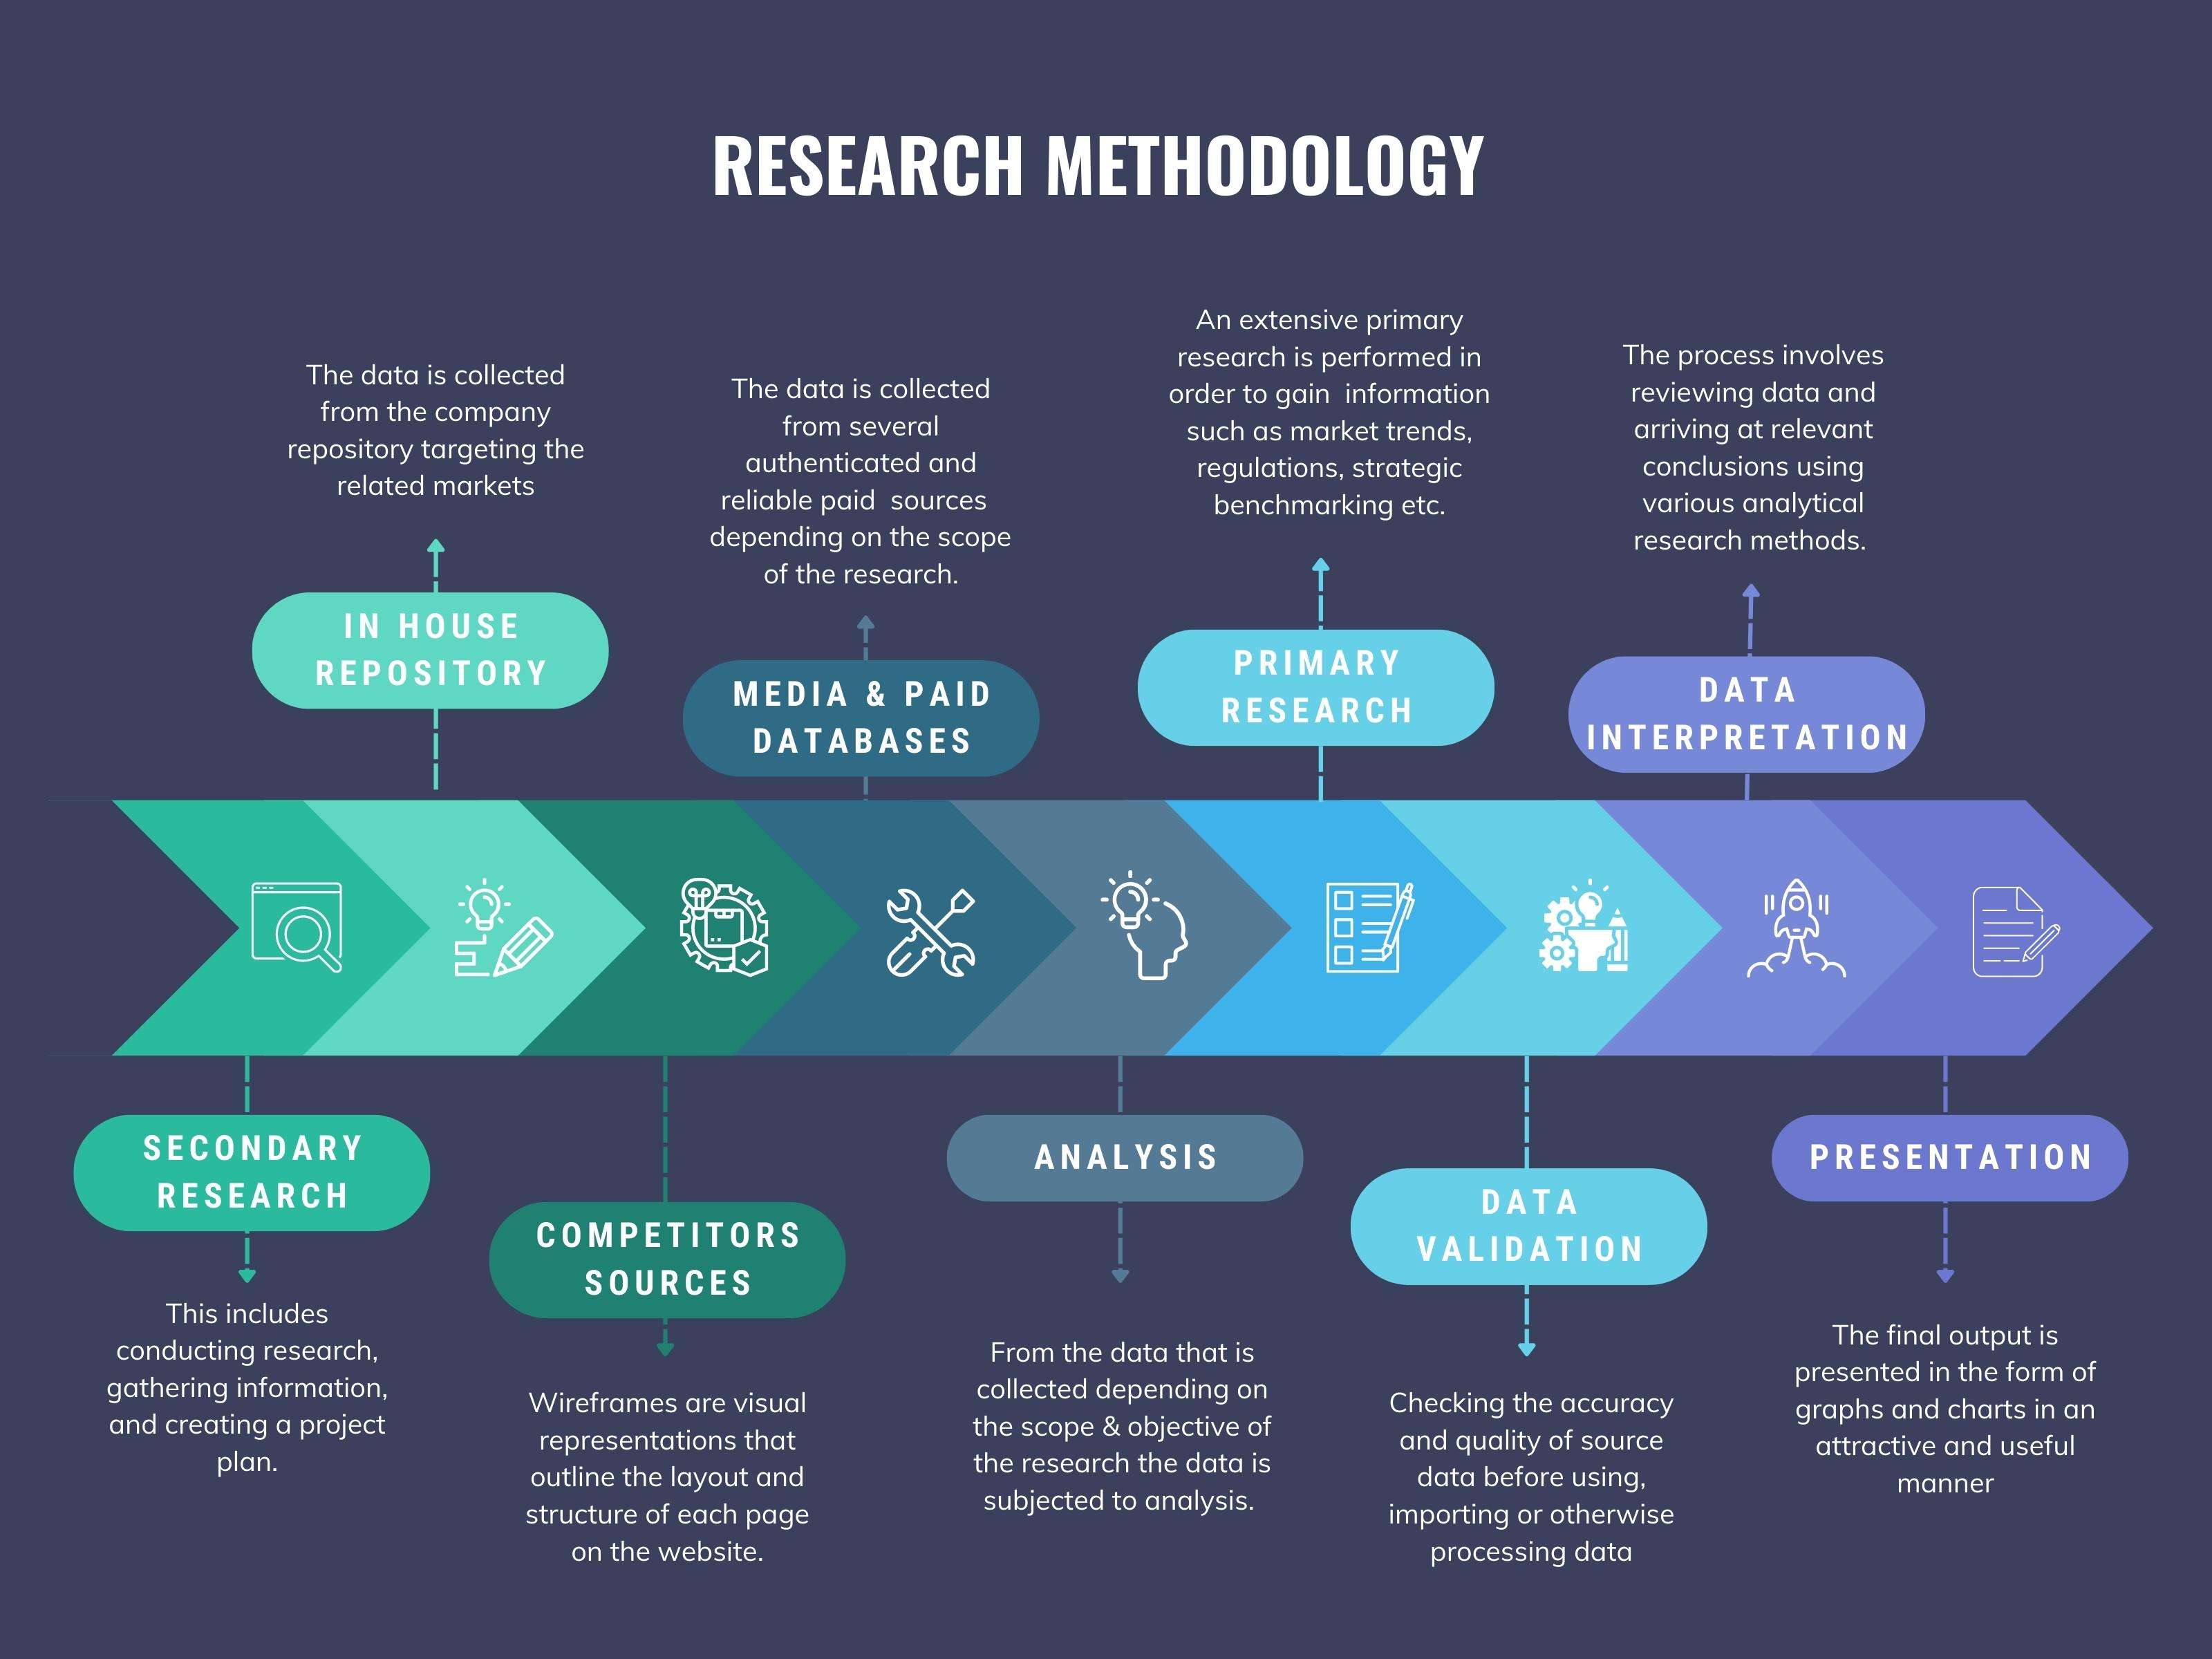
We at ‘Stratistics’ opt for an extensive research approach which involves data mining, data validation, and data analysis. The various research sources include in-house repository, secondary research, competitor’s sources, social media research, client internal data, and primary research.
Our team of analysts prefers the most reliable and authenticated data sources in order to perform the comprehensive literature search. With access to most of the authenticated data bases our team highly considers the best mix of information through various sources to obtain extensive and accurate analysis.
Each report takes an average time of a month and a team of 4 industry analysts. The time may vary depending on the scope and data availability of the desired market report. The various parameters used in the market assessment are standardized in order to enhance the data accuracy.
Data Mining
The data is collected from several authenticated, reliable, paid and unpaid sources and is filtered depending on the scope & objective of the research. Our reports repository acts as an added advantage in this procedure. Data gathering from the raw material suppliers, distributors and the manufacturers is performed on a regular basis, this helps in the comprehensive understanding of the products value chain. Apart from the above mentioned sources the data is also collected from the industry consultants to ensure the objective of the study is in the right direction.
Market trends such as technological advancements, regulatory affairs, market dynamics (Drivers, Restraints, Opportunities and Challenges) are obtained from scientific journals, market related national & international associations and organizations.
Data Analysis
From the data that is collected depending on the scope & objective of the research the data is subjected for the analysis. The critical steps that we follow for the data analysis include:
- Product Lifecycle Analysis
- Competitor analysis
- Risk analysis
- Porters Analysis
- PESTEL Analysis
- SWOT Analysis
The data engineering is performed by the core industry experts considering both the Marketing Mix Modeling and the Demand Forecasting. The marketing mix modeling makes use of multiple-regression techniques to predict the optimal mix of marketing variables. Regression factor is based on a number of variables and how they relate to an outcome such as sales or profits.
Data Validation
The data validation is performed by the exhaustive primary research from the expert interviews. This includes telephonic interviews, focus groups, face to face interviews, and questionnaires to validate our research from all aspects. The industry experts we approach come from the leading firms, involved in the supply chain ranging from the suppliers, distributors to the manufacturers and consumers so as to ensure an unbiased analysis.
We are in touch with more than 15,000 industry experts with the right mix of consultants, CEO's, presidents, vice presidents, managers, experts from both supply side and demand side, executives and so on.
The data validation involves the primary research from the industry experts belonging to:
- Leading Companies
- Suppliers & Distributors
- Manufacturers
- Consumers
- Industry/Strategic Consultants
Apart from the data validation the primary research also helps in performing the fill gap research, i.e. providing solutions for the unmet needs of the research which helps in enhancing the reports quality.
For more details about research methodology, kindly write to us at info@strategymrc.com
Frequently Asked Questions
In case of any queries regarding this report, you can contact the customer service by filing the “Inquiry Before Buy” form available on the right hand side. You may also contact us through email: info@strategymrc.com or phone: +1-301-202-5929
Yes, the samples are available for all the published reports. You can request them by filling the “Request Sample” option available in this page.
Yes, you can request a sample with your specific requirements. All the customized samples will be provided as per the requirement with the real data masked.
All our reports are available in Digital PDF format. In case if you require them in any other formats, such as PPT, Excel etc you can submit a request through “Inquiry Before Buy” form available on the right hand side. You may also contact us through email: info@strategymrc.com or phone: +1-301-202-5929
We offer a free 15% customization with every purchase. This requirement can be fulfilled for both pre and post sale. You may send your customization requirements through email at info@strategymrc.com or call us on +1-301-202-5929.
We have 3 different licensing options available in electronic format.
- Single User Licence: Allows one person, typically the buyer, to have access to the ordered product. The ordered product cannot be distributed to anyone else.
- 2-5 User Licence: Allows the ordered product to be shared among a maximum of 5 people within your organisation.
- Corporate License: Allows the product to be shared among all employees of your organisation regardless of their geographical location.
All our reports are typically be emailed to you as an attachment.
To order any available report you need to register on our website. The payment can be made either through CCAvenue or PayPal payments gateways which accept all international cards.
We extend our support to 6 months post sale. A post sale customization is also provided to cover your unmet needs in the report.
Request Customization
We offer complimentary customization of up to 15% with every purchase. To share your customization requirements, feel free to email us at info@strategymrc.com or call us on +1-301-202-5929. .
Please Note: Customization within the 15% threshold is entirely free of charge. If your request exceeds this limit, we will conduct a feasibility assessment. Following that, a detailed quote and timeline will be provided.
WHY CHOOSE US ?

Assured Quality
Best in class reports with high standard of research integrity

24X7 Research Support
Continuous support to ensure the best customer experience.

Free Customization
Adding more values to your product of interest.

Safe & Secure Access
Providing a secured environment for all online transactions.

Trusted by 600+ Brands
Serving the most reputed brands across the world.