
Used Car Market
Used Car Market Forecasts to 2030 - Global Analysis By Vehicle Type (Sedans, SUVs/Crossovers, Trucks, Luxury Cars, Hatchbacks, Electric and Hybrid Vehicles and Other Vehicle Types), Price Range, Age of Vehicle, End User and By Geography
|
Years Covered |
2022-2030 |
|
CAGR (2024 - 2030) |
16.1% |
|
Regions Covered |
North America, Europe, Asia Pacific, South America, and Middle East & Africa |
|
Countries Covered |
US, Canada, Mexico, Germany, UK, Italy, France, Spain, Japan, China, India, Australia, New Zealand, South Korea, Rest of Asia Pacific, South America, Argentina, Brazil, Chile, Middle East & Africa, Saudi Arabia, UAE, Qatar, and South Africa |
|
Largest Market |
North America |
|
Highest Growing Market |
Asia Pacific |
According to Stratistics MRC, the Global Used Car Market is growing at a CAGR of 16.1% during the forecast period. A used car is a vehicle that has been previously owned and driven by one or more individuals before being resold. Unlike new cars, used cars are typically older models with varying levels of wear, mileage, and condition. They are sold by private owners, dealerships, or online platforms, and often come at a lower price than new cars. Buyers of used cars may need to assess the vehicle’s maintenance history, overall condition, and potential repair needs. Depending on the model’s age, used cars may offer cost savings but could require more attention to mechanical or aesthetic issues.
Market Dynamics:
Driver:
Increased online platforms
The rise of online platforms has significantly transformed the market, making it easier for buyers and sellers to connect. Websites and apps offer detailed listings, price comparisons, customer reviews, and even virtual car inspections. This convenience helps expand the reach of dealerships and private sellers, allowing consumers to browse a wide selection from anywhere. Online platforms also enhance transparency, making it easier to check a vehicle’s history and condition, increasing trust and reducing the risks associated with buying a used car.
Restraint:
Lack of transparency
The lack of transparency in the market can lead to significant negative effects for buyers. Hidden issues such as undisclosed accidents, odometer fraud, or poor maintenance history may result in unexpected repair costs and safety concerns. Without clear information on the car's condition, buyers face greater risks, leading to mistrust in the market. This lack of transparency can discourage potential customers, reduce market confidence, and potentially increase the likelihood of disputes between buyers and sellers.
Opportunity:
Consumer preference for variety
Consumer preference for variety in the market is driven by the desire for a wide selection of models, features, and price points. Buyers can explore different makes, colors, and configurations, including older models or discontinued versions that are no longer available as new cars. This variety allows consumers to find vehicles that fit their specific needs, tastes, and budgets, enhancing the appeal of the used car market. It also encourages more competition, leading to better deals for buyers.
Threat:
Quality concerns
Quality concerns in the used car market can lead to buyers facing unexpected repair costs, mechanical failures, and diminished vehicle reliability. These issues often arise from hidden wear and tear or poor maintenance by previous owners. Such concerns can cause consumers to hesitate or avoid purchasing used cars altogether, limiting market growth. Additionally, the fear of costly repairs or purchasing a poorly maintained vehicle may reduce trust in used car sellers, especially if proper inspections or warranties are not provided.
Covid-19 Impact:
The COVID-19 pandemic had a mixed impact on the market. During the initial lockdowns, sales dropped due to financial uncertainty and restrictions. However, as people sought safer alternatives to public transportation, demand for used cars rebounded. Supply chain disruptions also led to shortages in new car production, pushing more consumers toward pre-owned vehicles. Increased reliance on online platforms for buying and selling used cars became more prominent, driving digital transformation in the market.
The sedans segment is expected to be the largest market share during the forecast period
The sedans segment is expected to account for the largest market share during the forecast period. Offering ample interior space, better fuel efficiency, and a smooth driving experience, sedans appeal to families, commuters, and those seeking a reliable vehicle. Popular models like the Toyota Camry and Honda Accord maintain strong resale value. Despite the rise of SUVs, sedans continue to hold steady demand, especially for buyers looking for a more economical, stylish, and versatile used car option.
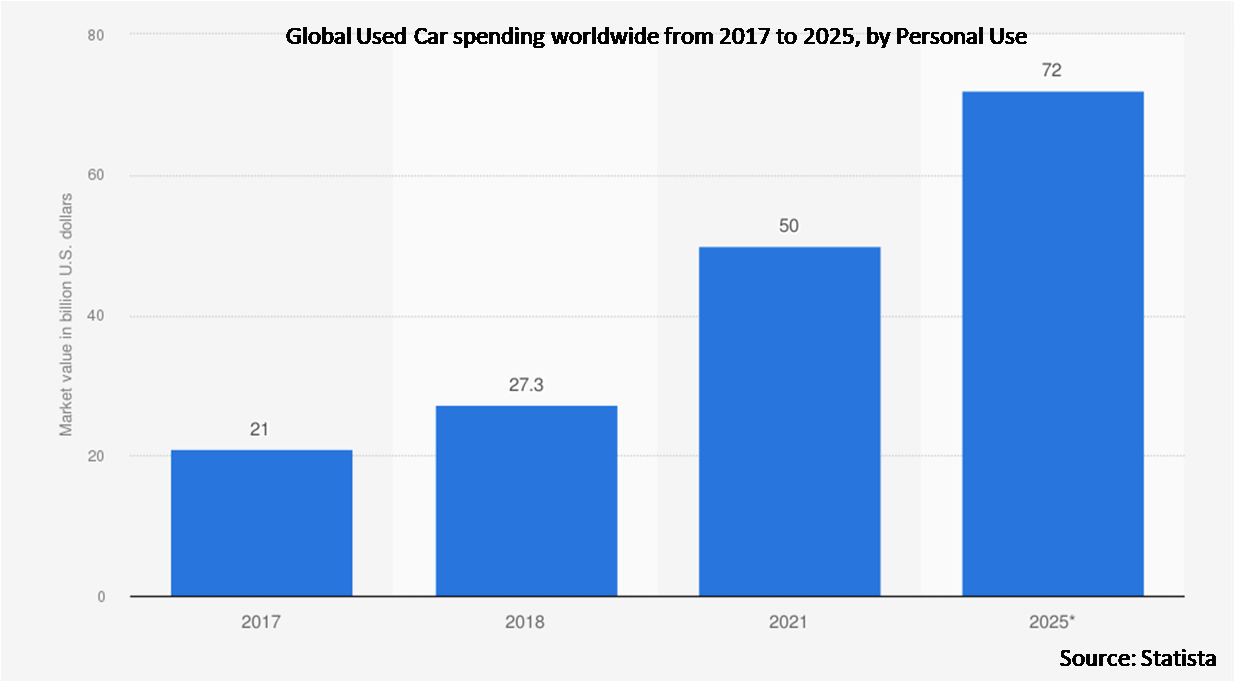
The personal use segment is expected to have the highest CAGR during the forecast period
Over the forecast period, the personal use segment is predicted to witness the highest growth rate. Used cars offer cost savings over new models, making them attractive for individuals on a budget. Factors like fuel efficiency, reliability, and maintenance history play a significant role in personal-use purchases. As personal transportation needs continue to grow, the demand for used cars remains strong, with buyers looking for dependable vehicles that suit their lifestyle and needs.
Region with largest share:
During the forecast period, the North America region is expected to hold the largest market share. The market benefits from a high vehicle turnover rate, with buyers seeking alternatives to new cars due to lower prices and slower depreciation. Popular models like trucks, sedans, and SUVs dominate the market. Online platforms, such as CarMax and AutoTrader, have made buying used cars more accessible. The market has seen increased activity post-COVID, with higher demand and rising prices due to limited new car inventory.
Region with highest CAGR:
Over the forecast period, the Asia Pacific region is anticipated to exhibit the highest CAGR. With rising concerns about sustainability and a preference for more affordable mobility solutions, used cars are becoming an attractive option for many. Additionally, Due to improvements in vehicle quality and maintenance, cars in the region are lasting longer, which in turn increases the availability of used vehicles. As a result, there is a growing supply of used cars that are in good condition, making them an attractive option for buyers.

Key players in the market
Some of the key players in Used Car market include Carvana, AutoTrader, CarMax, Vroom, Shift, TrueCar, Toyota Certified Used Vehicles, Honda Certified Pre-Owned, BMW Certified Pre-Owned, Mercedes-Benz Certified Pre-Owned, Subaru Certified Pre-Owned, Ford Blue Advantage, Mazda Certified Pre-Owned, DriveTime and AutoNation.
Key Developments:
In December 2024, Toyota Certified Used Vehicles (TCUV) has hit a historic milestone by selling its 8 millionth vehicle. The achievement was marked at Sheehy Toyota of Laurel, where a lucky customer drove off in a stunning 2024 Toyota Camry in Supersonic Red.
In February 2024, Honda Aircraft Company has introduced its Certified Pre-owned (CPO) program to the Asian market at Singapore Airshow. This marks a significant expansion of Honda Aircraft Company’s innovative offerings on a global scale, building on the program’s successful launch in 2023.
Vehicle Types Covered:
• Sedans
• SUVs/Crossovers
• Trucks
• Luxury Cars
• Hatchbacks
• Electric and Hybrid Vehicles
• Other Vehicle Types
Price Ranges Covered:
• Budget
• Mid-Range
• High-End
• Certified Pre-Owned (CPO)
Age of Vehicles Covered:
• Newer Used Cars
• Older Used Cars
• Vintage Cars
End Users Covered:
• Personal Use
• Commercial Use
• Specialized Use
• Government and Public Sector
• Car Rental
• Agricultural Use
• Other End Users
Regions Covered:
• North America
o US
o Canada
o Mexico
• Europe
o Germany
o UK
o Italy
o France
o Spain
o Rest of Europe
• Asia Pacific
o Japan
o China
o India
o Australia
o New Zealand
o South Korea
o Rest of Asia Pacific
• South America
o Argentina
o Brazil
o Chile
o Rest of South America
• Middle East & Africa
o Saudi Arabia
o UAE
o Qatar
o South Africa
o Rest of Middle East & Africa
What our report offers:
- Market share assessments for the regional and country-level segments
- Strategic recommendations for the new entrants
- Covers Market data for the years 2022, 2023, 2024, 2026, and 2030
- Market Trends (Drivers, Constraints, Opportunities, Threats, Challenges, Investment Opportunities, and recommendations)
- Strategic recommendations in key business segments based on the market estimations
- Competitive landscaping mapping the key common trends
- Company profiling with detailed strategies, financials, and recent developments
- Supply chain trends mapping the latest technological advancements
Free Customization Offerings:
All the customers of this report will be entitled to receive one of the following free customization options:
• Company Profiling
o Comprehensive profiling of additional market players (up to 3)
o SWOT Analysis of key players (up to 3)
• Regional Segmentation
o Market estimations, Forecasts and CAGR of any prominent country as per the client's interest (Note: Depends on feasibility check)
• Competitive Benchmarking
o Benchmarking of key players based on product portfolio, geographical presence, and strategic alliances
Table of Contents
1 Executive Summary
2 Preface
2.1 Abstract
2.2 Stake Holders
2.3 Research Scope
2.4 Research Methodology
2.4.1 Data Mining
2.4.2 Data Analysis
2.4.3 Data Validation
2.4.4 Research Approach
2.5 Research Sources
2.5.1 Primary Research Sources
2.5.2 Secondary Research Sources
2.5.3 Assumptions
3 Market Trend Analysis
3.1 Introduction
3.2 Drivers
3.3 Restraints
3.4 Opportunities
3.5 Threats
3.6 End User Analysis
3.7 Emerging Markets
3.8 Impact of Covid-19
4 Porters Five Force Analysis
4.1 Bargaining power of suppliers
4.2 Bargaining power of buyers
4.3 Threat of substitutes
4.4 Threat of new entrants
4.5 Competitive rivalry
5 Global Used Car Market, By Vehicle Type
5.1 Introduction
5.2 Sedans
5.3 SUVs/Crossovers
5.4 Trucks
5.5 Luxury Cars
5.6 Hatchbacks
5.7 Electric and Hybrid Vehicles
5.8 Other Vehicle Types
6 Global Used Car Market, By Price Range
6.1 Introduction
6.2 Budget
6.3 Mid-Range
6.4 High-End
6.5 Certified Pre-Owned (CPO)
7 Global Used Car Market, By Age of Vehicle
7.1 Introduction
7.2 Newer Used Cars
7.3 Older Used Cars
7.4 Vintage Cars
8 Global Used Car Market, By End User
8.1 Introduction
8.2 Personal Use
8.3 Commercial Use
8.4 Specialized Use
8.5 Government and Public Sector
8.6 Car Rental
8.7 Agricultural Use
8.8 Other End Users
9 Global Used Car Market, By Geography
9.1 Introduction
9.2 North America
9.2.1 US
9.2.2 Canada
9.2.3 Mexico
9.3 Europe
9.3.1 Germany
9.3.2 UK
9.3.3 Italy
9.3.4 France
9.3.5 Spain
9.3.6 Rest of Europe
9.4 Asia Pacific
9.4.1 Japan
9.4.2 China
9.4.3 India
9.4.4 Australia
9.4.5 New Zealand
9.4.6 South Korea
9.4.7 Rest of Asia Pacific
9.5 South America
9.5.1 Argentina
9.5.2 Brazil
9.5.3 Chile
9.5.4 Rest of South America
9.6 Middle East & Africa
9.6.1 Saudi Arabia
9.6.2 UAE
9.6.3 Qatar
9.6.4 South Africa
9.6.5 Rest of Middle East & Africa
10 Key Developments
10.1 Agreements, Partnerships, Collaborations and Joint Ventures
10.2 Acquisitions & Mergers
10.3 New Product Launch
10.4 Expansions
10.5 Other Key Strategies
11 Company Profiling
11.1 Carvana
11.2 AutoTrader
11.3 CarMax
11.4 Vroom
11.5 Shift
11.6 TrueCar
11.7 Toyota Certified Used Vehicles
11.8 Honda Certified Pre-Owned
11.9 BMW Certified Pre-Owned
11.10 Mercedes-Benz Certified Pre-Owned
11.11 Subaru Certified Pre-Owned
11.12 Ford Blue Advantage
11.13 Mazda Certified Pre-Owned
11.14 DriveTime
11.15 AutoNation
List of Tables
1 Global Used Car Market Outlook, By Region (2022-2030) ($MN)
2 Global Used Car Market Outlook, By Vehicle Type (2022-2030) ($MN)
3 Global Used Car Market Outlook, By Sedans (2022-2030) ($MN)
4 Global Used Car Market Outlook, By SUVs/Crossovers (2022-2030) ($MN)
5 Global Used Car Market Outlook, By Trucks (2022-2030) ($MN)
6 Global Used Car Market Outlook, By Luxury Cars (2022-2030) ($MN)
7 Global Used Car Market Outlook, By Hatchbacks (2022-2030) ($MN)
8 Global Used Car Market Outlook, By Electric and Hybrid Vehicles (2022-2030) ($MN)
9 Global Used Car Market Outlook, By Other Vehicle Types (2022-2030) ($MN)
10 Global Used Car Market Outlook, By Price Range (2022-2030) ($MN)
11 Global Used Car Market Outlook, By Budget (2022-2030) ($MN)
12 Global Used Car Market Outlook, By Mid-Range (2022-2030) ($MN)
13 Global Used Car Market Outlook, By High-End (2022-2030) ($MN)
14 Global Used Car Market Outlook, By Certified Pre-Owned (CPO) (2022-2030) ($MN)
15 Global Used Car Market Outlook, By Age of Vehicle (2022-2030) ($MN)
16 Global Used Car Market Outlook, By Newer Used Cars (2022-2030) ($MN)
17 Global Used Car Market Outlook, By Older Used Cars (2022-2030) ($MN)
18 Global Used Car Market Outlook, By Vintage Cars (2022-2030) ($MN)
19 Global Used Car Market Outlook, By End User (2022-2030) ($MN)
20 Global Used Car Market Outlook, By Personal Use (2022-2030) ($MN)
21 Global Used Car Market Outlook, By Commercial Use (2022-2030) ($MN)
22 Global Used Car Market Outlook, By Specialized Use (2022-2030) ($MN)
23 Global Used Car Market Outlook, By Government and Public Sector (2022-2030) ($MN)
24 Global Used Car Market Outlook, By Car Rental (2022-2030) ($MN)
25 Global Used Car Market Outlook, By Agricultural Use (2022-2030) ($MN)
26 Global Used Car Market Outlook, By Other End Users (2022-2030) ($MN)
Note: Tables for North America, Europe, APAC, South America, and Middle East & Africa Regions are also represented in the same manner as above.
List of Figures
RESEARCH METHODOLOGY

We at ‘Stratistics’ opt for an extensive research approach which involves data mining, data validation, and data analysis. The various research sources include in-house repository, secondary research, competitor’s sources, social media research, client internal data, and primary research.
Our team of analysts prefers the most reliable and authenticated data sources in order to perform the comprehensive literature search. With access to most of the authenticated data bases our team highly considers the best mix of information through various sources to obtain extensive and accurate analysis.
Each report takes an average time of a month and a team of 4 industry analysts. The time may vary depending on the scope and data availability of the desired market report. The various parameters used in the market assessment are standardized in order to enhance the data accuracy.
Data Mining
The data is collected from several authenticated, reliable, paid and unpaid sources and is filtered depending on the scope & objective of the research. Our reports repository acts as an added advantage in this procedure. Data gathering from the raw material suppliers, distributors and the manufacturers is performed on a regular basis, this helps in the comprehensive understanding of the products value chain. Apart from the above mentioned sources the data is also collected from the industry consultants to ensure the objective of the study is in the right direction.
Market trends such as technological advancements, regulatory affairs, market dynamics (Drivers, Restraints, Opportunities and Challenges) are obtained from scientific journals, market related national & international associations and organizations.
Data Analysis
From the data that is collected depending on the scope & objective of the research the data is subjected for the analysis. The critical steps that we follow for the data analysis include:
- Product Lifecycle Analysis
- Competitor analysis
- Risk analysis
- Porters Analysis
- PESTEL Analysis
- SWOT Analysis
The data engineering is performed by the core industry experts considering both the Marketing Mix Modeling and the Demand Forecasting. The marketing mix modeling makes use of multiple-regression techniques to predict the optimal mix of marketing variables. Regression factor is based on a number of variables and how they relate to an outcome such as sales or profits.
Data Validation
The data validation is performed by the exhaustive primary research from the expert interviews. This includes telephonic interviews, focus groups, face to face interviews, and questionnaires to validate our research from all aspects. The industry experts we approach come from the leading firms, involved in the supply chain ranging from the suppliers, distributors to the manufacturers and consumers so as to ensure an unbiased analysis.
We are in touch with more than 15,000 industry experts with the right mix of consultants, CEO's, presidents, vice presidents, managers, experts from both supply side and demand side, executives and so on.
The data validation involves the primary research from the industry experts belonging to:
- Leading Companies
- Suppliers & Distributors
- Manufacturers
- Consumers
- Industry/Strategic Consultants
Apart from the data validation the primary research also helps in performing the fill gap research, i.e. providing solutions for the unmet needs of the research which helps in enhancing the reports quality.
For more details about research methodology, kindly write to us at info@strategymrc.com
Frequently Asked Questions
In case of any queries regarding this report, you can contact the customer service by filing the “Inquiry Before Buy” form available on the right hand side. You may also contact us through email: info@strategymrc.com or phone: +1-301-202-5929
Yes, the samples are available for all the published reports. You can request them by filling the “Request Sample” option available in this page.
Yes, you can request a sample with your specific requirements. All the customized samples will be provided as per the requirement with the real data masked.
All our reports are available in Digital PDF format. In case if you require them in any other formats, such as PPT, Excel etc you can submit a request through “Inquiry Before Buy” form available on the right hand side. You may also contact us through email: info@strategymrc.com or phone: +1-301-202-5929
We offer a free 15% customization with every purchase. This requirement can be fulfilled for both pre and post sale. You may send your customization requirements through email at info@strategymrc.com or call us on +1-301-202-5929.
We have 3 different licensing options available in electronic format.
- Single User Licence: Allows one person, typically the buyer, to have access to the ordered product. The ordered product cannot be distributed to anyone else.
- 2-5 User Licence: Allows the ordered product to be shared among a maximum of 5 people within your organisation.
- Corporate License: Allows the product to be shared among all employees of your organisation regardless of their geographical location.
All our reports are typically be emailed to you as an attachment.
To order any available report you need to register on our website. The payment can be made either through CCAvenue or PayPal payments gateways which accept all international cards.
We extend our support to 6 months post sale. A post sale customization is also provided to cover your unmet needs in the report.
Request Customization
We offer complimentary customization of up to 15% with every purchase. To share your customization requirements, feel free to email us at info@strategymrc.com or call us on +1-301-202-5929. .
Please Note: Customization within the 15% threshold is entirely free of charge. If your request exceeds this limit, we will conduct a feasibility assessment. Following that, a detailed quote and timeline will be provided.
WHY CHOOSE US ?

Assured Quality
Best in class reports with high standard of research integrity

24X7 Research Support
Continuous support to ensure the best customer experience.

Free Customization
Adding more values to your product of interest.

Safe & Secure Access
Providing a secured environment for all online transactions.

Trusted by 600+ Brands
Serving the most reputed brands across the world.