
Warehouse Automation Market
Warehouse Automation Market Forecasts to 2032 - Global Analysis By Component (Hardware, Software and Services), Warehouse Type, Deployment Mode, Technology, Application, End User and By Geography

|
Years Covered |
2024-2032 |
|
Estimated Year Value (2025) |
US $28.9 BN |
|
Projected Year Value (2032) |
US $91.6 BN |
|
CAGR (2025-2032) |
17.9% |
|
Regions Covered |
North America, Europe, Asia Pacific, South America, and Middle East & Africa |
|
Countries Covered |
US, Canada, Mexico, Germany, UK, Italy, France, Spain, Japan, China, India, Australia, New Zealand, South Korea, Rest of Asia Pacific, South America, Argentina, Brazil, Chile, Middle East & Africa, Saudi Arabia, UAE, Qatar, and South Africa |
|
Largest Market |
Asia Pacific |
|
Highest Growing Market |
North America |
According to Stratistics MRC, the Global Warehouse Automation Market is accounted for $28.9 billion in 2025 and is expected to reach $91.6 billion by 2032 growing at a CAGR of 17.9% during the forecast period. Warehouse automation refers to the use of technology and systems to perform tasks and processes within a warehouse with minimal human intervention. It involves the integration of software, robotics, sensors, and automated equipment such as conveyor belts, automated guided vehicles (AGVs), and robotic arms to enhance efficiency, accuracy, and speed in warehousing operations. Automation streamlines activities like inventory management, order picking, sorting, packing, and shipping. By reducing manual labor and human errors, warehouse automation improves productivity, lowers operational costs, and supports scalability.
According to the United Nations Conference on Trade and Development (UNCTAD) the value of global trade registered rise of $1 trillion dollars to reach $7.7 trillion in Q1 2022, as compared to Q1 2021.
Market Dynamics:
Driver:
Rising E-commerce and Omnichannel Retailing
Rising e-commerce and omnichannel retailing are significantly driving the market by increasing the demand for faster, more accurate, and scalable fulfillment solutions. As consumers expect quicker deliveries and seamless shopping experiences across platforms, retailers are investing heavily in automated systems such as robotic picking, automated storage, and retrieval systems. These technologies enhance operational efficiency, reduce labor dependency, and improve order accuracy. The surge in online orders and the complexity of managing multiple sales channels further accelerate automation adoption in warehouses globally.
Restraint:
High Initial Capital Investment
High initial capital investment poses a significant barrier to the growth of the warehouse automation market. The substantial upfront costs associated with purchasing, installing, and integrating advanced automation technologies deter small and medium-sized enterprises from adopting such solutions. This financial burden can delay implementation timelines, limit scalability, and reduce overall market penetration, particularly in emerging economies, thereby hindering the widespread adoption and expansion of warehouse automation systems.
Opportunity:
Technological Advancements
Technological advancements are significantly driving the growth of the market by enabling greater efficiency, accuracy, and scalability in operations. Innovations such as AI-powered robotics, IoT-enabled sensors, and machine learning algorithms streamline inventory management, reduce labor costs, and enhance real-time data analytics. These advancements allow for faster order fulfillment and improved operational flexibility, meeting the rising demands of e-commerce and omnichannel retail. As a result, businesses increasingly adopt automation to gain a competitive edge and improve overall productivity.
Threat:
Integration Challenges with Legacy Systems
Integration challenges with legacy systems negatively impact the warehouse automation market by creating compatibility issues, increasing implementation costs, and delaying deployment timelines. Older infrastructure often lacks the flexibility to support modern automation technologies, resulting in operational inefficiencies and resistance to change. These challenges can discourage investments in automation, especially for companies with limited budgets or complex existing systems, thereby hindering overall market growth and adoption of advanced warehouse solutions.
Covid-19 Impact
The Covid-19 pandemic significantly accelerated the adoption of warehouse automation as companies faced labor shortages, social distancing mandates, and surging e-commerce demand. Businesses rapidly invested in automated systems to ensure operational continuity and reduce dependency on manual labor. This shift boosted demand for robotics, automated guided vehicles (AGVs), and warehouse management systems, making automation a critical strategy for resilience, efficiency, and scalability in a rapidly evolving supply chain landscape.
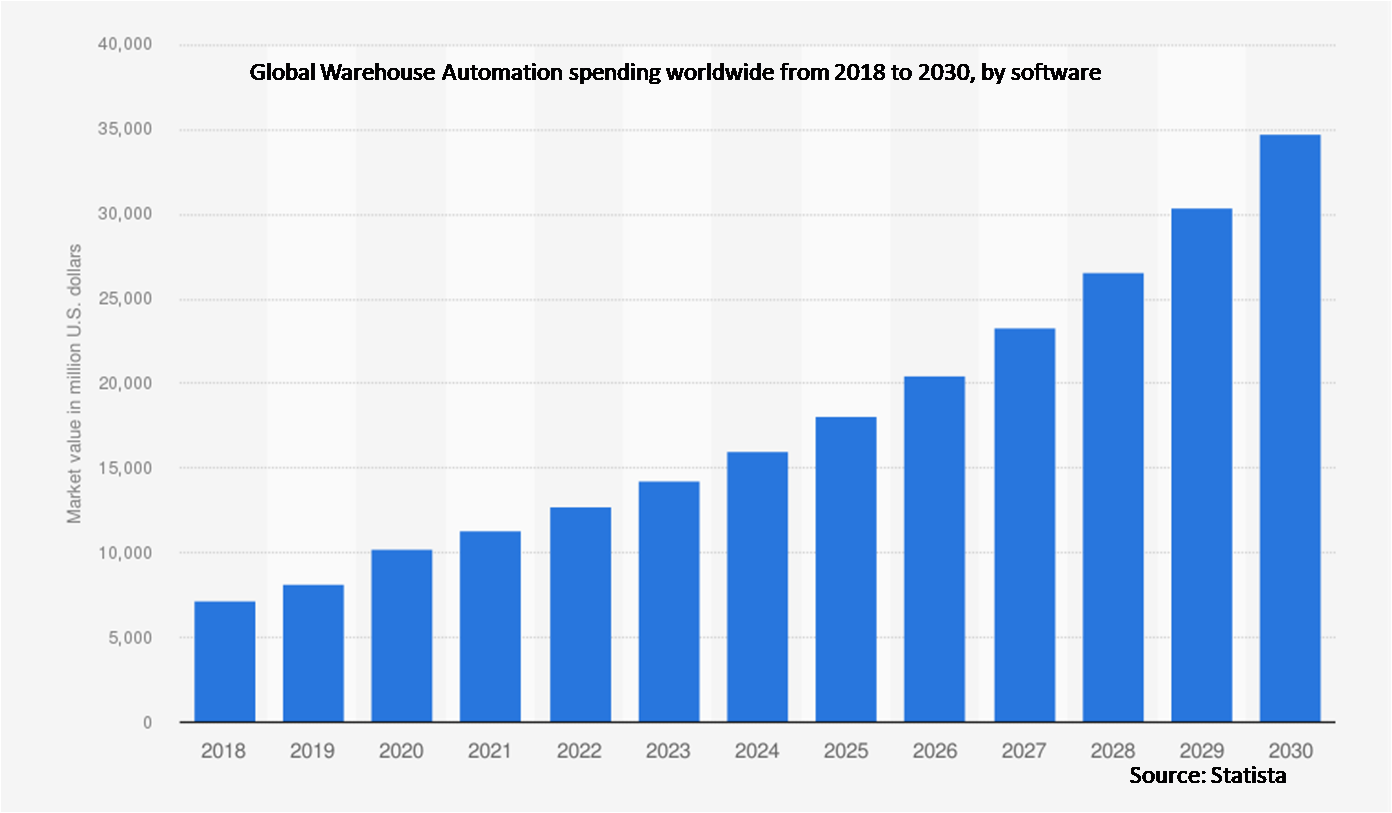
The software segment is expected to be the largest during the forecast period
The software segment is expected to account for the largest market share during the forecast period as it enables intelligent decision-making, and seamless coordination between automated systems. Advanced software solutions such as warehouse management systems (WMS) and warehouse control systems (WCS) enhance operational efficiency, reduce errors, and optimize workflows. The integration of AI, IoT, and data analytics within software platforms further boosts automation performance, driving demand for smarter, scalable, and adaptable warehouse solutions across various industries seeking to improve productivity and accuracy.
The healthcare segment is expected to have the highest CAGR during the forecast period
Over the forecast period, the healthcare segment is predicted to witness the highest growth rate, due to increasing adoption of automated storage, retrieval systems, and robotics in healthcare warehouses, efficiency and inventory control have significantly improved. The need for strict regulatory compliance and temperature-sensitive storage further accelerates automation adoption. Additionally, growing e-commerce in healthcare and hospital supply chains is pushing for streamlined operations, boosting the demand for intelligent, automated warehousing solutions.
Region with largest share:
During the forecast period, the Asia Pacific region is expected to hold the largest market share due to rapid industrialization, booming e-commerce, and growing adoption of advanced technologies like robotics and AI. Countries like China, India, and Japan are heavily investing in smart logistics and infrastructure upgrades to improve supply chain efficiency. Rising labor costs and demand for faster, error-free operations are further propelling automation. These trends collectively position Asia Pacific as a major growth driver for the global warehouse automation industry.
Region with highest CAGR:
Over the forecast period, the North America region is anticipated to exhibit the highest CAGR, owing to rising e-commerce penetration, and the need for faster order fulfillment. Companies are increasingly adopting robotics, automated storage, and retrieval systems to enhance operational efficiency and accuracy. The region’s strong technological infrastructure and high investment capacity support rapid automation deployment. Additionally, the growing focus on supply chain optimization and real-time inventory management further propels market demand, positioning North America as a leader in warehouse automation innovation.

Key players in the market
Some of the key players profiled in the Warehouse Automation Market includeDaifuku Co., Ltd., Dematic, Honeywell Intelligrated, Swisslog (KUKA AG), SSI Schaefer, TGW Logistics Group, KNAPP AG, Murata Machinery, Ltd., Vanderlande Industries, Bastian Solutions, Siemens Logistics, Omron Corporation, ABB Ltd., Rockwell Automation, Zebra Technologies, Locus Robotics, GreyOrange, Geek+ and AutoStore.
Key Developments:
In May 2025, Steel Authority of India Limited (SAIL) has entered a Memorandum of Understanding with ABB India to digitally revolutionize operations at its Rourkela Steel Plant in Odisha. Under the agreement, ABB will deploy data-driven models to develop “digital twins” of the plant’s blast furnaces and basic oxygen furnaces in the steel melt shop.
In March 2025, ABB has signed a Leveraged Procurement Agreement (LPA) with Dow, to serve as the automation partner for the Path2Zero ethylene complex at Dow’s Fort Saskatchewan facility in Alberta, Canada. This brownfield expansion aims to create the world’s first net-zero Scope?1 and?2 emissions ethylene plant by retrofitting existing infrastructure and adding approximately 1.8?million tonnes of capacity by 2030.
In January 2025, ABB Robotics and Agilent Technologies have formalized a strategic collaboration to integrate ABB’s cutting edge robotic systems with Agilent’s analytical instrumentation and laboratory software.
Components Covered:
• Hardware
• Software
• Service
Warehouse Types Covered:
• E-Commerce Fulfillment Centers
• Retail Distribution Centers
• Cold Storage Warehouses
• Manufacturing Warehouses
• Third-Party Logistics (3PL) Warehouses
Deployment Modes Covered:
• On-Premise
• Cloud-Based
• Hybrid
Technologies Covered:
• Automated Storage And Retrieval Systems (AS/RS)
• Autonomous Mobile Robots (Amrs)
• Automated Guided Vehicles (Agvs)
• Conveyor & Sortation Systems
• Robotic Picking & Handling Systems
• Warehouse Management & Execution Software
Applications Covered:
• Order Fulfillment Automation
• Inventory Tracking & Management
• Goods-To-Person (GTP) Solutions
• Palletizing & Depalletizing
• Automated Packaging & Labeling
• Reverse Logistics & Returns Handling
• Other Applications
End Users Covered:
• E-Commerce
• Food & Beverage
• Retail & Consumer Goods
• Healthcare
• Automotive
• Industrial
• Other End Users
Regions Covered:
• North America
o US
o Canada
o Mexico
• Europe
o Germany
o UK
o Italy
o France
o Spain
o Rest of Europe
• Asia Pacific
o Japan
o China
o India
o Australia
o New Zealand
o South Korea
o Rest of Asia Pacific
• South America
o Argentina
o Brazil
o Chile
o Rest of South America
• Middle East & Africa
o Saudi Arabia
o UAE
o Qatar
o South Africa
o Rest of Middle East & Africa
What our report offers:
- Market share assessments for the regional and country-level segments
- Strategic recommendations for the new entrants
- Covers Market data for the years 2022, 2023, 2024, 2026, and 2030
- Market Trends (Drivers, Constraints, Opportunities, Threats, Challenges, Investment Opportunities, and recommendations)
- Strategic recommendations in key business segments based on the market estimations
- Competitive landscaping mapping the key common trends
- Company profiling with detailed strategies, financials, and recent developments
- Supply chain trends mapping the latest technological advancements
Free Customization Offerings:
All the customers of this report will be entitled to receive one of the following free customization options:
• Company Profiling
o Comprehensive profiling of additional market players (up to 3)
o SWOT Analysis of key players (up to 3)
• Regional Segmentation
o Market estimations, Forecasts and CAGR of any prominent country as per the client's interest (Note: Depends on feasibility check)
• Competitive Benchmarking
o Benchmarking of key players based on product portfolio, geographical presence, and strategic alliances
Table of Contents
1 Executive Summary
2 Preface
2.1 Abstract
2.2 Stake Holders
2.3 Research Scope
2.4 Research Methodology
2.4.1 Data Mining
2.4.2 Data Analysis
2.4.3 Data Validation
2.4.4 Research Approach
2.5 Research Sources
2.5.1 Primary Research Sources
2.5.2 Secondary Research Sources
2.5.3 Assumptions
3 Market Trend Analysis
3.1 Introduction
3.2 Drivers
3.3 Restraints
3.4 Opportunities
3.5 Threats
3.6 Technology Analysis
3.7 Application Analysis
3.8 End User Analysis
3.9 Emerging Markets
3.10 Impact of Covid-19
4 Porters Five Force Analysis
4.1 Bargaining power of suppliers
4.2 Bargaining power of buyers
4.3 Threat of substitutes
4.4 Threat of new entrants
4.5 Competitive rivalry
5 Global Warehouse Automation Market, By Component
5.1 Introduction
5.2 Hardware
5.3 Software
5.4 Services
6 Global Warehouse Automation Market, By Warehouse Type
6.1 Introduction
6.2 E-Commerce Fulfillment Centers
6.3 Retail Distribution Centers
6.4 Cold Storage Warehouses
6.5 Manufacturing Warehouses
6.6 Third-Party Logistics (3PL) Warehouses
7 Global Warehouse Automation Market, By Deployment Mode
7.1 Introduction
7.2 On-Premise
7.3 Cloud-Based
7.4 Hybrid
8 Global Warehouse Automation Market, By Technology
8.1 Introduction
8.2 Automated Storage And Retrieval Systems (AS/RS)
8.3 Autonomous Mobile Robots (Amrs)
8.4 Automated Guided Vehicles (Agvs)
8.5 Conveyor & Sortation Systems
8.6 Robotic Picking & Handling Systems
8.7 Warehouse Management & Execution Software
9 Global Warehouse Automation Market, By Application
9.1 Introduction
9.2 Order Fulfillment Automation
9.3 Inventory Tracking & Management
9.4 Goods-To-Person (GTP) Solutions
9.5 Palletizing & Depalletizing
9.6 Automated Packaging & Labeling
9.7 Reverse Logistics & Returns Handling
9.8 Other Applications
10 Global Warehouse Automation Market, By End User
10.1 Introduction
10.2 E-Commerce
10.3 Food & Beverage
10.4 Retail & Consumer Goods
10.5 Healthcare
10.6 Automotive
10.7 Industrial
10.8 Other End Users
11 Global Warehouse Automation Market, By Geography
11.1 Introduction
11.2 North America
11.2.1 US
11.2.2 Canada
11.2.3 Mexico
11.3 Europe
11.3.1 Germany
11.3.2 UK
11.3.3 Italy
11.3.4 France
11.3.5 Spain
11.3.6 Rest of Europe
11.4 Asia Pacific
11.4.1 Japan
11.4.2 China
11.4.3 India
11.4.4 Australia
11.4.5 New Zealand
11.4.6 South Korea
11.4.7 Rest of Asia Pacific
11.5 South America
11.5.1 Argentina
11.5.2 Brazil
11.5.3 Chile
11.5.4 Rest of South America
11.6 Middle East & Africa
11.6.1 Saudi Arabia
11.6.2 UAE
11.6.3 Qatar
11.6.4 South Africa
11.6.5 Rest of Middle East & Africa
12 Key Developments
12.1 Agreements, Partnerships, Collaborations and Joint Ventures
12.2 Acquisitions & Mergers
12.3 New Product Launch
12.4 Expansions
12.5 Other Key Strategies
13 Company Profiling
13.1 Daifuku Co., Ltd.
13.2 Dematic
13.3 Honeywell Intelligrated
13.4 Swisslog (KUKA AG)
13.5 SSI Schaefer
13.6 TGW Logistics Group
13.7 KNAPP AG
13.8 Murata Machinery, Ltd.
13.9 Vanderlande Industries
13.10 Bastian Solutions
13.11 Siemens Logistics
13.12 Omron Corporation
13.13 ABB Ltd.
13.14 Rockwell Automation
13.15 Zebra Technologies
13.16 Locus Robotics
13.17 GreyOrange
13.18 Geek+
13.19 AutoStore
List of Tables
1 Global Warehouse Automation Market Outlook, By Region (2024-2032) ($MN)
2 Global Warehouse Automation Market Outlook, By Component (2024-2032) ($MN)
3 Global Warehouse Automation Market Outlook, By Hardware (2024-2032) ($MN)
4 Global Warehouse Automation Market Outlook, By Software (2024-2032) ($MN)
5 Global Warehouse Automation Market Outlook, By Services (2024-2032) ($MN)
6 Global Warehouse Automation Market Outlook, By Warehouse Type (2024-2032) ($MN)
7 Global Warehouse Automation Market Outlook, By E-Commerce Fulfillment Centers (2024-2032) ($MN)
8 Global Warehouse Automation Market Outlook, By Retail Distribution Centers (2024-2032) ($MN)
9 Global Warehouse Automation Market Outlook, By Cold Storage Warehouses (2024-2032) ($MN)
10 Global Warehouse Automation Market Outlook, By Manufacturing Warehouses (2024-2032) ($MN)
11 Global Warehouse Automation Market Outlook, By Third-Party Logistics (3PL) Warehouses (2024-2032) ($MN)
12 Global Warehouse Automation Market Outlook, By Deployment Mode (2024-2032) ($MN)
13 Global Warehouse Automation Market Outlook, By On-Premise (2024-2032) ($MN)
14 Global Warehouse Automation Market Outlook, By Cloud-Based (2024-2032) ($MN)
15 Global Warehouse Automation Market Outlook, By Hybrid (2024-2032) ($MN)
16 Global Warehouse Automation Market Outlook, By Technology (2024-2032) ($MN)
17 Global Warehouse Automation Market Outlook, By Automated Storage And Retrieval Systems (AS/RS) (2024-2032) ($MN)
18 Global Warehouse Automation Market Outlook, By Autonomous Mobile Robots (Amrs) (2024-2032) ($MN)
19 Global Warehouse Automation Market Outlook, By Automated Guided Vehicles (Agvs) (2024-2032) ($MN)
20 Global Warehouse Automation Market Outlook, By Conveyor & Sortation Systems (2024-2032) ($MN)
21 Global Warehouse Automation Market Outlook, By Robotic Picking & Handling Systems (2024-2032) ($MN)
22 Global Warehouse Automation Market Outlook, By Warehouse Management & Execution Software (2024-2032) ($MN)
23 Global Warehouse Automation Market Outlook, By Application (2024-2032) ($MN)
24 Global Warehouse Automation Market Outlook, By Order Fulfillment Automation (2024-2032) ($MN)
25 Global Warehouse Automation Market Outlook, By Inventory Tracking & Management (2024-2032) ($MN)
26 Global Warehouse Automation Market Outlook, By Goods-To-Person (GTP) Solutions (2024-2032) ($MN)
27 Global Warehouse Automation Market Outlook, By Palletizing & Depalletizing (2024-2032) ($MN)
28 Global Warehouse Automation Market Outlook, By Automated Packaging & Labeling (2024-2032) ($MN)
29 Global Warehouse Automation Market Outlook, By Reverse Logistics & Returns Handling (2024-2032) ($MN)
30 Global Warehouse Automation Market Outlook, By Other Applications (2024-2032) ($MN)
31 Global Warehouse Automation Market Outlook, By End User (2024-2032) ($MN)
32 Global Warehouse Automation Market Outlook, By E-Commerce (2024-2032) ($MN)
33 Global Warehouse Automation Market Outlook, By Food & Beverage (2024-2032) ($MN)
34 Global Warehouse Automation Market Outlook, By Retail & Consumer Goods (2024-2032) ($MN)
35 Global Warehouse Automation Market Outlook, By Healthcare (2024-2032) ($MN)
36 Global Warehouse Automation Market Outlook, By Automotive (2024-2032) ($MN)
37 Global Warehouse Automation Market Outlook, By Industrial (2024-2032) ($MN)
38 Global Warehouse Automation Market Outlook, By Other End Users (2024-2032) ($MN)
Note: Tables for North America, Europe, APAC, South America, and Middle East & Africa Regions are also represented in the same manner as above.
List of Figures
RESEARCH METHODOLOGY

We at ‘Stratistics’ opt for an extensive research approach which involves data mining, data validation, and data analysis. The various research sources include in-house repository, secondary research, competitor’s sources, social media research, client internal data, and primary research.
Our team of analysts prefers the most reliable and authenticated data sources in order to perform the comprehensive literature search. With access to most of the authenticated data bases our team highly considers the best mix of information through various sources to obtain extensive and accurate analysis.
Each report takes an average time of a month and a team of 4 industry analysts. The time may vary depending on the scope and data availability of the desired market report. The various parameters used in the market assessment are standardized in order to enhance the data accuracy.
Data Mining
The data is collected from several authenticated, reliable, paid and unpaid sources and is filtered depending on the scope & objective of the research. Our reports repository acts as an added advantage in this procedure. Data gathering from the raw material suppliers, distributors and the manufacturers is performed on a regular basis, this helps in the comprehensive understanding of the products value chain. Apart from the above mentioned sources the data is also collected from the industry consultants to ensure the objective of the study is in the right direction.
Market trends such as technological advancements, regulatory affairs, market dynamics (Drivers, Restraints, Opportunities and Challenges) are obtained from scientific journals, market related national & international associations and organizations.
Data Analysis
From the data that is collected depending on the scope & objective of the research the data is subjected for the analysis. The critical steps that we follow for the data analysis include:
- Product Lifecycle Analysis
- Competitor analysis
- Risk analysis
- Porters Analysis
- PESTEL Analysis
- SWOT Analysis
The data engineering is performed by the core industry experts considering both the Marketing Mix Modeling and the Demand Forecasting. The marketing mix modeling makes use of multiple-regression techniques to predict the optimal mix of marketing variables. Regression factor is based on a number of variables and how they relate to an outcome such as sales or profits.
Data Validation
The data validation is performed by the exhaustive primary research from the expert interviews. This includes telephonic interviews, focus groups, face to face interviews, and questionnaires to validate our research from all aspects. The industry experts we approach come from the leading firms, involved in the supply chain ranging from the suppliers, distributors to the manufacturers and consumers so as to ensure an unbiased analysis.
We are in touch with more than 15,000 industry experts with the right mix of consultants, CEO's, presidents, vice presidents, managers, experts from both supply side and demand side, executives and so on.
The data validation involves the primary research from the industry experts belonging to:
- Leading Companies
- Suppliers & Distributors
- Manufacturers
- Consumers
- Industry/Strategic Consultants
Apart from the data validation the primary research also helps in performing the fill gap research, i.e. providing solutions for the unmet needs of the research which helps in enhancing the reports quality.
For more details about research methodology, kindly write to us at info@strategymrc.com
Frequently Asked Questions
In case of any queries regarding this report, you can contact the customer service by filing the “Inquiry Before Buy” form available on the right hand side. You may also contact us through email: info@strategymrc.com or phone: +1-301-202-5929
Yes, the samples are available for all the published reports. You can request them by filling the “Request Sample” option available in this page.
Yes, you can request a sample with your specific requirements. All the customized samples will be provided as per the requirement with the real data masked.
All our reports are available in Digital PDF format. In case if you require them in any other formats, such as PPT, Excel etc you can submit a request through “Inquiry Before Buy” form available on the right hand side. You may also contact us through email: info@strategymrc.com or phone: +1-301-202-5929
We offer a free 15% customization with every purchase. This requirement can be fulfilled for both pre and post sale. You may send your customization requirements through email at info@strategymrc.com or call us on +1-301-202-5929.
We have 3 different licensing options available in electronic format.
- Single User Licence: Allows one person, typically the buyer, to have access to the ordered product. The ordered product cannot be distributed to anyone else.
- 2-5 User Licence: Allows the ordered product to be shared among a maximum of 5 people within your organisation.
- Corporate License: Allows the product to be shared among all employees of your organisation regardless of their geographical location.
All our reports are typically be emailed to you as an attachment.
To order any available report you need to register on our website. The payment can be made either through CCAvenue or PayPal payments gateways which accept all international cards.
We extend our support to 6 months post sale. A post sale customization is also provided to cover your unmet needs in the report.
Request Customization
We offer complimentary customization of up to 15% with every purchase. To share your customization requirements, feel free to email us at info@strategymrc.com or call us on +1-301-202-5929. .
Please Note: Customization within the 15% threshold is entirely free of charge. If your request exceeds this limit, we will conduct a feasibility assessment. Following that, a detailed quote and timeline will be provided.
WHY CHOOSE US ?

Assured Quality
Best in class reports with high standard of research integrity

24X7 Research Support
Continuous support to ensure the best customer experience.

Free Customization
Adding more values to your product of interest.

Safe & Secure Access
Providing a secured environment for all online transactions.

Trusted by 600+ Brands
Serving the most reputed brands across the world.