
Water Treatment And Purification Chemicals Market
Water Treatment & Purification Chemicals Market Forecasts to 2034 - Global Analysis By Product Type (Coagulants & Flocculants, Biocides & Disinfectants, Scale Inhibitors & Corrosion Inhibitors, Chelating Agents, pH Adjusters & Stabilizers, Anti-Foaming Agents and Other Product Types), End User and By Geography

|
Years Covered |
2023-2034 |
|
Estimated Year Value (2026) |
US $17.78 BN |
|
Projected Year Value (2034) |
US $24.33 BN |
|
CAGR (2026-2034) |
4.0% |
|
Regions Covered |
North America, Europe, Asia Pacific, South America, and Rest of the World (RoW) |
|
Countries Covered |
United States, Canada, Mexico, United Kingdom, Germany, France, Italy, Spain, Netherlands, Belgium, Sweden, Switzerland, Poland, Rest of Europe, China, Japan, India, South Korea, Australia, Indonesia, Thailand, Malaysia, Singapore, Vietnam, Rest of Asia Pacific, Brazil, Argentina, Colombia, Chile, Peru, Rest of South America, Saudi Arabia, United Arab Emirates, Qatar, Israel, Rest of Middle East, South Africa, Egypt, Morocco, and Rest of Africa. |
|
Largest Market |
Asia Pacific |
|
Highest Growing Market |
Middle East & Africa |
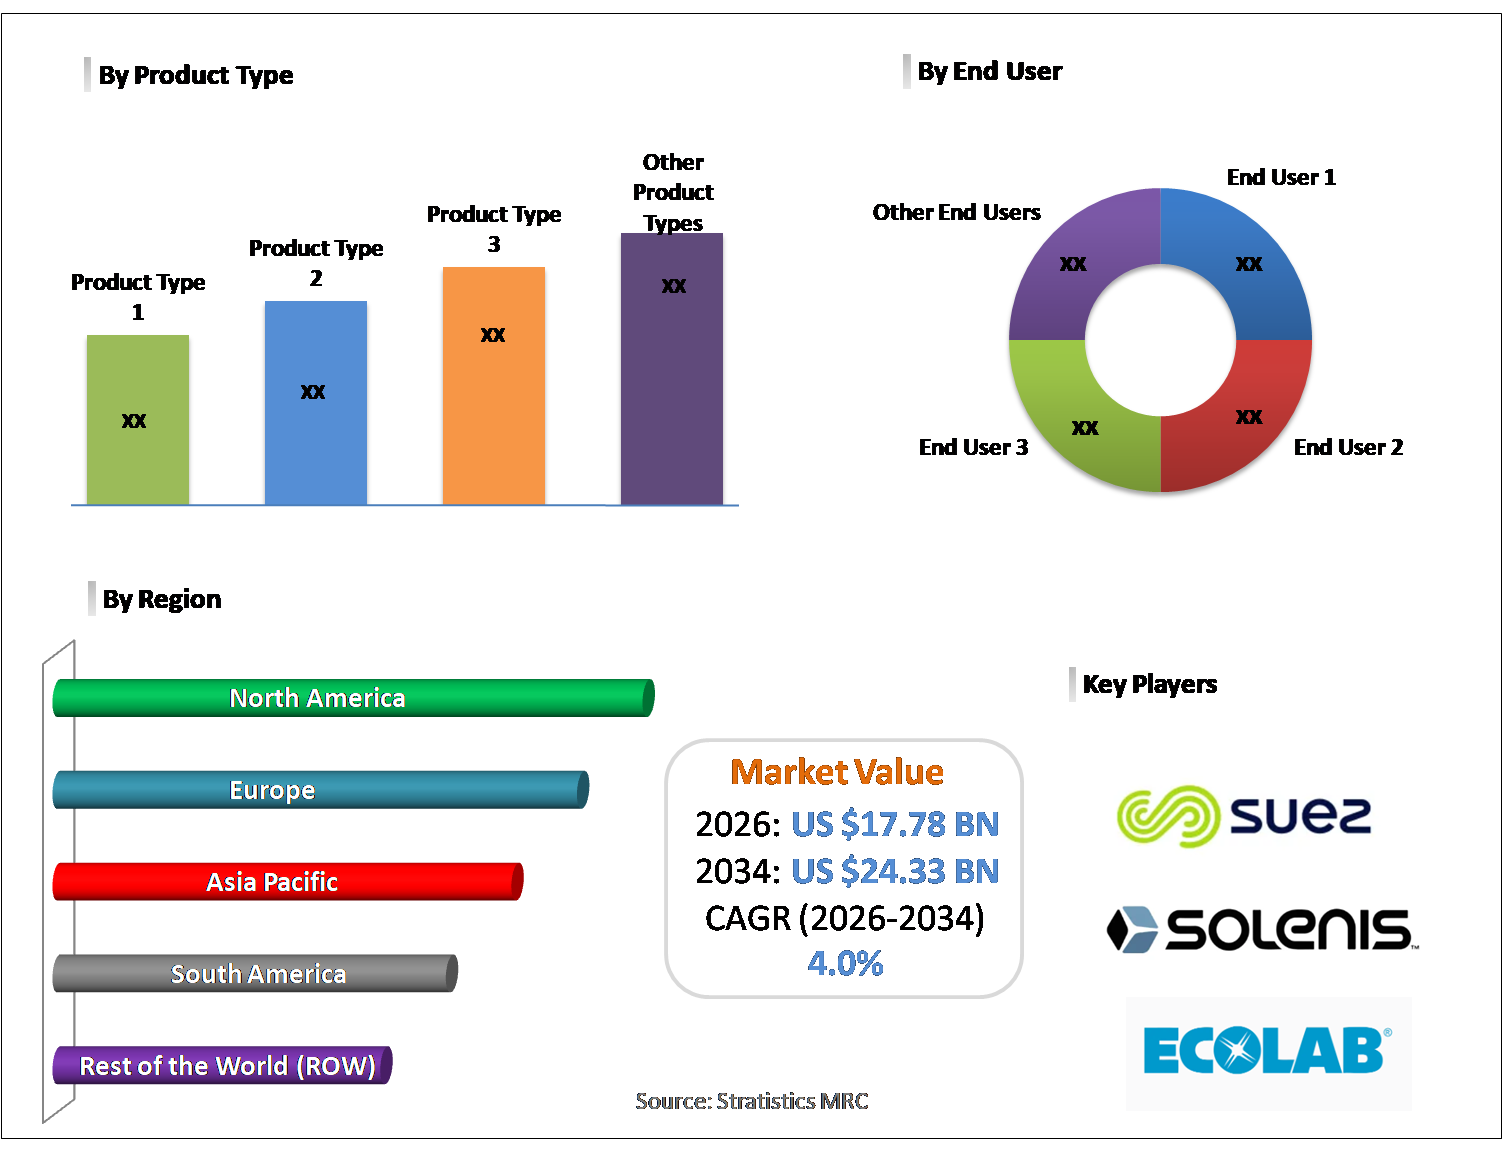
According to Stratistics MRC, the Global Water Treatment & Purification Chemicals Market is accounted for $17.78 billion in 2026 and is expected to reach $24.33 billion by 2034 growing at a CAGR of 4.0% during the forecast period. Water treatment and purification chemicals are essential for providing clean and safe water across industries, municipalities, and homes. They include substances like coagulants, disinfectants, pH regulators, and corrosion preventatives, which eliminate contaminants, microbes, and harmful particles. These chemicals improve water quality, protect infrastructure from corrosion and scaling, and ensure regulatory compliance. Increasing industrial activities, stringent water quality norms, and concerns about water scarcity are boosting the demand for effective water treatment solutions. Technological innovations and emphasis on sustainable water management further support the consistent expansion of this market globally.
According to the United Nations World Water Development Report (UNESCO, 2023), 80% of the world’s wastewater is released untreated into the environment. This creates regulatory and environmental pressure for industries and municipalities to adopt treatment solutions, where purification chemicals are essential.
Market Dynamics:
Driver:
Rising water scarcity
Increasing freshwater shortages, driven by population growth, urban development, and climate shifts, are amplifying the requirement for water treatment solutions. Chemicals for purification enable water recycling and reuse across industries, agriculture, and municipalities. They remove harmful substances, microbes, and metals, ensuring safety and compliance. Investments in water infrastructure by governments and private organizations aim to combat scarcity, further stimulating demand for treatment chemicals. Efficient water utilization and protection of public health are central concerns, making water purification chemicals vital and driving consistent growth in the market globally.
Restraint:
High cost of chemicals
Expensive water treatment chemicals pose a significant challenge to market growth. Specialty chemicals like coagulants, disinfectants, and corrosion inhibitors demand high investment, which can burden small and medium enterprises. Ongoing expenses for procurement and maintenance, coupled with volatile raw material costs, such as chlorine and polymers, increase financial pressure. In developing countries, budget limitations restrict widespread adoption of chemical-based water purification systems. This high-cost factor reduces the implementation of advanced treatment technologies, slowing market penetration and restraining growth across industrial and municipal water treatment sectors globally.
Opportunity:
Growing demand for safe drinking water
Increasing concern over water contamination and waterborne illnesses is driving opportunities in the water treatment chemicals sector. Public and private entities, along with governments, are investing in chemical solutions to provide safe drinking water. Rapid urban growth and expanding populations heighten the need for treated water, particularly in emerging economies. Chemicals such as coagulants, disinfectants, and pH regulators play a vital role in removing impurities and pathogens. This growing emphasis on public health motivates innovation in chemical treatments. The heightened focus on safe water access offers substantial growth prospects for the water treatment and purification chemicals market.
Threat:
Competition from alternative technologies
Emerging water treatment methods, including UV sterilization, membrane systems, and bio-based approaches, threaten conventional chemical-based markets. These solutions often minimize chemical usage, providing eco-friendly, efficient, and cost-effective alternatives. Municipalities and industrial users increasingly prefer non-chemical methods for water purification, disinfection, and wastewater management. Growing adoption of such technologies can reduce the demand for traditional treatment chemicals. Manufacturers face pressure to innovate or risk losing market share. Inability to adapt to the transition toward chemical-free or low-chemical processes constitutes a major threat, challenging the relevance and sustainability of the traditional water treatment and purification chemicals industry.
Covid-19 Impact:
The COVID‑19 outbreak had a notable effect on the water treatment chemicals market, introducing challenges and growth opportunities. Supply chain disruptions and operational slowdowns in industries and municipal plants caused uneven demand for chemical products. Temporary restrictions affected procurement and usage of purification chemicals. Simultaneously, the focus on hygiene, sanitation, and safe drinking water increased the need for disinfectants, coagulants, and other chemical solutions. Public health measures prompted government and healthcare investment in water safety to limit viral spread. Ultimately, the pandemic highlighted the critical role of chemical-based water treatment, boosting its long-term adoption and market resilience.
The coagulants & flocculants segment is expected to be the largest during the forecast period
The coagulants & flocculants segment is expected to account for the largest market share during the forecast period because they are critical for eliminating suspended particles, impurities, and turbidity from water. Used extensively in municipal, industrial, and wastewater treatment, these chemicals enhance sedimentation and purification efficiency. Their ability to improve water clarity, minimize contaminants, and facilitate further treatment processes makes them highly sought after. Given their wide-ranging applications and the growing need for safe, treated water in both industrial and urban areas, coagulants and flocculants maintain the largest market share, highlighting their central role in water purification and treatment operations globally.
The oil & gas segment is expected to have the highest CAGR during the forecast period
Over the forecast period, the oil & gas segment is predicted to witness the highest growth rate because of its increasing focus on effective water management. Exploration, refining, and production activities produce significant wastewater that must be treated to control impurities, scaling, and corrosion. Environmental regulations and sustainability initiatives push companies to adopt advanced chemical solutions. Moreover, recycling and reusing process water in onshore and offshore facilities heighten chemical demand. These factors collectively position oil and gas as the fastest-expanding end-use sector, driving substantial growth and creating opportunities for water treatment chemical manufacturers.
Region with largest share:
During the forecast period, the Asia Pacific region is expected to hold the largest market share due to rapid population growth, urban expansion, and industrial development. Nations like China, India, and Japan are experiencing heightened demand for safe municipal and industrial water solutions. Growth is supported by expanding infrastructure, increased awareness of water-related health risks, and stricter environmental standards. Key industries, including power, chemicals, and food processing, rely extensively on chemical-based water treatment methods. Ongoing investments in advanced treatment technologies and rising industrial and municipal water needs make Asia-Pacific the largest regional market, reflecting its pivotal role in the global water treatment and purification chemicals industry.
Region with highest CAGR:
Over the forecast period, the Middle East & Africa region is anticipated to exhibit the highest CAGR, driven by industrial expansion, urban population growth, and severe water scarcity. Key nations, including Saudi Arabia, UAE, and South Africa, are investing in desalination plants, wastewater treatment facilities, and water reuse initiatives. Increasing use of chemicals for purification, scaling control, and corrosion prevention is boosting adoption. Government programs, regulatory enforcement, and infrastructure development in municipal and industrial sectors are further accelerating demand, making the Middle East & Africa the region with the highest growth rate and a rapidly expanding market for water treatment and purification chemicals.

Key players in the market
Some of the key players in Water Treatment & Purification Chemicals Market include BASF SE, Suez SA, Kemira OYJ, BWA Water Additives, Ecolab Inc., Solenis LLC, SNF Group, Kurita Water Industries Ltd, Evoqua Water Technologies, Dow Chemical Company, Veolia, Solvay, Nouryon, Baker Hughes Company, Arxada, Pure Aqua, Inc., Lonza Group AG and Thermax Limited.
Key Developments:
In October 2025, BASF SE and ANDRITZ Group have signed a license agreement for the use of BASF’s proprietary gas treatment technology, OASE® blue, in a carbon capture project planned to be implemented in the city of Aarhus, Denmark. The project aims to capture approximately 435,000 tons of CO2 annually from the flue gases of a waste-to-energy plant for sequestration; the city of Aarhus has set itself the goal of becoming CO2-neutral by 2030.
In October 2025, Dow and MEGlobal have finalized an agreement for Dow to supply an additional equivalent to 100 KTA of ethylene from its Gulf Coast operations. The ethylene will serve as a key feedstock for MEGlobal’s ethylene glycol (EG) manufacturing facility co-located at Dow’s and MEGlobal’s Oyster Creek site.
In June 2025, SUEZ wins a new contract in Kochi City (India) to upgrade water production and distribution services. The State Government owned Kerala Water Authority (KWA), responsible for the development and regulation of water supply and wastewater management in the southern Indian state of Kerala, awarded SUEZ the contract for Kochi City water supply system upgrade, operations and maintenance, under its Kerala Urban Water Services Improvement Programme.
Product Types Covered:
• Coagulants & Flocculants
• Biocides & Disinfectants
• Scale Inhibitors & Corrosion Inhibitors
• Chelating Agents
• pH Adjusters & Stabilizers
• Anti-Foaming Agents
• Other Product Types
End Users Covered:
• Power Generation
• Oil & Gas
• Mining
• Pulp & Paper
• Food & Beverage
• Chemicals
• Other End Users
Regions Covered:
• North America
o United States
o Canada
o Mexico
• Europe
o United Kingdom
o Germany
o France
o Italy
o Spain
o Netherlands
o Belgium
o Sweden
o Switzerland
o Poland
o Rest of Europe
• Asia Pacific
o China
o Japan
o India
o South Korea
o Australia
o Indonesia
o Thailand
o Malaysia
o Singapore
o Vietnam
o Rest of Asia Pacific
• South America
o Brazil
o Argentina
o Colombia
o Chile
o Peru
o Rest of South America
• Rest of the World (RoW)
o Middle East
§ Saudi Arabia
§ United Arab Emirates
§ Qatar
§ Israel
§ Rest of Middle East
o Africa
§ South Africa
§ Egypt
§ Morocco
§ Rest of Africa
What our report offers:
- Market share assessments for the regional and country-level segments
- Strategic recommendations for the new entrants
- Covers Market data for the years 2023, 2024, 2025, 2026, 2027, 2028, 2030, 2032 and 2034
- Market Trends (Drivers, Constraints, Opportunities, Threats, Challenges, Investment Opportunities, and recommendations)
- Strategic recommendations in key business segments based on the market estimations
- Competitive landscaping mapping the key common trends
- Company profiling with detailed strategies, financials, and recent developments
- Supply chain trends mapping the latest technological advancements
Free Customization Offerings:
All the customers of this report will be entitled to receive one of the following free customization options:
• Company Profiling
o Comprehensive profiling of additional market players (up to 3)
o SWOT Analysis of key players (up to 3)
• Regional Segmentation
o Market estimations, Forecasts and CAGR of any prominent country as per the client's interest (Note: Depends on feasibility check)
• Competitive Benchmarking
o Benchmarking of key players based on product portfolio, geographical presence, and strategic alliances
Table of Contents
1 Executive Summary
1.1 Market Snapshot and Key Highlights
1.2 Growth Drivers, Challenges, and Opportunities
1.3 Competitive Landscape Overview
1.4 Strategic Insights and Recommendations
2 Research Framework
2.1 Study Objectives and Scope
2.2 Stakeholder Analysis
2.3 Research Assumptions and Limitations
2.4 Research Methodology
2.4.1 Data Collection (Primary and Secondary)
2.4.2 Data Modeling and Estimation Techniques
2.4.3 Data Validation and Triangulation
2.4.4 Analytical and Forecasting Approach
3 Market Dynamics and Trend Analysis
3.1 Market Definition and Structure
3.2 Key Market Drivers
3.3 Market Restraints and Challenges
3.4 Growth Opportunities and Investment Hotspots
3.5 Industry Threats and Risk Assessment
3.6 Technology and Innovation Landscape
3.7 Emerging and High-Growth Markets
3.8 Regulatory and Policy Environment
3.9 Impact of COVID-19 and Recovery Outlook
4 Competitive and Strategic Assessment
4.1 Porter's Five Forces Analysis
4.1.1 Supplier Bargaining Power
4.1.2 Buyer Bargaining Power
4.1.3 Threat of Substitutes
4.1.4 Threat of New Entrants
4.1.5 Competitive Rivalry
4.2 Market Share Analysis of Key Players
4.3 Product Benchmarking and Performance Comparison
5 Global Water Treatment & Purification Chemicals Market, By Product Type
5.1 Coagulants & Flocculants
5.2 Biocides & Disinfectants
5.3 Scale Inhibitors & Corrosion Inhibitors
5.4 Chelating Agents
5.5 pH Adjusters & Stabilizers
5.6 Anti-Foaming Agents
5.7 Other Product Types
6 Global Water Treatment & Purification Chemicals Market, By End User
6.1 Power Generation
6.2 Oil & Gas
6.3 Mining
6.4 Pulp & Paper
6.5 Food & Beverage
6.6 Chemicals
6.7 Other End Users
7 Global Water Treatment & Purification Chemicals Market, By Geography
7.1 North America
7.1.1 United States
7.1.2 Canada
7.1.3 Mexico
7.2 Europe
7.2.1 United Kingdom
7.2.2 Germany
7.2.3 France
7.2.4 Italy
7.2.5 Spain
7.2.6 Netherlands
7.2.7 Belgium
7.2.8 Sweden
7.2.9 Switzerland
7.2.10 Poland
7.2.11 Rest of Europe
7.3 Asia Pacific
7.3.1 China
7.3.2 Japan
7.3.3 India
7.3.4 South Korea
7.3.5 Australia
7.3.6 Indonesia
7.3.7 Thailand
7.3.8 Malaysia
7.3.9 Singapore
7.3.10 Vietnam
7.3.11 Rest of Asia Pacific
7.4 South America
7.4.1 Brazil
7.4.2 Argentina
7.4.3 Colombia
7.4.4 Chile
7.4.5 Peru
7.4.6 Rest of South America
7.5 Rest of the World (RoW)
7.5.1 Middle East
7.5.1.1 Saudi Arabia
7.5.1.2 United Arab Emirates
7.5.1.3 Qatar
7.5.1.4 Israel
7.5.1.5 Rest of Middle East
7.5.2 Africa
7.5.2.1 South Africa
7.5.2.2 Egypt
7.5.2.3 Morocco
7.5.2.4 Rest of Africa
8 Strategic Market Intelligence
8.1 Industry Value Network and Supply Chain Assessment
8.2 White-Space and Opportunity Mapping
8.3 Product Evolution and Market Life Cycle Analysis
8.4 Channel, Distributor, and Go-to-Market Assessment
9 Industry Developments and Strategic Initiatives
9.1 Mergers and Acquisitions
9.2 Partnerships, Alliances, and Joint Ventures
9.3 New Product Launches and Certifications
9.4 Capacity Expansion and Investments
9.5 Other Strategic Initiatives
10 Company Profiles
10.1 BASF SE
10.2 Suez SA
10.3 Kemira OYJ
10.4 BWA Water Additives
10.5 Ecolab Inc.
10.6 Solenis LLC
10.7 SNF Group
10.8 Kurita Water Industries Ltd
10.9 Evoqua Water Technologies
10.10 Dow Chemical Company
10.11 Veolia
10.12 Solvay
10.13 Nouryon
10.14 Baker Hughes Company
10.15 Arxada
10.16 Pure Aqua, Inc.
10.17 Lonza Group AG
10.18 Thermax Limited
List of Tables
1 Global Water Treatment & Purification Chemicals Market Outlook, By Region (2023-2034) ($MN)
2 Global Water Treatment & Purification Chemicals Market Outlook, By Product Type (2023-2034) ($MN)
3 Global Water Treatment & Purification Chemicals Market Outlook, By Coagulants & Flocculants (2023-2034) ($MN)
4 Global Water Treatment & Purification Chemicals Market Outlook, By Biocides & Disinfectants (2023-2034) ($MN)
5 Global Water Treatment & Purification Chemicals Market Outlook, By Scale Inhibitors & Corrosion Inhibitors (2023-2034) ($MN)
6 Global Water Treatment & Purification Chemicals Market Outlook, By Chelating Agents (2023-2034) ($MN)
7 Global Water Treatment & Purification Chemicals Market Outlook, By pH Adjusters & Stabilizers (2023-2034) ($MN)
8 Global Water Treatment & Purification Chemicals Market Outlook, By Anti-Foaming Agents (2023-2034) ($MN)
9 Global Water Treatment & Purification Chemicals Market Outlook, By Other Product Types (2023-2034) ($MN)
10 Global Water Treatment & Purification Chemicals Market Outlook, By End User (2023-2034) ($MN)
11 Global Water Treatment & Purification Chemicals Market Outlook, By Power Generation (2023-2034) ($MN)
12 Global Water Treatment & Purification Chemicals Market Outlook, By Oil & Gas (2023-2034) ($MN)
13 Global Water Treatment & Purification Chemicals Market Outlook, By Mining (2023-2034) ($MN)
14 Global Water Treatment & Purification Chemicals Market Outlook, By Pulp & Paper (2023-2034) ($MN)
15 Global Water Treatment & Purification Chemicals Market Outlook, By Food & Beverage (2023-2034) ($MN)
16 Global Water Treatment & Purification Chemicals Market Outlook, By Chemicals (2023-2034) ($MN)
17 Global Water Treatment & Purification Chemicals Market Outlook, By Other End Users (2023-2034) ($MN)
Note: Tables for North America, Europe, APAC, South America, and Rest of the World (RoW) Regions are also represented in the same manner as above.
List of Figures
RESEARCH METHODOLOGY

We at ‘Stratistics’ opt for an extensive research approach which involves data mining, data validation, and data analysis. The various research sources include in-house repository, secondary research, competitor’s sources, social media research, client internal data, and primary research.
Our team of analysts prefers the most reliable and authenticated data sources in order to perform the comprehensive literature search. With access to most of the authenticated data bases our team highly considers the best mix of information through various sources to obtain extensive and accurate analysis.
Each report takes an average time of a month and a team of 4 industry analysts. The time may vary depending on the scope and data availability of the desired market report. The various parameters used in the market assessment are standardized in order to enhance the data accuracy.
Data Mining
The data is collected from several authenticated, reliable, paid and unpaid sources and is filtered depending on the scope & objective of the research. Our reports repository acts as an added advantage in this procedure. Data gathering from the raw material suppliers, distributors and the manufacturers is performed on a regular basis, this helps in the comprehensive understanding of the products value chain. Apart from the above mentioned sources the data is also collected from the industry consultants to ensure the objective of the study is in the right direction.
Market trends such as technological advancements, regulatory affairs, market dynamics (Drivers, Restraints, Opportunities and Challenges) are obtained from scientific journals, market related national & international associations and organizations.
Data Analysis
From the data that is collected depending on the scope & objective of the research the data is subjected for the analysis. The critical steps that we follow for the data analysis include:
- Product Lifecycle Analysis
- Competitor analysis
- Risk analysis
- Porters Analysis
- PESTEL Analysis
- SWOT Analysis
The data engineering is performed by the core industry experts considering both the Marketing Mix Modeling and the Demand Forecasting. The marketing mix modeling makes use of multiple-regression techniques to predict the optimal mix of marketing variables. Regression factor is based on a number of variables and how they relate to an outcome such as sales or profits.
Data Validation
The data validation is performed by the exhaustive primary research from the expert interviews. This includes telephonic interviews, focus groups, face to face interviews, and questionnaires to validate our research from all aspects. The industry experts we approach come from the leading firms, involved in the supply chain ranging from the suppliers, distributors to the manufacturers and consumers so as to ensure an unbiased analysis.
We are in touch with more than 15,000 industry experts with the right mix of consultants, CEO's, presidents, vice presidents, managers, experts from both supply side and demand side, executives and so on.
The data validation involves the primary research from the industry experts belonging to:
- Leading Companies
- Suppliers & Distributors
- Manufacturers
- Consumers
- Industry/Strategic Consultants
Apart from the data validation the primary research also helps in performing the fill gap research, i.e. providing solutions for the unmet needs of the research which helps in enhancing the reports quality.
For more details about research methodology, kindly write to us at info@strategymrc.com
Frequently Asked Questions
In case of any queries regarding this report, you can contact the customer service by filing the “Inquiry Before Buy” form available on the right hand side. You may also contact us through email: info@strategymrc.com or phone: +1-301-202-5929
Yes, the samples are available for all the published reports. You can request them by filling the “Request Sample” option available in this page.
Yes, you can request a sample with your specific requirements. All the customized samples will be provided as per the requirement with the real data masked.
All our reports are available in Digital PDF format. In case if you require them in any other formats, such as PPT, Excel etc you can submit a request through “Inquiry Before Buy” form available on the right hand side. You may also contact us through email: info@strategymrc.com or phone: +1-301-202-5929
We offer a free 15% customization with every purchase. This requirement can be fulfilled for both pre and post sale. You may send your customization requirements through email at info@strategymrc.com or call us on +1-301-202-5929.
We have 3 different licensing options available in electronic format.
- Single User Licence: Allows one person, typically the buyer, to have access to the ordered product. The ordered product cannot be distributed to anyone else.
- 2-5 User Licence: Allows the ordered product to be shared among a maximum of 5 people within your organisation.
- Corporate License: Allows the product to be shared among all employees of your organisation regardless of their geographical location.
All our reports are typically be emailed to you as an attachment.
To order any available report you need to register on our website. The payment can be made either through CCAvenue or PayPal payments gateways which accept all international cards.
We extend our support to 6 months post sale. A post sale customization is also provided to cover your unmet needs in the report.
Request Customization
We offer complimentary customization of up to 15% with every purchase. To share your customization requirements, feel free to email us at info@strategymrc.com or call us on +1-301-202-5929. .
Please Note: Customization within the 15% threshold is entirely free of charge. If your request exceeds this limit, we will conduct a feasibility assessment. Following that, a detailed quote and timeline will be provided.
WHY CHOOSE US ?

Assured Quality
Best in class reports with high standard of research integrity

24X7 Research Support
Continuous support to ensure the best customer experience.

Free Customization
Adding more values to your product of interest.

Safe & Secure Access
Providing a secured environment for all online transactions.

Trusted by 600+ Brands
Serving the most reputed brands across the world.