
Alternate Marine Power Market
Alternate Marine Power Market Forecasts to 2028 - Global Analysis By Vessel (Roll-on/Roll-off Ships, Cruises, Container Vessels and Other Vessels), Power Requirement (Above 5 MW, 2 MW- 5 MW, Up to 2 MW and Other Power Requirements) and By Geography

|
Years Covered |
2020-2028 |
|
Estimated Year Value (2022) |
US $1069.4 MN |
|
Projected Year Value (2028) |
US $2250.2 MN |
|
CAGR (2022 - 2028) |
13.2% |
|
Regions Covered |
North America, Europe, Asia Pacific, South America, and Middle East & Africa |
|
Countries Covered |
US, Canada, Mexico, Germany, UK, Italy, France, Spain, Japan, China, India, Australia, New Zealand, South Korea, Rest of Asia Pacific, South America, Argentina, Brazil, Chile, Middle East & Africa, Saudi Arabia, UAE, Qatar, and South Africa |
|
Largest Market |
North America |
|
Highest Growing Market |
Europe |
According to Stratistics MRC, the Global Alternate Marine Power Market is accounted for $1069.4 million in 2022 and is expected to reach $2250.2 million by 2028 growing at a CAGR of 13.2% during the forecast period. Alternate marine power is an anti-pollution measure to provide power to ships when they halt on the port or shore. This utilizes shore electric power as a substitute, which decreases the pollution generated by the diesel generator. Currently, several countries are switching to clean electrical power supply produced from renewable energy sources, which is estimated to further help achieve sustainable use of electricity. The practice of using alternate marine power for ships is gaining traction, as it lowers operation cost by reducing fuel consumption. It also reduces maintenance costs, provides green profiles to ship owners and customers, and reduces noise pollution and exhaust emissions.
According to International Maritime Organization (IMO), carbon emissions account for about 3% of the total CO2 emissions. Concentrated around the coastlines and detrimental to marine life, the European Parliament estimates that the percentage could be as high as 17% by 2050. According to the United Nations Conference on Trade and Development, about 80% of the goods traded across the globe depend on maritime transport.
Market Dynamics:
Driver:
Rising environmental awareness
Greenhouse gas emissions in and around port areas are becoming a major concern around the world. Alternative marine systems provide electricity instead of diesel, reducing greenhouse gas emissions. Renewable energy sources-based natural gases have gathered traction for ships to help reduce carbon footprint of ports. Furthermore, the rising rules and regulations for pollution reduction caused by ships and vessels contribute to the growth of the market.
Restraint:
High initial investment
The initial cost includes the installation of high voltage power transformers, distribution and control panels, electrical distribution systems etc. The initial investment costs required to build alternative land side marine power systems, the operating costs of these systems and the costs required to modify vessels for the alternative marine power systems are high. Hence, these are the factors restraining the expansion of the market.
Opportunity:
Rise in Globalization and Industrialization
Rise in industrialization has created a huge demand for sea trade, owing to the low cost of transportation. Significant opportunities are being introduced for product manufacturing companies, due to globalization in developing countries. This has encouraged transportation of the raw material to places/countries where the manufacturing cost is low. Water transportation has increased around the globe, and this has increased the demand for industrial marine power all over the world.
Threat:
Pollution
The reduction in pollution occurs only when the ship is stationary. When the ship is actually in the water, then because of the usage of conventional engines, pollution will still spread in the marine atmosphere. Moreover, the consumption of electricity can be enormous owing to the size of the ships and tankers. Even certain ships are not compatible and suitable for the process of alternate marine power. Therefore, these are the factors hindering market growth.
Covid-19 Impact
The outbreak of the covid-19 pandemic is anticipated to affect the activities of the transportation and marine industries. Most of the companies postponed contracts and increasing the lead time for material procurement. As more than half of the activities in transportation are on halt during the pandemic situation. Additionally, restrictions imposed by the government on export and import activities hamper the market growth.
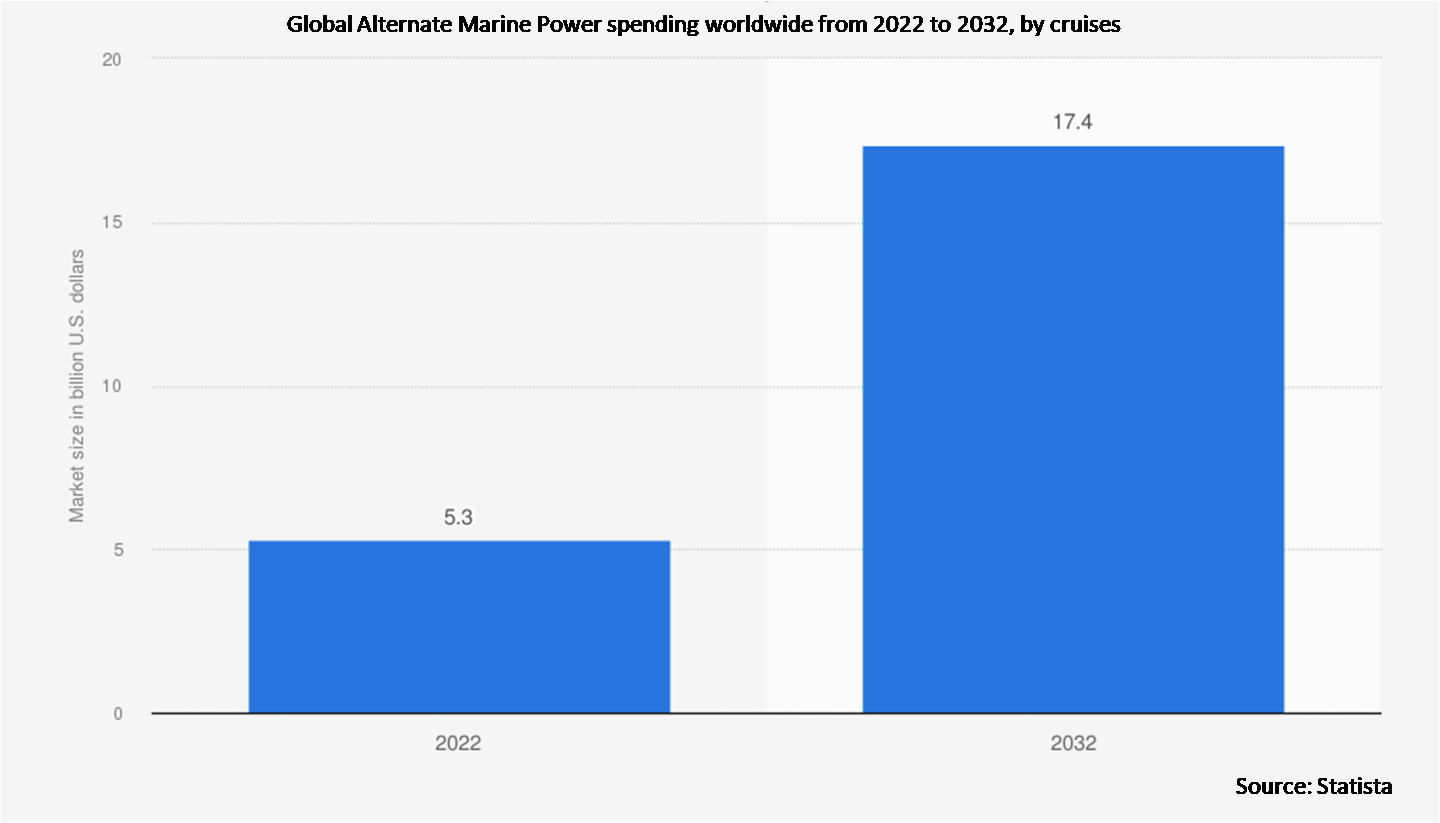
The cruise segment is expected to be the largest during the forecast period
The cruise segment is estimated to have a lucrative growth, due to its advantages like it reduces maintenance costs, provides green profiles to ship owners and customers, and reduces noise pollution and exhaust emissions. Strong economic recovery has led to an increase in consumer spending and a gradual increase in luxury lifestyles and leisure travel expenses. Substantial increase in repositioning cruises refers to moving a ship from one sailing destination to another. Therefore, these are the factors boosting the growth of the segment.
The above 5 MW segment is expected to have the highest CAGR during the forecast period
The above 5 MW segment is anticipated to witness the fastest CAGR growth during the forecast period, due to the high reliability of the power supply. Alternate marine power installation has led to higher fuel efficiency specifically for diesel propulsion systems for all stages of operation. Thus, these aspects are estimated to enhance the growth of the market.
Region with highest share:
North America is projected to hold the largest market share during the forecast period owing to the rising air pollution at ports. The increasing movement of goods and passengers through ports lead to a surge in the number of ships. A strong regulatory framework and higher awareness about the harmful impact of berthing is expected to bode well for these regional markets.
Region with highest CAGR:
Europe is projected to have the highest CAGR over the forecast period, owing to the application of stringent regulations by the government in order to reduce pollution. Implementation of anti-pollution measures and emission norms in cold ironing has invigorated adoption of alternate marine power-based electricity in ships. Furthermore, growth and development of different ports and increase in applications of alternate marine power-based electricity are key factors driving the market in Europe.

Key players in the market
Some of the key players profiled in the Alternate Marine Power Market include Siemens, Cavotec SA, ABB Ltd., Schneider Electric, Wabtec Corporation, Danfoss, PowerCon, MacGregor, Ratio Electric B.V., Nidec ASI, ESL Power Systems, Inc., Piller Group GmbH, Wartsila and VINCI Energies.
Key Developments:
In October 2020, ABB has delivered marine & port shore connection technology to Vikings ferry line. The shore connection technology design is valued at city-ports which will lead to sustainable in-harbour operations.
In June 2019, Schneider Electric and MV Hamnavoe announced a project to supply green electric power to the MV Hamnavoe NorthLink ferry docked in Stromness. The project is the first large commercial ship shore connection in the U.K.
Vessels Covered:
• Roll-on/Roll-off Ships
• Cruises
• Container Vessels
• Other Vessels
Power Requirements Covered:
• Above 5 MW
• 2 MW- 5 MW
• Up to 2 MW
• Other Power Requirements
Regions Covered:
• North America
o US
o Canada
o Mexico
• Europe
o Germany
o UK
o Italy
o France
o Spain
o Rest of Europe
• Asia Pacific
o Japan
o China
o India
o Australia
o New Zealand
o South Korea
o Rest of Asia Pacific
• South America
o Argentina
o Brazil
o Chile
o Rest of South America
• Middle East & Africa
o Saudi Arabia
o UAE
o Qatar
o South Africa
o Rest of Middle East & Africa
What our report offers:
- Market share assessments for the regional and country-level segments
- Strategic recommendations for the new entrants
- Covers Market data for the years 2020, 2021, 2022, 2025, and 2028
- Market Trends (Drivers, Constraints, Opportunities, Threats, Challenges, Investment Opportunities, and recommendations)
- Strategic recommendations in key business segments based on the market estimations
- Competitive landscaping mapping the key common trends
- Company profiling with detailed strategies, financials, and recent developments
- Supply chain trends mapping the latest technological advancements
Free Customization Offerings:
All the customers of this report will be entitled to receive one of the following free customization options:
• Company Profiling
o Comprehensive profiling of additional market players (up to 3)
o SWOT Analysis of key players (up to 3)
• Regional Segmentation
o Market estimations, Forecasts and CAGR of any prominent country as per the client's interest (Note: Depends on feasibility check)
• Competitive Benchmarking
o Benchmarking of key players based on product portfolio, geographical presence, and strategic alliances
Table of Contents
1 Executive Summary
2 Preface
2.1 Abstract
2.2 Stake Holders
2.3 Research Scope
2.4 Research Methodology
2.4.1 Data Mining
2.4.2 Data Analysis
2.4.3 Data Validation
2.4.4 Research Approach
2.5 Research Sources
2.5.1 Primary Research Sources
2.5.2 Secondary Research Sources
2.5.3 Assumptions
3 Market Trend Analysis
3.1 Introduction
3.2 Drivers
3.3 Restraints
3.4 Opportunities
3.5 Threats
3.6 Emerging Markets
3.7 Impact of Covid-19
4 Porters Five Force Analysis
4.1 Bargaining power of suppliers
4.2 Bargaining power of buyers
4.3 Threat of substitutes
4.4 Threat of new entrants
4.5 Competitive rivalry
5 Global Alternate Marine Power Market, By Vessel
5.1 Introduction
5.2 Roll-on/Roll-off Ships
5.3 Cruises
5.4 Container Vessels
5.5 Other Vessels
6 Global Alternate Marine Power Market, By Power Requirement
6.1 Introduction
6.2 Above 5 MW
6.3 2 MW- 5 MW
6.4 Up to 2 MW
6.5 Other Power Requirements
7 Global Alternate Marine Power Market, By Geography
7.1 Introduction
7.2 North America
7.2.1 US
7.2.2 Canada
7.2.3 Mexico
7.3 Europe
7.3.1 Germany
7.3.2 UK
7.3.3 Italy
7.3.4 France
7.3.5 Spain
7.3.6 Rest of Europe
7.4 Asia Pacific
7.4.1 Japan
7.4.2 China
7.4.3 India
7.4.4 Australia
7.4.5 New Zealand
7.4.6 South Korea
7.4.7 Rest of Asia Pacific
7.5 South America
7.5.1 Argentina
7.5.2 Brazil
7.5.3 Chile
7.5.4 Rest of South America
7.6 Middle East & Africa
7.6.1 Saudi Arabia
7.6.2 UAE
7.6.3 Qatar
7.6.4 South Africa
7.6.5 Rest of Middle East & Africa
8 Key Developments
8.1 Agreements, Partnerships, Collaborations and Joint Ventures
8.2 Acquisitions & Mergers
8.3 New Product Launch
8.4 Expansions
8.5 Other Key Strategies
9 Company Profiling
9.1 Siemens
9.2 Cavotec SA
9.3 ABB Ltd.
9.4 Schneider Electric
9.5 Wabtec Corporation
9.6 Danfoss
9.7 PowerCon
9.8 MacGregor
9.9 Ratio Electric B.V.
9.10 Nidec ASI
9.11 ESL Power Systems, Inc.
9.12 Piller Group GmbH
9.13 Wartsila
9.14 VINCI Energies
List of Tables
1 Global Alternate Marine Power Market Outlook, By Region (2020-2028) ($MN)
2 Global Alternate Marine Power Market Outlook, By Vessel (2020-2028) ($MN)
3 Global Alternate Marine Power Market Outlook, By Roll-on/Roll-off Ships (2020-2028) ($MN)
4 Global Alternate Marine Power Market Outlook, By Cruises (2020-2028) ($MN)
5 Global Alternate Marine Power Market Outlook, By Container Vessels (2020-2028) ($MN)
6 Global Alternate Marine Power Market Outlook, By Other Vessels (2020-2028) ($MN)
7 Global Alternate Marine Power Market Outlook, By Power Requirement (2020-2028) ($MN)
8 Global Alternate Marine Power Market Outlook, By Above 5 MW (2020-2028) ($MN)
9 Global Alternate Marine Power Market Outlook, By 2 MW- 5 MW (2020-2028) ($MN)
10 Global Alternate Marine Power Market Outlook, By Up to 2 MW (2020-2028) ($MN)
11 Global Alternate Marine Power Market Outlook, By Other Power Requirements (2020-2028) ($MN)
12 North America Alternate Marine Power Market Outlook, By Country (2020-2028) ($MN)
13 North America Alternate Marine Power Market Outlook, By Vessel (2020-2028) ($MN)
14 North America Alternate Marine Power Market Outlook, By Roll-on/Roll-off Ships (2020-2028) ($MN)
15 North America Alternate Marine Power Market Outlook, By Cruises (2020-2028) ($MN)
16 North America Alternate Marine Power Market Outlook, By Container Vessels (2020-2028) ($MN)
17 North America Alternate Marine Power Market Outlook, By Other Vessels (2020-2028) ($MN)
18 North America Alternate Marine Power Market Outlook, By Power Requirement (2020-2028) ($MN)
19 North America Alternate Marine Power Market Outlook, By Above 5 MW (2020-2028) ($MN)
20 North America Alternate Marine Power Market Outlook, By 2 MW- 5 MW (2020-2028) ($MN)
21 North America Alternate Marine Power Market Outlook, By Up to 2 MW (2020-2028) ($MN)
22 North America Alternate Marine Power Market Outlook, By Other Power Requirements (2020-2028) ($MN)
23 Europe Alternate Marine Power Market Outlook, By Country (2020-2028) ($MN)
24 Europe Alternate Marine Power Market Outlook, By Vessel (2020-2028) ($MN)
25 Europe Alternate Marine Power Market Outlook, By Roll-on/Roll-off Ships (2020-2028) ($MN)
26 Europe Alternate Marine Power Market Outlook, By Cruises (2020-2028) ($MN)
27 Europe Alternate Marine Power Market Outlook, By Container Vessels (2020-2028) ($MN)
28 Europe Alternate Marine Power Market Outlook, By Other Vessels (2020-2028) ($MN)
29 Europe Alternate Marine Power Market Outlook, By Power Requirement (2020-2028) ($MN)
30 Europe Alternate Marine Power Market Outlook, By Above 5 MW (2020-2028) ($MN)
31 Europe Alternate Marine Power Market Outlook, By 2 MW- 5 MW (2020-2028) ($MN)
32 Europe Alternate Marine Power Market Outlook, By Up to 2 MW (2020-2028) ($MN)
33 Europe Alternate Marine Power Market Outlook, By Other Power Requirements (2020-2028) ($MN)
34 Asia Pacific Alternate Marine Power Market Outlook, By Country (2020-2028) ($MN)
35 Asia Pacific Alternate Marine Power Market Outlook, By Vessel (2020-2028) ($MN)
36 Asia Pacific Alternate Marine Power Market Outlook, By Roll-on/Roll-off Ships (2020-2028) ($MN)
37 Asia Pacific Alternate Marine Power Market Outlook, By Cruises (2020-2028) ($MN)
38 Asia Pacific Alternate Marine Power Market Outlook, By Container Vessels (2020-2028) ($MN)
39 Asia Pacific Alternate Marine Power Market Outlook, By Other Vessels (2020-2028) ($MN)
40 Asia Pacific Alternate Marine Power Market Outlook, By Power Requirement (2020-2028) ($MN)
41 Asia Pacific Alternate Marine Power Market Outlook, By Above 5 MW (2020-2028) ($MN)
42 Asia Pacific Alternate Marine Power Market Outlook, By 2 MW- 5 MW (2020-2028) ($MN)
43 Asia Pacific Alternate Marine Power Market Outlook, By Up to 2 MW (2020-2028) ($MN)
44 Asia Pacific Alternate Marine Power Market Outlook, By Other Power Requirements (2020-2028) ($MN)
45 South America Alternate Marine Power Market Outlook, By Country (2020-2028) ($MN)
46 South America Alternate Marine Power Market Outlook, By Vessel (2020-2028) ($MN)
47 South America Alternate Marine Power Market Outlook, By Roll-on/Roll-off Ships (2020-2028) ($MN)
48 South America Alternate Marine Power Market Outlook, By Cruises (2020-2028) ($MN)
49 South America Alternate Marine Power Market Outlook, By Container Vessels (2020-2028) ($MN)
50 South America Alternate Marine Power Market Outlook, By Other Vessels (2020-2028) ($MN)
51 South America Alternate Marine Power Market Outlook, By Power Requirement (2020-2028) ($MN)
52 South America Alternate Marine Power Market Outlook, By Above 5 MW (2020-2028) ($MN)
53 South America Alternate Marine Power Market Outlook, By 2 MW- 5 MW (2020-2028) ($MN)
54 South America Alternate Marine Power Market Outlook, By Up to 2 MW (2020-2028) ($MN)
55 South America Alternate Marine Power Market Outlook, By Other Power Requirements (2020-2028) ($MN)
56 Middle East & Africa Alternate Marine Power Market Outlook, By Country (2020-2028) ($MN)
57 Middle East & Africa Alternate Marine Power Market Outlook, By Vessel (2020-2028) ($MN)
58 Middle East & Africa Alternate Marine Power Market Outlook, By Roll-on/Roll-off Ships (2020-2028) ($MN)
59 Middle East & Africa Alternate Marine Power Market Outlook, By Cruises (2020-2028) ($MN)
60 Middle East & Africa Alternate Marine Power Market Outlook, By Container Vessels (2020-2028) ($MN)
61 Middle East & Africa Alternate Marine Power Market Outlook, By Other Vessels (2020-2028) ($MN)
62 Middle East & Africa Alternate Marine Power Market Outlook, By Power Requirement (2020-2028) ($MN)
63 Middle East & Africa Alternate Marine Power Market Outlook, By Above 5 MW (2020-2028) ($MN)
64 Middle East & Africa Alternate Marine Power Market Outlook, By 2 MW- 5 MW (2020-2028) ($MN)
65 Middle East & Africa Alternate Marine Power Market Outlook, By Up to 2 MW (2020-2028) ($MN)
66 Middle East & Africa Alternate Marine Power Market Outlook, By Other Power Requirements (2020-2028) ($MN)
List of Figures
RESEARCH METHODOLOGY

We at ‘Stratistics’ opt for an extensive research approach which involves data mining, data validation, and data analysis. The various research sources include in-house repository, secondary research, competitor’s sources, social media research, client internal data, and primary research.
Our team of analysts prefers the most reliable and authenticated data sources in order to perform the comprehensive literature search. With access to most of the authenticated data bases our team highly considers the best mix of information through various sources to obtain extensive and accurate analysis.
Each report takes an average time of a month and a team of 4 industry analysts. The time may vary depending on the scope and data availability of the desired market report. The various parameters used in the market assessment are standardized in order to enhance the data accuracy.
Data Mining
The data is collected from several authenticated, reliable, paid and unpaid sources and is filtered depending on the scope & objective of the research. Our reports repository acts as an added advantage in this procedure. Data gathering from the raw material suppliers, distributors and the manufacturers is performed on a regular basis, this helps in the comprehensive understanding of the products value chain. Apart from the above mentioned sources the data is also collected from the industry consultants to ensure the objective of the study is in the right direction.
Market trends such as technological advancements, regulatory affairs, market dynamics (Drivers, Restraints, Opportunities and Challenges) are obtained from scientific journals, market related national & international associations and organizations.
Data Analysis
From the data that is collected depending on the scope & objective of the research the data is subjected for the analysis. The critical steps that we follow for the data analysis include:
- Product Lifecycle Analysis
- Competitor analysis
- Risk analysis
- Porters Analysis
- PESTEL Analysis
- SWOT Analysis
The data engineering is performed by the core industry experts considering both the Marketing Mix Modeling and the Demand Forecasting. The marketing mix modeling makes use of multiple-regression techniques to predict the optimal mix of marketing variables. Regression factor is based on a number of variables and how they relate to an outcome such as sales or profits.
Data Validation
The data validation is performed by the exhaustive primary research from the expert interviews. This includes telephonic interviews, focus groups, face to face interviews, and questionnaires to validate our research from all aspects. The industry experts we approach come from the leading firms, involved in the supply chain ranging from the suppliers, distributors to the manufacturers and consumers so as to ensure an unbiased analysis.
We are in touch with more than 15,000 industry experts with the right mix of consultants, CEO's, presidents, vice presidents, managers, experts from both supply side and demand side, executives and so on.
The data validation involves the primary research from the industry experts belonging to:
- Leading Companies
- Suppliers & Distributors
- Manufacturers
- Consumers
- Industry/Strategic Consultants
Apart from the data validation the primary research also helps in performing the fill gap research, i.e. providing solutions for the unmet needs of the research which helps in enhancing the reports quality.
For more details about research methodology, kindly write to us at info@strategymrc.com
Frequently Asked Questions
In case of any queries regarding this report, you can contact the customer service by filing the “Inquiry Before Buy” form available on the right hand side. You may also contact us through email: info@strategymrc.com or phone: +1-301-202-5929
Yes, the samples are available for all the published reports. You can request them by filling the “Request Sample” option available in this page.
Yes, you can request a sample with your specific requirements. All the customized samples will be provided as per the requirement with the real data masked.
All our reports are available in Digital PDF format. In case if you require them in any other formats, such as PPT, Excel etc you can submit a request through “Inquiry Before Buy” form available on the right hand side. You may also contact us through email: info@strategymrc.com or phone: +1-301-202-5929
We offer a free 15% customization with every purchase. This requirement can be fulfilled for both pre and post sale. You may send your customization requirements through email at info@strategymrc.com or call us on +1-301-202-5929.
We have 3 different licensing options available in electronic format.
- Single User Licence: Allows one person, typically the buyer, to have access to the ordered product. The ordered product cannot be distributed to anyone else.
- 2-5 User Licence: Allows the ordered product to be shared among a maximum of 5 people within your organisation.
- Corporate License: Allows the product to be shared among all employees of your organisation regardless of their geographical location.
All our reports are typically be emailed to you as an attachment.
To order any available report you need to register on our website. The payment can be made either through CCAvenue or PayPal payments gateways which accept all international cards.
We extend our support to 6 months post sale. A post sale customization is also provided to cover your unmet needs in the report.
Request Customization
We offer complimentary customization of up to 15% with every purchase. To share your customization requirements, feel free to email us at info@strategymrc.com or call us on +1-301-202-5929. .
Please Note: Customization within the 15% threshold is entirely free of charge. If your request exceeds this limit, we will conduct a feasibility assessment. Following that, a detailed quote and timeline will be provided.
WHY CHOOSE US ?

Assured Quality
Best in class reports with high standard of research integrity

24X7 Research Support
Continuous support to ensure the best customer experience.

Free Customization
Adding more values to your product of interest.

Safe & Secure Access
Providing a secured environment for all online transactions.

Trusted by 600+ Brands
Serving the most reputed brands across the world.