
B2b Payments Market
B2B Payments Market Forecasts to 2032 - Global Analysis By Payment Type (Domestic Payments and Cross-Border Payments), Payment Mode, Payment Method, Enterprise Size, End User and By Geography

|
Years Covered |
2024-2032 |
|
Estimated Year Value (2025) |
US $1,989.7 BN |
|
Projected Year Value (2032) |
US $4,236.2 BN |
|
CAGR (2025-2032) |
11.4% |
|
Regions Covered |
North America, Europe, Asia Pacific, South America, and Middle East & Africa |
|
Countries Covered |
US, Canada, Mexico, Germany, UK, Italy, France, Spain, Japan, China, India, Australia, New Zealand, South Korea, Rest of Asia Pacific, South America, Argentina, Brazil, Chile, Middle East & Africa, Saudi Arabia, UAE, Qatar, and South Africa |
|
Largest Market |
Asia Pacific |
|
Highest Growing Market |
North America |
According to Stratistics MRC, the Global B2B Payments Market is accounted for $1,989.7 billion in 2025 and is expected to reach $4,236.2 billion by 2032 growing at a CAGR of 11.4% during the forecast period. B2B payments refer to financial transactions conducted between businesses rather than between a business and individual consumers. These payments typically involve larger sums, more complex processes, and longer payment cycles compared to consumer payments. B2B payments can include invoices for goods or services, supplier payments, payroll, and other intercompany transfers. They often require secure, reliable, and efficient methods to manage cash flow and maintain strong business relationships.
According to Bottomline 2022, B2B Payments Survey Report, 49% of businesses experienced a serious fraud attempt in 2021, which has a huge impact on the market growth.
Market Dynamics:
Driver:
Digital Transformation & Automation
Digital transformation and automation are revolutionizing the B2B payments market by enhancing speed, accuracy, and security. Automated processes reduce manual errors and operational costs while accelerating transaction times, fostering seamless cash flow management. Digital tools enable real-time payment tracking and improved transparency, strengthening trust between businesses. Additionally, advanced analytics provide actionable insights for smarter financial decisions. Overall, these innovations boost efficiency, reduce fraud risk, and create a customer-centric payment ecosystem, driving growth in the B2B landscape.
Restraint:
High Integration Costs
High integration costs in the B2B payments market create significant barriers for businesses, especially small and medium enterprises. These expenses delay adoption of advanced payment systems, limiting efficiency and innovation. High costs also reduce competitiveness by discouraging seamless connectivity between platforms, causing operational bottlenecks. Ultimately, this slows market growth, restricts access to modern financial technologies, and hampers overall digital transformation within the B2B payments ecosystem.
Opportunity:
Rising Demand for Faster Payments
The rising demand for faster payments is transforming the B2B payments market by accelerating transaction speeds and improving cash flow management for businesses. This shift enhances operational efficiency, reduces payment delays, and strengthens supplier relationships. Real-time payments foster greater transparency and security, boosting trust among trading partners. Additionally, faster payment solutions encourage digital adoption, driving innovation and competitiveness in the B2B ecosystem.
Threat:
Complexity of Legacy Systems
The complexity of legacy systems poses significant challenges to the B2B payments market by slowing down modernization efforts. These outdated systems are often inflexible, costly to maintain, and incompatible with new digital payment technologies, leading to integration issues and increased operational risks. As a result, businesses face delays, higher expenses, and limited scalability, hindering the adoption of efficient, automated payment solutions and overall market growth.
Covid-19 Impact
The Covid-19 pandemic significantly accelerated digital transformation in the B2B payments market. With remote work and social distancing, businesses shifted from traditional paper-based and check payments to faster, contactless digital payment solutions. This shift increased demand for automation, enhanced security, and real-time payment processing. Overall, Covid-19 acted as a catalyst, driving innovation and adoption of advanced technologies in the B2B payments ecosystem globally.
The digital segment is expected to be the largest during the forecast period
The digital segment is expected to account for the largest market share during the forecast period because it streamlines transactions through automation and real-time processing, reducing errors and operational costs. Digital platforms facilitate seamless cross-border payments, improving global trade efficiency. Advanced analytics offer better cash flow management and fraud detection. Overall, digitalization drives greater convenience and trust among businesses, accelerating payment cycles and fostering stronger B2B relationships, ultimately boosting market growth and competitiveness.
The credit card segment is expected to have the highest CAGR during the forecast period
Over the forecast period, the credit card segment is predicted to witness the highest growth rate, as it enables businesses to streamline payments, improve cash flow management, and access credit facilities, fostering smoother supplier relationships. Digitalization and reward programs further incentivize usage, boosting adoption. Additionally, credit cards support better expense tracking and reconciliation, reducing administrative burden. Moreover, they contribute to increased efficiency, transparency, and financial flexibility in B2B payment ecosystems, accelerating market growth.
Region with largest share:
During the forecast period, the Asia Pacific region is expected to hold the largest market share as Digital payment solutions promote transparency, security, and cost savings, fostering stronger business relationships. Increased adoption of fintech innovations accelerates cross-border trade and financial inclusion for SMEs. This market growth supports regional integration, boosts cash flow management, and encourages investments, ultimately empowering businesses to scale rapidly and contributing to the digital transformation of Asia Pacific’s commercial landscape.
Region with highest CAGR:
Over the forecast period, the North America region is anticipated to exhibit the highest CAGR, because Advanced digital payment solutions and automation are accelerating cash flow, improving financial transparency, and minimizing errors. This fosters stronger supplier relationships and boosts overall business productivity. Additionally, the market’s innovation promotes secure, faster cross-border payments, fueling regional trade growth. These advancements support economic expansion and strengthen North America’s position as a leader in global B2B commerce.

Key players in the market
Some of the key players profiled in the B2B Payments Market include Stripe, PayPal, Adyen, Fiserv, Mastercard, Visa, American Express, JPMorgan Chase, Citi, SAP Concur, Bill.com, Coupa, AvidXchange, Airwallex, Veem, Tradeshift, Bottomline Technologies and Flywire.
Key Developments:
In May 2025, Visa and EgyptAir have entered into an exclusive multi-year agreement focused on co-branded payment products, targeting Egypt’s aviation and travel sectors. This partnership introduced the ""Mileseverywhere"" credit card, developed in collaboration with MasterCard and Commercial International Bank (CIB).
In December 2024, Card.com Corporation, has announced a collaboration with Visa to introduce Visa Direct Cross-Border payments. This partnership aims to provide Card.com customers with fast, secure, and convenient international payment options.
Payment Types Covered:
• Domestic Payments
• Cross-Border Payments
Payment Modes Covered:
• Traditional
• Digital
Payment Methods Covered:
• ACH
• Wire
• Cheque
• Cash
• Demand Draft
• Credit Card
Enterprise Sizes Covered:
• Large Enterprise
• Medium-sized Enterprise
• Small-sized Enterprise
End Users Covered:
• Manufacturing
• IT and Telecom
• Metals and Mining
• Energy and Utilities
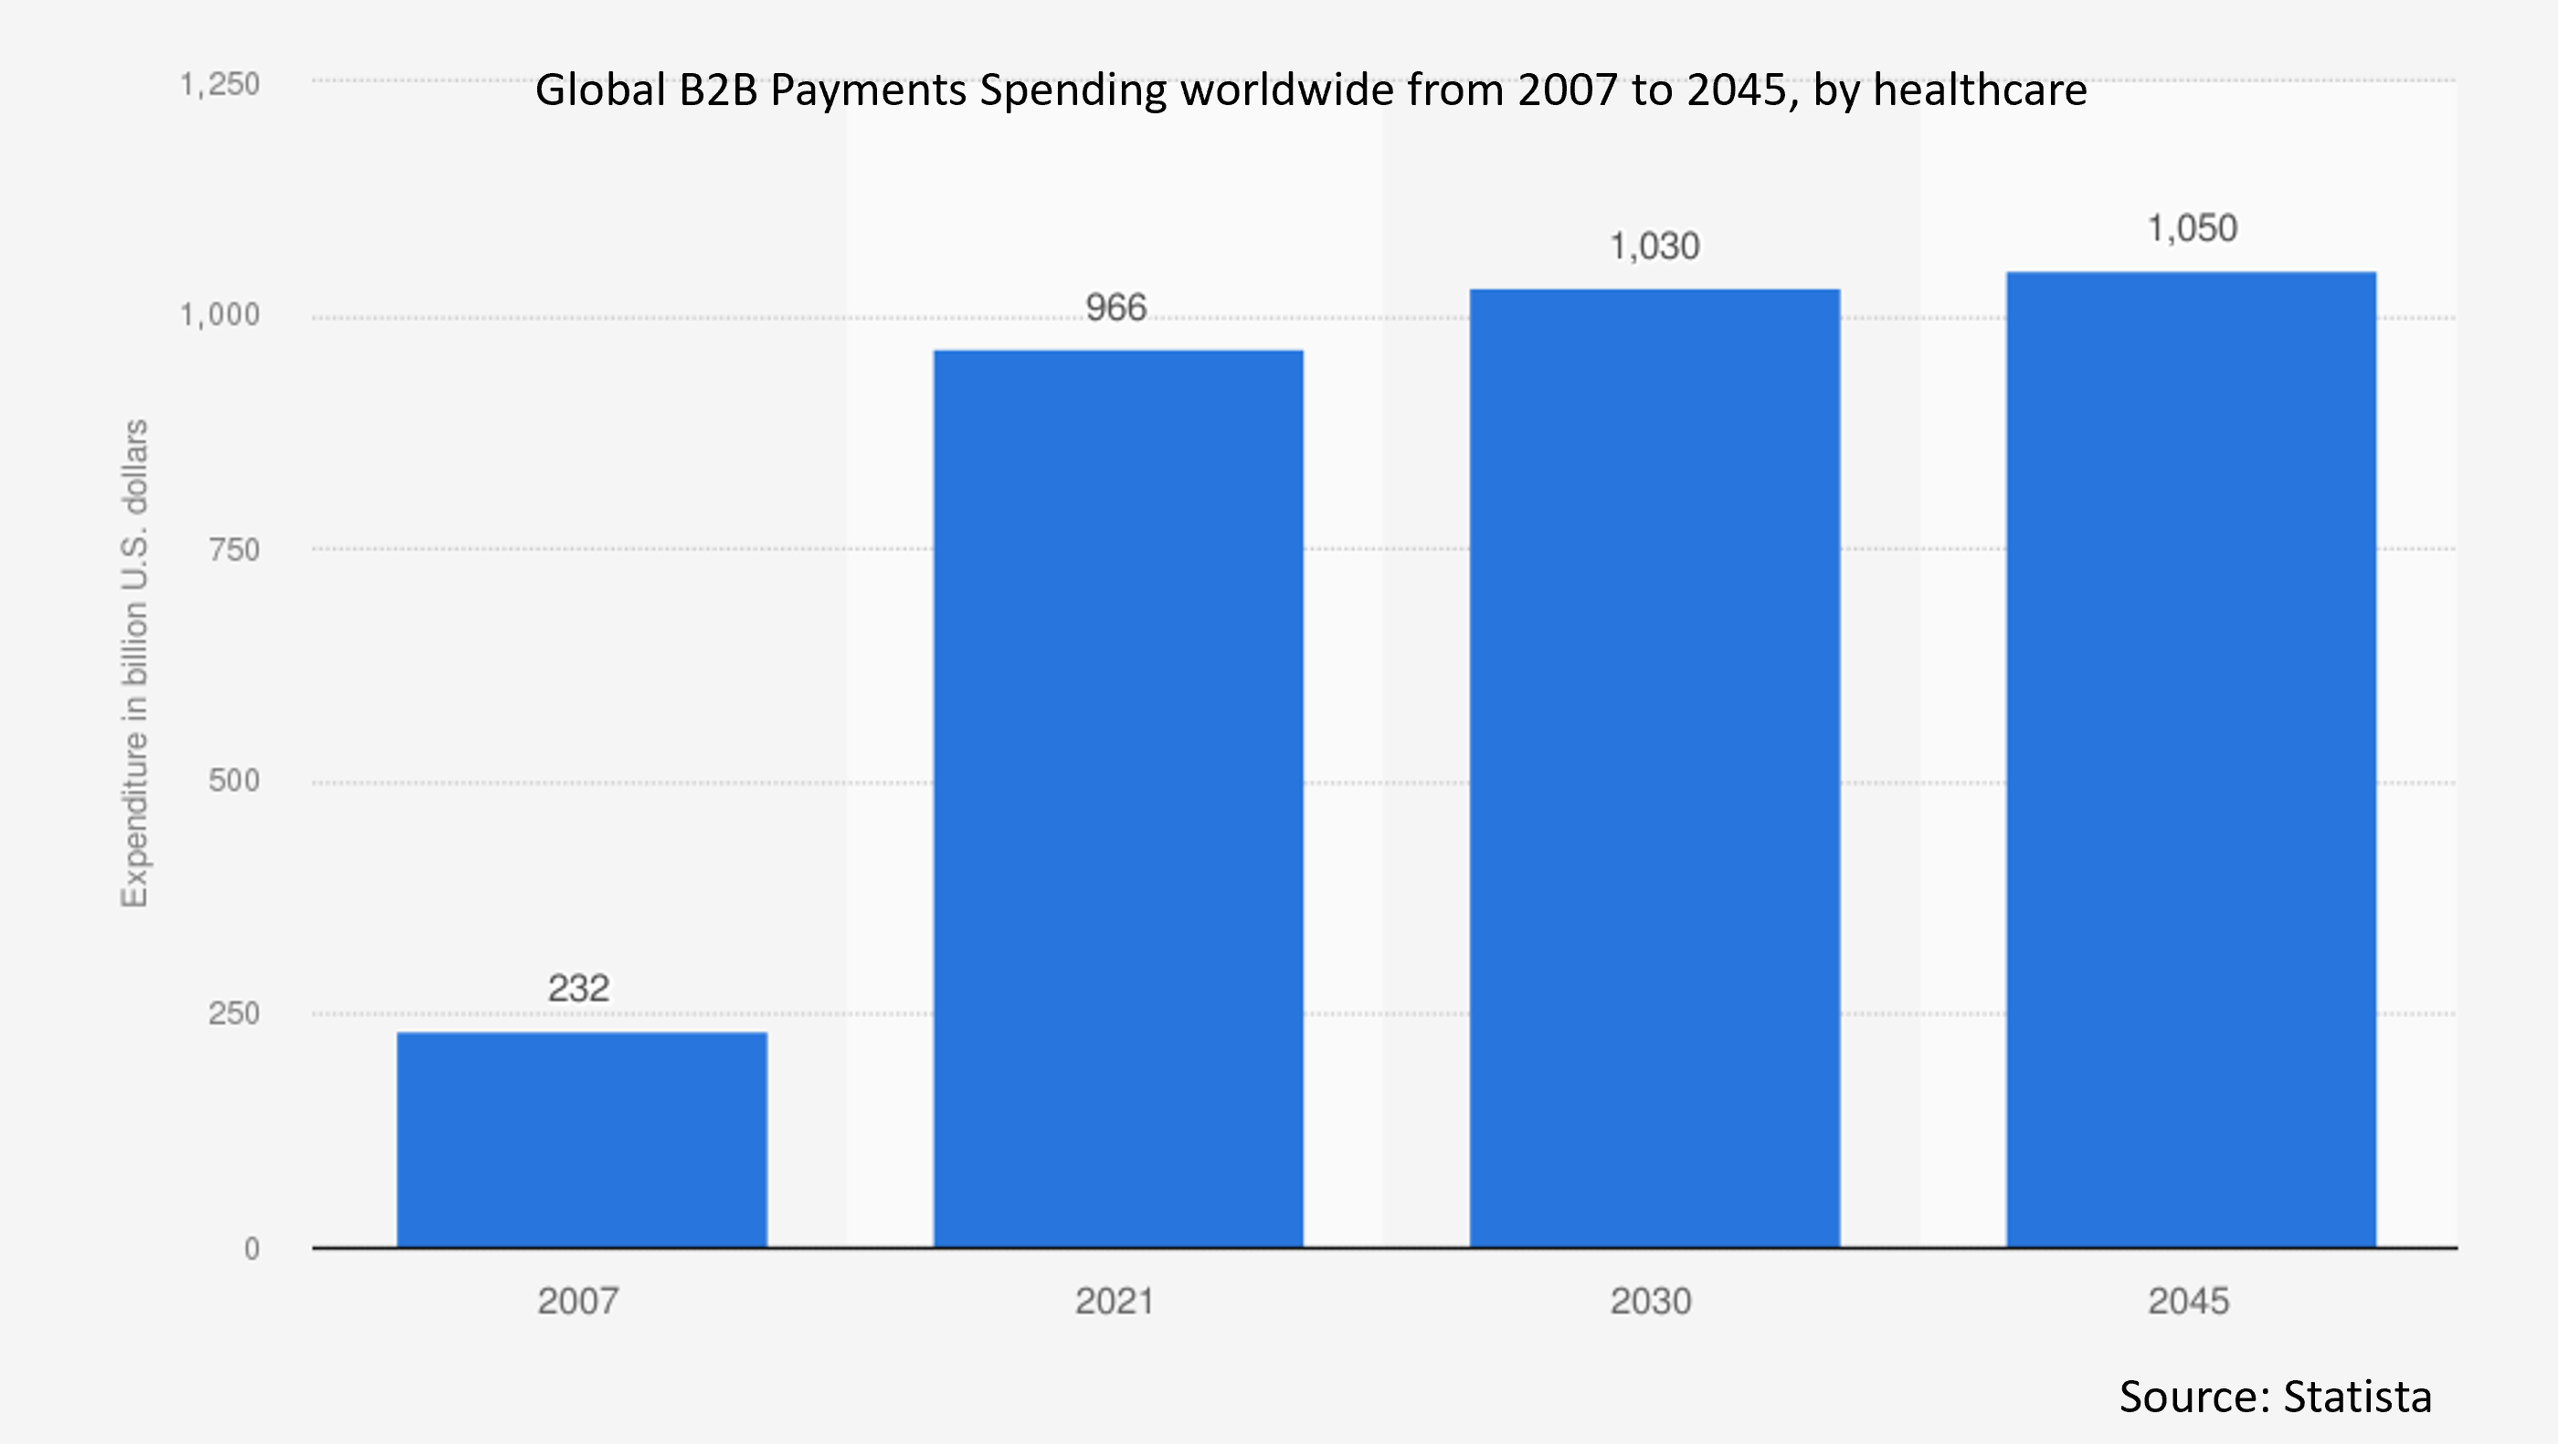
• Healthcare
• Retail & E-Commerce
• Transportation & Logistics
• BFSI (Banking, Financial Services, and Insurance)
• Other End Users
Regions Covered:
• North America
o US
o Canada
o Mexico
• Europe
o Germany
o UK
o Italy
o France
o Spain
o Rest of Europe
• Asia Pacific
o Japan
o China
o India
o Australia
o New Zealand
o South Korea
o Rest of Asia Pacific
• South America
o Argentina
o Brazil
o Chile
o Rest of South America
• Middle East & Africa
o Saudi Arabia
o UAE
o Qatar
o South Africa
o Rest of Middle East & Africa
What our report offers:
- Market share assessments for the regional and country-level segments
- Strategic recommendations for the new entrants
- Covers Market data for the years 2022, 2023, 2024, 2026, and 2030
- Market Trends (Drivers, Constraints, Opportunities, Threats, Challenges, Investment Opportunities, and recommendations)
- Strategic recommendations in key business segments based on the market estimations
- Competitive landscaping mapping the key common trends
- Company profiling with detailed strategies, financials, and recent developments
- Supply chain trends mapping the latest technological advancements
Free Customization Offerings:
All the customers of this report will be entitled to receive one of the following free customization options:
• Company Profiling
o Comprehensive profiling of additional market players (up to 3)
o SWOT Analysis of key players (up to 3)
• Regional Segmentation
o Market estimations, Forecasts and CAGR of any prominent country as per the client's interest (Note: Depends on feasibility check)
• Competitive Benchmarking
o Benchmarking of key players based on product portfolio, geographical presence, and strategic alliances
Table of Contents
1 Executive Summary
2 Preface
2.1 Abstract
2.2 Stake Holders
2.3 Research Scope
2.4 Research Methodology
2.4.1 Data Mining
2.4.2 Data Analysis
2.4.3 Data Validation
2.4.4 Research Approach
2.5 Research Sources
2.5.1 Primary Research Sources
2.5.2 Secondary Research Sources
2.5.3 Assumptions
3 Market Trend Analysis
3.1 Introduction
3.2 Drivers
3.3 Restraints
3.4 Opportunities
3.5 Threats
3.6 End User Analysis
3.7 Emerging Markets
3.8 Impact of Covid-19
4 Porters Five Force Analysis
4.1 Bargaining power of suppliers
4.2 Bargaining power of buyers
4.3 Threat of substitutes
4.4 Threat of new entrants
4.5 Competitive rivalry
5 Global B2B Payments Market, By Payment Type
5.1 Introduction
5.2 Domestic Payments
5.3 Cross-Border Payments
6 Global B2B Payments Market, By Payment Mode
6.1 Introduction
6.2 Traditional
6.3 Digital
7 Global B2B Payments Market, By Payment Method
7.1 Introduction
7.2 ACH
7.3 Wire
7.4 Cheque
7.5 Cash
7.6 Demand Draft
7.7 Credit Card
8 Global B2B Payments Market, By Enterprise Size
8.1 Introduction
8.2 Large Enterprise
8.3 Medium-sized Enterprise
8.4 Small-sized Enterprise
9 Global B2B Payments Market, By End User
9.1 Introduction
9.2 Manufacturing
9.3 IT and Telecom
9.4 Metals and Mining
9.5 Energy and Utilities
9.6 Healthcare
9.7 Retail & E-commerce
9.9 Transportation & Logistics
9.9 BFSI (Banking, Financial Services, and Insurance)
9.10 Other End Users
10 Global B2B Payments Market, By Geography
10.1 Introduction
10.2 North America
10.2.1 US
10.2.2 Canada
10.2.3 Mexico
10.3 Europe
10.3.1 Germany
10.3.2 UK
10.3.3 Italy
10.3.4 France
10.3.5 Spain
10.3.6 Rest of Europe
10.4 Asia Pacific
10.4.1 Japan
10.4.2 China
10.4.3 India
10.4.4 Australia
10.4.5 New Zealand
10.4.6 South Korea
10.4.7 Rest of Asia Pacific
10.5 South America
10.5.1 Argentina
10.5.2 Brazil
10.5.3 Chile
10.5.4 Rest of South America
10.6 Middle East & Africa
10.6.1 Saudi Arabia
10.6.2 UAE
10.6.3 Qatar
10.6.4 South Africa
10.6.5 Rest of Middle East & Africa
11 Key Developments
11.1 Agreements, Partnerships, Collaborations and Joint Ventures
11.2 Acquisitions & Mergers
11.3 New Product Launch
11.4 Expansions
11.5 Other Key Strategies
12 Company Profiling
12.1 Stripe
12.2 PayPal
12.3 Adyen
12.4 Fiserv
12.5 Mastercard
12.6 Visa
12.7 American Express
12.8 JPMorgan Chase
12.9 Citi
12.10 SAP Concur
12.11 Bill.com
12.12 Coupa
12.13 AvidXchange
12.14 Airwallex
12.15 Veem
12.16 Tradeshift
12.17 Bottomline Technologies
12.18 Flywire
List of Tables
1 Global B2B Payments Market Outlook, By Region (2024-2032) ($MN)
2 Global B2B Payments Market Outlook, By Payment Type (2024-2032) ($MN)
3 Global B2B Payments Market Outlook, By Domestic Payments (2024-2032) ($MN)
4 Global B2B Payments Market Outlook, By Cross-Border Payments (2024-2032) ($MN)
5 Global B2B Payments Market Outlook, By Payment Mode (2024-2032) ($MN)
6 Global B2B Payments Market Outlook, By Traditional (2024-2032) ($MN)
7 Global B2B Payments Market Outlook, By Digital (2024-2032) ($MN)
8 Global B2B Payments Market Outlook, By Payment Method (2024-2032) ($MN)
9 Global B2B Payments Market Outlook, By ACH (2024-2032) ($MN)
10 Global B2B Payments Market Outlook, By Wire (2024-2032) ($MN)
11 Global B2B Payments Market Outlook, By Cheque (2024-2032) ($MN)
12 Global B2B Payments Market Outlook, By Cash (2024-2032) ($MN)
13 Global B2B Payments Market Outlook, By Demand Draft (2024-2032) ($MN)
14 Global B2B Payments Market Outlook, By Credit Card (2024-2032) ($MN)
15 Global B2B Payments Market Outlook, By Enterprise Size (2024-2032) ($MN)
16 Global B2B Payments Market Outlook, By Large Enterprise (2024-2032) ($MN)
17 Global B2B Payments Market Outlook, By Medium-sized Enterprise (2024-2032) ($MN)
18 Global B2B Payments Market Outlook, By Small-sized Enterprise (2024-2032) ($MN)
19 Global B2B Payments Market Outlook, By End User (2024-2032) ($MN)
20 Global B2B Payments Market Outlook, By Manufacturing (2024-2032) ($MN)
21 Global B2B Payments Market Outlook, By IT and Telecom (2024-2032) ($MN)
22 Global B2B Payments Market Outlook, By Metals and Mining (2024-2032) ($MN)
23 Global B2B Payments Market Outlook, By Energy and Utilities (2024-2032) ($MN)
24 Global B2B Payments Market Outlook, By Healthcare (2024-2032) ($MN)
25 Global B2B Payments Market Outlook, By Retail & E-commerce (2024-2032) ($MN)
26 Global B2B Payments Market Outlook, By Transportation & Logistics (2024-2032) ($MN)
27 Global B2B Payments Market Outlook, By BFSI (Banking, Financial Services, and Insurance) (2024-2032) ($MN)
28 Global B2B Payments Market Outlook, By Other End Users (2024-2032) ($MN)
Note: Tables for North America, Europe, APAC, South America, and Middle East & Africa Regions are also represented in the same manner as above.
List of Figures
RESEARCH METHODOLOGY

We at ‘Stratistics’ opt for an extensive research approach which involves data mining, data validation, and data analysis. The various research sources include in-house repository, secondary research, competitor’s sources, social media research, client internal data, and primary research.
Our team of analysts prefers the most reliable and authenticated data sources in order to perform the comprehensive literature search. With access to most of the authenticated data bases our team highly considers the best mix of information through various sources to obtain extensive and accurate analysis.
Each report takes an average time of a month and a team of 4 industry analysts. The time may vary depending on the scope and data availability of the desired market report. The various parameters used in the market assessment are standardized in order to enhance the data accuracy.
Data Mining
The data is collected from several authenticated, reliable, paid and unpaid sources and is filtered depending on the scope & objective of the research. Our reports repository acts as an added advantage in this procedure. Data gathering from the raw material suppliers, distributors and the manufacturers is performed on a regular basis, this helps in the comprehensive understanding of the products value chain. Apart from the above mentioned sources the data is also collected from the industry consultants to ensure the objective of the study is in the right direction.
Market trends such as technological advancements, regulatory affairs, market dynamics (Drivers, Restraints, Opportunities and Challenges) are obtained from scientific journals, market related national & international associations and organizations.
Data Analysis
From the data that is collected depending on the scope & objective of the research the data is subjected for the analysis. The critical steps that we follow for the data analysis include:
- Product Lifecycle Analysis
- Competitor analysis
- Risk analysis
- Porters Analysis
- PESTEL Analysis
- SWOT Analysis
The data engineering is performed by the core industry experts considering both the Marketing Mix Modeling and the Demand Forecasting. The marketing mix modeling makes use of multiple-regression techniques to predict the optimal mix of marketing variables. Regression factor is based on a number of variables and how they relate to an outcome such as sales or profits.
Data Validation
The data validation is performed by the exhaustive primary research from the expert interviews. This includes telephonic interviews, focus groups, face to face interviews, and questionnaires to validate our research from all aspects. The industry experts we approach come from the leading firms, involved in the supply chain ranging from the suppliers, distributors to the manufacturers and consumers so as to ensure an unbiased analysis.
We are in touch with more than 15,000 industry experts with the right mix of consultants, CEO's, presidents, vice presidents, managers, experts from both supply side and demand side, executives and so on.
The data validation involves the primary research from the industry experts belonging to:
- Leading Companies
- Suppliers & Distributors
- Manufacturers
- Consumers
- Industry/Strategic Consultants
Apart from the data validation the primary research also helps in performing the fill gap research, i.e. providing solutions for the unmet needs of the research which helps in enhancing the reports quality.
For more details about research methodology, kindly write to us at info@strategymrc.com
Frequently Asked Questions
In case of any queries regarding this report, you can contact the customer service by filing the “Inquiry Before Buy” form available on the right hand side. You may also contact us through email: info@strategymrc.com or phone: +1-301-202-5929
Yes, the samples are available for all the published reports. You can request them by filling the “Request Sample” option available in this page.
Yes, you can request a sample with your specific requirements. All the customized samples will be provided as per the requirement with the real data masked.
All our reports are available in Digital PDF format. In case if you require them in any other formats, such as PPT, Excel etc you can submit a request through “Inquiry Before Buy” form available on the right hand side. You may also contact us through email: info@strategymrc.com or phone: +1-301-202-5929
We offer a free 15% customization with every purchase. This requirement can be fulfilled for both pre and post sale. You may send your customization requirements through email at info@strategymrc.com or call us on +1-301-202-5929.
We have 3 different licensing options available in electronic format.
- Single User Licence: Allows one person, typically the buyer, to have access to the ordered product. The ordered product cannot be distributed to anyone else.
- 2-5 User Licence: Allows the ordered product to be shared among a maximum of 5 people within your organisation.
- Corporate License: Allows the product to be shared among all employees of your organisation regardless of their geographical location.
All our reports are typically be emailed to you as an attachment.
To order any available report you need to register on our website. The payment can be made either through CCAvenue or PayPal payments gateways which accept all international cards.
We extend our support to 6 months post sale. A post sale customization is also provided to cover your unmet needs in the report.
Request Customization
We offer complimentary customization of up to 15% with every purchase. To share your customization requirements, feel free to email us at info@strategymrc.com or call us on +1-301-202-5929. .
Please Note: Customization within the 15% threshold is entirely free of charge. If your request exceeds this limit, we will conduct a feasibility assessment. Following that, a detailed quote and timeline will be provided.
WHY CHOOSE US ?

Assured Quality
Best in class reports with high standard of research integrity

24X7 Research Support
Continuous support to ensure the best customer experience.

Free Customization
Adding more values to your product of interest.

Safe & Secure Access
Providing a secured environment for all online transactions.

Trusted by 600+ Brands
Serving the most reputed brands across the world.