
Behaviour Analytics Market
Behaviour Analytics Market Forecasts to 2030 - Global Analysis By Analytics Type (Predictive Analytics, Prescriptive Analytics, Descriptive Analytics and Other Analytics Types), Component, Deployment Mode, Organization Size, Application, End User and By Geography

|
Years Covered |
2022-2030 |
|
Estimated Year Value (2024) |
US $5.82 BN |
|
Projected Year Value (2030) |
US $14.57 BN |
|
CAGR (2024 - 2030) |
20.5% |
|
Regions Covered |
North America, Europe, Asia Pacific, South America, and Middle East & Africa |
|
Countries Covered |
US, Canada, Mexico, Germany, UK, Italy, France, Spain, Japan, China, India, Australia, New Zealand, South Korea, Rest of Asia Pacific, South America, Argentina, Brazil, Chile, Middle East & Africa, Saudi Arabia, UAE, Qatar, and South Africa |
|
Largest Market |
Asia Pacific |
|
Highest Growing Market |
North America |
According to Stratistics MRC, the Global Behaviour Analytics Market is accounted for $5.82 billion in 2024 and is expected to reach $14.57 billion by 2030 growing at a CAGR of 20.5% during the forecast period. Behaviour Analytics refers to the systematic collection, processing, and analysis of behavioural data from diverse sources across the globe to understand patterns, predict trends, and enhance decision-making. It integrates data from online activities, social media, IoT devices, transactions, and other interactions to identify actionable insights. Advanced tools like artificial intelligence, machine learning, and big data analytics enable precise interpretation, helping organizations improve operations, tailor services, and anticipate user or market behaviour effectively on a global scale.
According to the Cost of Insider Threat Report 2020, cybercrime costs are expected to increase by 15% year-on-year in the next four years.
Market Dynamics:
Driver:
Rising incidents of cyber attacks
As cyber threats become more sophisticated, traditional security measures often fail to detect complex and evolving attacks. Behaviour analytics helps organizations identify abnormal activities by monitoring patterns and detecting anomalies in real time. This proactive approach enables early detection of potential security breaches, insider threats, and fraud. As businesses prioritize cybersecurity and data protection, the adoption of behaviour analytics solutions has grown, making them essential tools for safeguarding sensitive information and maintaining operational integrity, thereby accelerating market demand.
Restraint:
Integration complexities
Integration complexities in behaviour analytics arise due to the need to incorporate advanced analytics tools with existing IT infrastructures, legacy systems, and diverse data sources. Organizations often face challenges in aligning behaviour analytics with current platforms, such as CRM or ERP systems. These integration issues can lead to delays in deployment, increased operational costs, and inefficiencies, ultimately hampering the market growth.
Opportunity:
Expanding IoT ecosystems
Devices such as smart appliances, wearables and industrial sensors, collect and transmit behavioural data, prompting organizations to require advanced analytics tools to process and derive actionable insights. Behaviour analytics helps identify patterns, predict trends, and detect anomalies across various sectors. The increased volume and diversity of IoT data necessitate sophisticated solutions to enhance decision-making, improve operational efficiency, and boost security, driving the adoption and expansion of behaviour analytics in multiple industries.
Threat:
Data privacy concerns
Data privacy concerns in behaviour analytics arise due to the extensive collection of personal and sensitive data, such as user behaviour, transaction details, and interactions. This raises risks of data breaches, misuse, and unauthorized access, especially with stricter data protection regulations like GDPR. Additionally, potential legal repercussions and loss of consumer trust can hamper market growth by limiting the willingness of organizations to fully embrace these technologies for analytics purposes.
Covid-19 Impact
The covid-19 pandemic accelerated the growth of the behaviour analytics market as businesses adapted to remote work and digital transformation. Increased reliance on online platforms, e-commerce, and digital services created a surge in behavioural data, prompting the need for advanced analytics to understand customer behaviour, detect fraud, and enhance security. Additionally, the pandemic underscored the importance of real-time data analysis, driving demand for behaviour analytics tools to monitor and respond to rapidly changing market dynamics.
The large enterprises segment is expected to be the largest during the forecast period
The large enterprises segment is predicted to secure the largest market share throughout the forecast period. Behaviour analytics in large enterprises helps organizations monitor, analyze, and optimize customer and employee behaviour to enhance decision-making, security, and performance. It is widely used for detecting insider threats, fraud prevention, improving customer experience, and personalizing marketing strategies. By leveraging advanced AI and big data, large enterprises can identify trends, anomalies, and insights to drive operational efficiency.
The risk management segment is expected to have the highest CAGR during the forecast period
The risk management segment is anticipated to witness the highest CAGR during the forecast period. Behaviour analytics in risk management helps organizations identify, assess, and mitigate potential risks by analyzing behavioural patterns and anomalies in data. It is crucial for detecting fraud, insider threats, and cybersecurity breaches, enabling proactive risk mitigation. By leveraging AI and machine learning, behaviour analytics allows businesses to monitor real-time activities and predict risks, ensuring quick responses to emerging threats.
Region with largest share:
Asia Pacific is expected to register the largest market share during the forecast period due to increasing digitalization, rising cybersecurity threats, and growing adoption of advanced technologies like AI and big data. Countries like China, India, and Japan are driving market expansion with their large consumer bases and increasing e-commerce activities. Additionally, the surge in IoT device usage and the need for real-time data insights are boosting demand for behaviour analytics solutions.
Region with highest CAGR:
North America is expected to witness the highest CAGR over the forecast period driven by the region's advanced technological infrastructure, high adoption of AI and big data analytics, and increasing cybersecurity threats. The United States and Canada lead the market, with businesses focusing on improving customer experience, fraud detection, and real-time decision-making. The rise of remote work, e-commerce, and IoT devices further fuels demand for behaviour analytics solutions.

Key players in the market
Some of the key players profiled in the Behaviour Analytics Market include IBM Corporation, Splunk Inc., Google LLC, Microsoft Corporation, Oracle Corporation, SAP SE, Adobe Systems Incorporated, Teradata Corporation, SAS Institute Inc., Mixpanel, Inc., Hewlett Packard Enterprise, Salesforce.com, Inc., RapidMiner Inc., Tableau Software LLC, New Relic Inc. and Awareness Technologies.
Key Developments:
In August 2024, Hewlett Packard Enterprise has expanded its AI-powered networking portfolio by introducing behavioural analytics-based network detection and response (NDR) capabilities through its HPE Aruba Networking division. This division includes next-gen AI-powered Network Detection and Response and Campus-Based Zero Trust Network Access solutions.
In January 2023, Awareness Technologies introduced Veriato’s workforce behaviour analytics software to the Indian market through a strategic partnership with Sectonics. This software is designed to provide comprehensive insights into employee behaviour, enabling organizations to monitor productivity, enhance workplace security, and ensure compliance with regulatory standards.
Analytics Types Covered:
• Predictive Analytics
• Prescriptive Analytics
• Descriptive Analytics
• Other Analytics Types
Components Covered:
• Software
• Services
Deployment Modes Covered:
• Cloud-based
• On-premise
Organization Sizes Covered:
• Small & Medium-sized Enterprises (SMEs)
• Large Enterprises
Applications Covered:
• Security & Fraud Detection
• Threat Management
• User Experience Management
• Risk Management
• Compliance Management
• Insider Threat Detection
• Other Applications
End Users Covered:
• Banking, Financial Services, and Insurance (BFSI)
• Healthcare
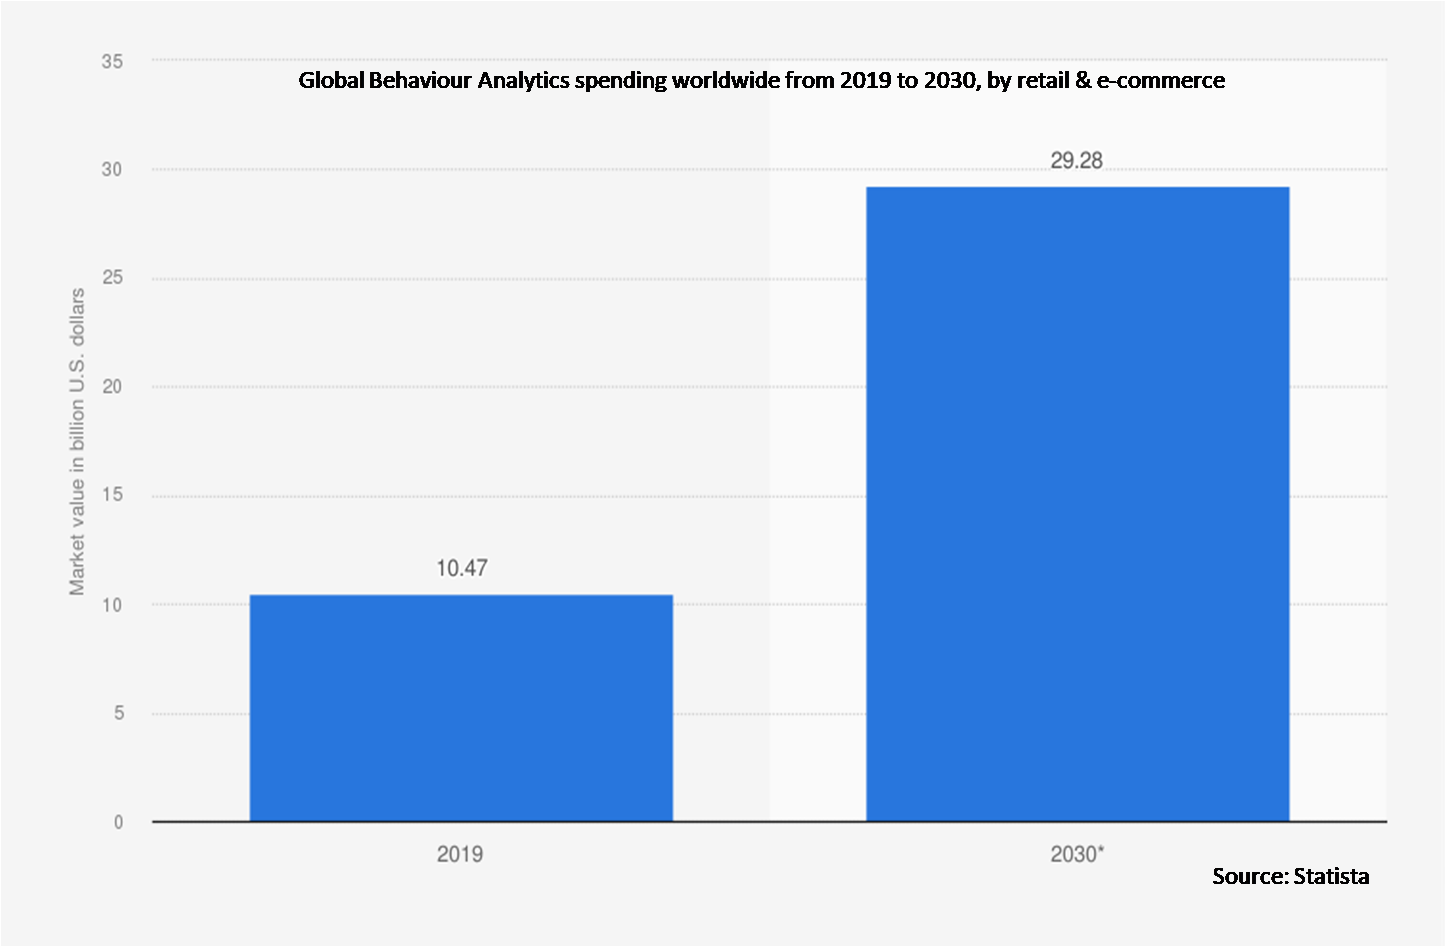
• Retail & E-commerce
• Government & Defense
• Transportation & Logistics
• Education
• Other End Users
Regions Covered:
• North America
o US
o Canada
o Mexico
• Europe
o Germany
o UK
o Italy
o France
o Spain
o Rest of Europe
• Asia Pacific
o Japan
o China
o India
o Australia
o New Zealand
o South Korea
o Rest of Asia Pacific
• South America
o Argentina
o Brazil
o Chile
o Rest of South America
• Middle East & Africa
o Saudi Arabia
o UAE
o Qatar
o South Africa
o Rest of Middle East & Africa
What our report offers:
- Market share assessments for the regional and country-level segments
- Strategic recommendations for the new entrants
- Covers Market data for the years 2022, 2023, 2024, 2026, and 2030
- Market Trends (Drivers, Constraints, Opportunities, Threats, Challenges, Investment Opportunities, and recommendations)
- Strategic recommendations in key business segments based on the market estimations
- Competitive landscaping mapping the key common trends
- Company profiling with detailed strategies, financials, and recent developments
- Supply chain trends mapping the latest technological advancements
Free Customization Offerings:
All the customers of this report will be entitled to receive one of the following free customization options:
• Company Profiling
o Comprehensive profiling of additional market players (up to 3)
o SWOT Analysis of key players (up to 3)
• Regional Segmentation
o Market estimations, Forecasts and CAGR of any prominent country as per the client's interest (Note: Depends on feasibility check)
• Competitive Benchmarking
o Benchmarking of key players based on product portfolio, geographical presence, and strategic alliances
Table of Contents
1 Executive Summary
2 Preface
2.1 Abstract
2.2 Stake Holders
2.3 Research Scope
2.4 Research Methodology
2.4.1 Data Mining
2.4.2 Data Analysis
2.4.3 Data Validation
2.4.4 Research Approach
2.5 Research Sources
2.5.1 Primary Research Sources
2.5.2 Secondary Research Sources
2.5.3 Assumptions
3 Market Trend Analysis
3.1 Introduction
3.2 Drivers
3.3 Restraints
3.4 Opportunities
3.5 Threats
3.6 Application Analysis
3.7 End User Analysis
3.8 Emerging Markets
3.9 Impact of Covid-19
4 Porters Five Force Analysis
4.1 Bargaining power of suppliers
4.2 Bargaining power of buyers
4.3 Threat of substitutes
4.4 Threat of new entrants
4.5 Competitive rivalry
5 Global Behaviour Analytics Market, By Analytics Type
5.1 Introduction
5.2 Predictive Analytics
5.3 Prescriptive Analytics
5.4 Descriptive Analytics
5.5 Other Analytics Types
6 Global Behaviour Analytics Market, By Component
6.1 Introduction
6.2 Software
6.2.1 Standalone Behavior Analytics Software
6.2.2 Integrated Behavior Analytics Software
6.2.3 Analytics & Reporting Tools
6.2.4 Data Visualization Tools
6.3 Services
6.3.1 Professional Services
6.3.2 Managed Services
6.3.3 Consulting Services
6.3.4 System Integration & Deployment
7 Global Behaviour Analytics Market, By Deployment Mode
7.1 Introduction
7.2 Cloud-based
7.3 On-premise
8 Global Behaviour Analytics Market, By Organization Size
8.1 Introduction
8.2 Small & Medium-sized Enterprises (SMEs)
8.3 Large Enterprises
9 Global Behaviour Analytics Market, By Application
9.1 Introduction
9.2 Security & Fraud Detection
9.3 Threat Management
9.4 User Experience Management
9.5 Risk Management
9.6 Compliance Management
9.7 Insider Threat Detection
9.8 Other Applications
10 Global Behaviour Analytics Market, By End User
10.1 Introduction
10.2 Banking, Financial Services, and Insurance (BFSI)
10.3 Healthcare
10.4 Retail & E-commerce
10.5 Government & Defense
10.6 Transportation & Logistics
10.7 Education
10.8 Other End Users
11 Global Behaviour Analytics Market, By Geography
11.1 Introduction
11.2 North America
11.2.1 US
11.2.2 Canada
11.2.3 Mexico
11.3 Europe
11.3.1 Germany
11.3.2 UK
11.3.3 Italy
11.3.4 France
11.3.5 Spain
11.3.6 Rest of Europe
11.4 Asia Pacific
11.4.1 Japan
11.4.2 China
11.4.3 India
11.4.4 Australia
11.4.5 New Zealand
11.4.6 South Korea
11.4.7 Rest of Asia Pacific
11.5 South America
11.5.1 Argentina
11.5.2 Brazil
11.5.3 Chile
11.5.4 Rest of South America
11.6 Middle East & Africa
11.6.1 Saudi Arabia
11.6.2 UAE
11.6.3 Qatar
11.6.4 South Africa
11.6.5 Rest of Middle East & Africa
12 Key Developments
12.1 Agreements, Partnerships, Collaborations and Joint Ventures
12.2 Acquisitions & Mergers
12.3 New Product Launch
12.4 Expansions
12.5 Other Key Strategies
13 Company Profiling
13.1 IBM Corporation
13.2 Splunk Inc.
13.3 Google LLC
13.4 Microsoft Corporation
13.5 Oracle Corporation
13.6 SAP SE
13.7 Adobe Systems Incorporated
13.8 Teradata Corporation
13.9 SAS Institute Inc.
13.10 Mixpanel, Inc.
13.11 Hewlett Packard Enterprise
13.12 Salesforce.com, Inc.
13.13 RapidMiner Inc.
13.14 Tableau Software LLC
13.15 New Relic Inc.
13.16 Awareness Technologies
List of Tables
1 Global Behaviour Analytics Market Outlook, By Region (2022-2030) ($MN)
2 Global Behaviour Analytics Market Outlook, By Analytics Type (2022-2030) ($MN)
3 Global Behaviour Analytics Market Outlook, By Predictive Analytics (2022-2030) ($MN)
4 Global Behaviour Analytics Market Outlook, By Prescriptive Analytics (2022-2030) ($MN)
5 Global Behaviour Analytics Market Outlook, By Descriptive Analytics (2022-2030) ($MN)
6 Global Behaviour Analytics Market Outlook, By Other Analytics Types (2022-2030) ($MN)
7 Global Behaviour Analytics Market Outlook, By Component (2022-2030) ($MN)
8 Global Behaviour Analytics Market Outlook, By Software (2022-2030) ($MN)
9 Global Behaviour Analytics Market Outlook, By Standalone Behavior Analytics Software (2022-2030) ($MN)
10 Global Behaviour Analytics Market Outlook, By Integrated Behavior Analytics Software (2022-2030) ($MN)
11 Global Behaviour Analytics Market Outlook, By Analytics & Reporting Tools (2022-2030) ($MN)
12 Global Behaviour Analytics Market Outlook, By Data Visualization Tools (2022-2030) ($MN)
13 Global Behaviour Analytics Market Outlook, By Services (2022-2030) ($MN)
14 Global Behaviour Analytics Market Outlook, By Professional Services (2022-2030) ($MN)
15 Global Behaviour Analytics Market Outlook, By Managed Services (2022-2030) ($MN)
16 Global Behaviour Analytics Market Outlook, By Consulting Services (2022-2030) ($MN)
17 Global Behaviour Analytics Market Outlook, By System Integration & Deployment (2022-2030) ($MN)
18 Global Behaviour Analytics Market Outlook, By Deployment Mode (2022-2030) ($MN)
19 Global Behaviour Analytics Market Outlook, By Cloud-based (2022-2030) ($MN)
20 Global Behaviour Analytics Market Outlook, By On-premise (2022-2030) ($MN)
21 Global Behaviour Analytics Market Outlook, By Organization Size (2022-2030) ($MN)
22 Global Behaviour Analytics Market Outlook, By Small & Medium-sized Enterprises (SMEs) (2022-2030) ($MN)
23 Global Behaviour Analytics Market Outlook, By Large Enterprises (2022-2030) ($MN)
24 Global Behaviour Analytics Market Outlook, By Application (2022-2030) ($MN)
25 Global Behaviour Analytics Market Outlook, By Security & Fraud Detection (2022-2030) ($MN)
26 Global Behaviour Analytics Market Outlook, By Threat Management (2022-2030) ($MN)
27 Global Behaviour Analytics Market Outlook, By User Experience Management (2022-2030) ($MN)
28 Global Behaviour Analytics Market Outlook, By Risk Management (2022-2030) ($MN)
29 Global Behaviour Analytics Market Outlook, By Compliance Management (2022-2030) ($MN)
30 Global Behaviour Analytics Market Outlook, By Insider Threat Detection (2022-2030) ($MN)
31 Global Behaviour Analytics Market Outlook, By Other Applications (2022-2030) ($MN)
32 Global Behaviour Analytics Market Outlook, By End User (2022-2030) ($MN)
33 Global Behaviour Analytics Market Outlook, By Banking, Financial Services, and Insurance (BFSI) (2022-2030) ($MN)
34 Global Behaviour Analytics Market Outlook, By Healthcare (2022-2030) ($MN)
35 Global Behaviour Analytics Market Outlook, By Retail & E-commerce (2022-2030) ($MN)
36 Global Behaviour Analytics Market Outlook, By Government & Defense (2022-2030) ($MN)
37 Global Behaviour Analytics Market Outlook, By Transportation & Logistics (2022-2030) ($MN)
38 Global Behaviour Analytics Market Outlook, By Education (2022-2030) ($MN)
39 Global Behaviour Analytics Market Outlook, By Other End Users (2022-2030) ($MN)
Note: Tables for North America, Europe, APAC, South America, and Middle East & Africa Regions are also represented in the same manner as above.
List of Figures
RESEARCH METHODOLOGY

We at ‘Stratistics’ opt for an extensive research approach which involves data mining, data validation, and data analysis. The various research sources include in-house repository, secondary research, competitor’s sources, social media research, client internal data, and primary research.
Our team of analysts prefers the most reliable and authenticated data sources in order to perform the comprehensive literature search. With access to most of the authenticated data bases our team highly considers the best mix of information through various sources to obtain extensive and accurate analysis.
Each report takes an average time of a month and a team of 4 industry analysts. The time may vary depending on the scope and data availability of the desired market report. The various parameters used in the market assessment are standardized in order to enhance the data accuracy.
Data Mining
The data is collected from several authenticated, reliable, paid and unpaid sources and is filtered depending on the scope & objective of the research. Our reports repository acts as an added advantage in this procedure. Data gathering from the raw material suppliers, distributors and the manufacturers is performed on a regular basis, this helps in the comprehensive understanding of the products value chain. Apart from the above mentioned sources the data is also collected from the industry consultants to ensure the objective of the study is in the right direction.
Market trends such as technological advancements, regulatory affairs, market dynamics (Drivers, Restraints, Opportunities and Challenges) are obtained from scientific journals, market related national & international associations and organizations.
Data Analysis
From the data that is collected depending on the scope & objective of the research the data is subjected for the analysis. The critical steps that we follow for the data analysis include:
- Product Lifecycle Analysis
- Competitor analysis
- Risk analysis
- Porters Analysis
- PESTEL Analysis
- SWOT Analysis
The data engineering is performed by the core industry experts considering both the Marketing Mix Modeling and the Demand Forecasting. The marketing mix modeling makes use of multiple-regression techniques to predict the optimal mix of marketing variables. Regression factor is based on a number of variables and how they relate to an outcome such as sales or profits.
Data Validation
The data validation is performed by the exhaustive primary research from the expert interviews. This includes telephonic interviews, focus groups, face to face interviews, and questionnaires to validate our research from all aspects. The industry experts we approach come from the leading firms, involved in the supply chain ranging from the suppliers, distributors to the manufacturers and consumers so as to ensure an unbiased analysis.
We are in touch with more than 15,000 industry experts with the right mix of consultants, CEO's, presidents, vice presidents, managers, experts from both supply side and demand side, executives and so on.
The data validation involves the primary research from the industry experts belonging to:
- Leading Companies
- Suppliers & Distributors
- Manufacturers
- Consumers
- Industry/Strategic Consultants
Apart from the data validation the primary research also helps in performing the fill gap research, i.e. providing solutions for the unmet needs of the research which helps in enhancing the reports quality.
For more details about research methodology, kindly write to us at info@strategymrc.com
Frequently Asked Questions
In case of any queries regarding this report, you can contact the customer service by filing the “Inquiry Before Buy” form available on the right hand side. You may also contact us through email: info@strategymrc.com or phone: +1-301-202-5929
Yes, the samples are available for all the published reports. You can request them by filling the “Request Sample” option available in this page.
Yes, you can request a sample with your specific requirements. All the customized samples will be provided as per the requirement with the real data masked.
All our reports are available in Digital PDF format. In case if you require them in any other formats, such as PPT, Excel etc you can submit a request through “Inquiry Before Buy” form available on the right hand side. You may also contact us through email: info@strategymrc.com or phone: +1-301-202-5929
We offer a free 15% customization with every purchase. This requirement can be fulfilled for both pre and post sale. You may send your customization requirements through email at info@strategymrc.com or call us on +1-301-202-5929.
We have 3 different licensing options available in electronic format.
- Single User Licence: Allows one person, typically the buyer, to have access to the ordered product. The ordered product cannot be distributed to anyone else.
- 2-5 User Licence: Allows the ordered product to be shared among a maximum of 5 people within your organisation.
- Corporate License: Allows the product to be shared among all employees of your organisation regardless of their geographical location.
All our reports are typically be emailed to you as an attachment.
To order any available report you need to register on our website. The payment can be made either through CCAvenue or PayPal payments gateways which accept all international cards.
We extend our support to 6 months post sale. A post sale customization is also provided to cover your unmet needs in the report.
Request Customization
We offer complimentary customization of up to 15% with every purchase. To share your customization requirements, feel free to email us at info@strategymrc.com or call us on +1-301-202-5929. .
Please Note: Customization within the 15% threshold is entirely free of charge. If your request exceeds this limit, we will conduct a feasibility assessment. Following that, a detailed quote and timeline will be provided.
WHY CHOOSE US ?

Assured Quality
Best in class reports with high standard of research integrity

24X7 Research Support
Continuous support to ensure the best customer experience.

Free Customization
Adding more values to your product of interest.

Safe & Secure Access
Providing a secured environment for all online transactions.

Trusted by 600+ Brands
Serving the most reputed brands across the world.