
Bifacial Solar Market
Bifacial Solar Market Forecasts to 2030 - Global Analysis By Cell Type (Passivated emitter rear cells, Heterojunction cells and Other Cell Types), Frame Type (Frameless, Framed and Other Frame Types), Type, End User and By Geography

|
Years Covered |
2021-2030 |
|
Estimated Year Value (2023) |
US $11.6 BN |
|
Projected Year Value (2030) |
US $32.1 BN |
|
CAGR (2023 - 2030) |
15.6% |
|
Regions Covered |
North America, Europe, Asia Pacific, South America, and Middle East & Africa |
|
Countries Covered |
US, Canada, Mexico, Germany, UK, Italy, France, Spain, Japan, China, India, Australia, New Zealand, South Korea, Rest of Asia Pacific, South America, Argentina, Brazil, Chile, Middle East & Africa, Saudi Arabia, UAE, Qatar, and South Africa |
|
Largest Market |
Europe |
|
Highest Growing Market |
Asia Pacific |
According to Stratistics MRC, the Global Bifacial Solar Market is accounted for $11.6 billion in 2023 and is expected to reach $32.1 billion by 2030 growing at a CAGR of 15.6% during the forecast period. Bifacial solar panels are intriguing new solar solutions for specific kinds of solar installations because they can absorb sunlight from both their front and back surfaces. Bifacial solar panels can gather solar radiation from both sides, improving performance and increasing the amount of energy produced by the panel. As opposed to traditional monofacial solar modules, bifacial solar can produce electricity from the front as well as the back surfaces of the panels, enhancing energy production.
Market Dynamics:
Driver:
Enhanced efficiency
The efficiency of bifacial solar panels has significantly increased, which is fueling industry expansion. The overall effectiveness of bifacial panels has increased as a result of developments in cell and module technology, including improved conversion efficiencies and better light collection techniques. The economic significance of bifacial solar systems rises as efficiency continues to improve.
Restraint:
High cost
Bifacial solar panels are still generally more expensive than conventional single-sided solar panels, despite the fact that their cost has been declining. For certain project developers and financiers, the added cost of bifacial modules, coupled with the related support structures and tracking systems, can be an expense. Bifacial solar projects need a large upfront investment, which may prevent them from being widely used, especially in regions with limited financial resources.
Opportunity:
Technological advancements
Due to the creation of novel materials, designs, and manufacturing processes to improve the performance and durability of bifacial solar panels, ongoing research and development initiatives are driving technological breakthroughs in the market for bifacial solar. Bifacial solar technology's range of potential uses is growing due to advancements like transparent back sheets, improved cell layouts, and sophisticated tracking systems.
Threat:
Complexity of installation and maintenance
In comparison to conventional solar installations, bifacial solar projects may need specific installation methods and additional considerations. The project design and construction processes may become more complicated as a result of the optimization of panel tilt angles, shading analyses, and the choice of suitable tracking systems. However, bifacial solar panels need to be processed and maintained carefully to prevent damage to the rear side and maintain optimal energy capture.
Covid-19 Impact:
COVID-19 had a significant negative influence on the world economy and worldwide trade, which has simultaneously had an adverse effect on households, businesses, financial institutions, industrial organizations, and infrastructure corporations. Due to the lockdown in many nations that has hindered market expansion, the coronavirus has had an impact on various economies. In most nations throughout the world, the closure of an industrial company caused a drop in demand for solar-related equipment, which in turn caused a decline in the bifacial solar market's demand.
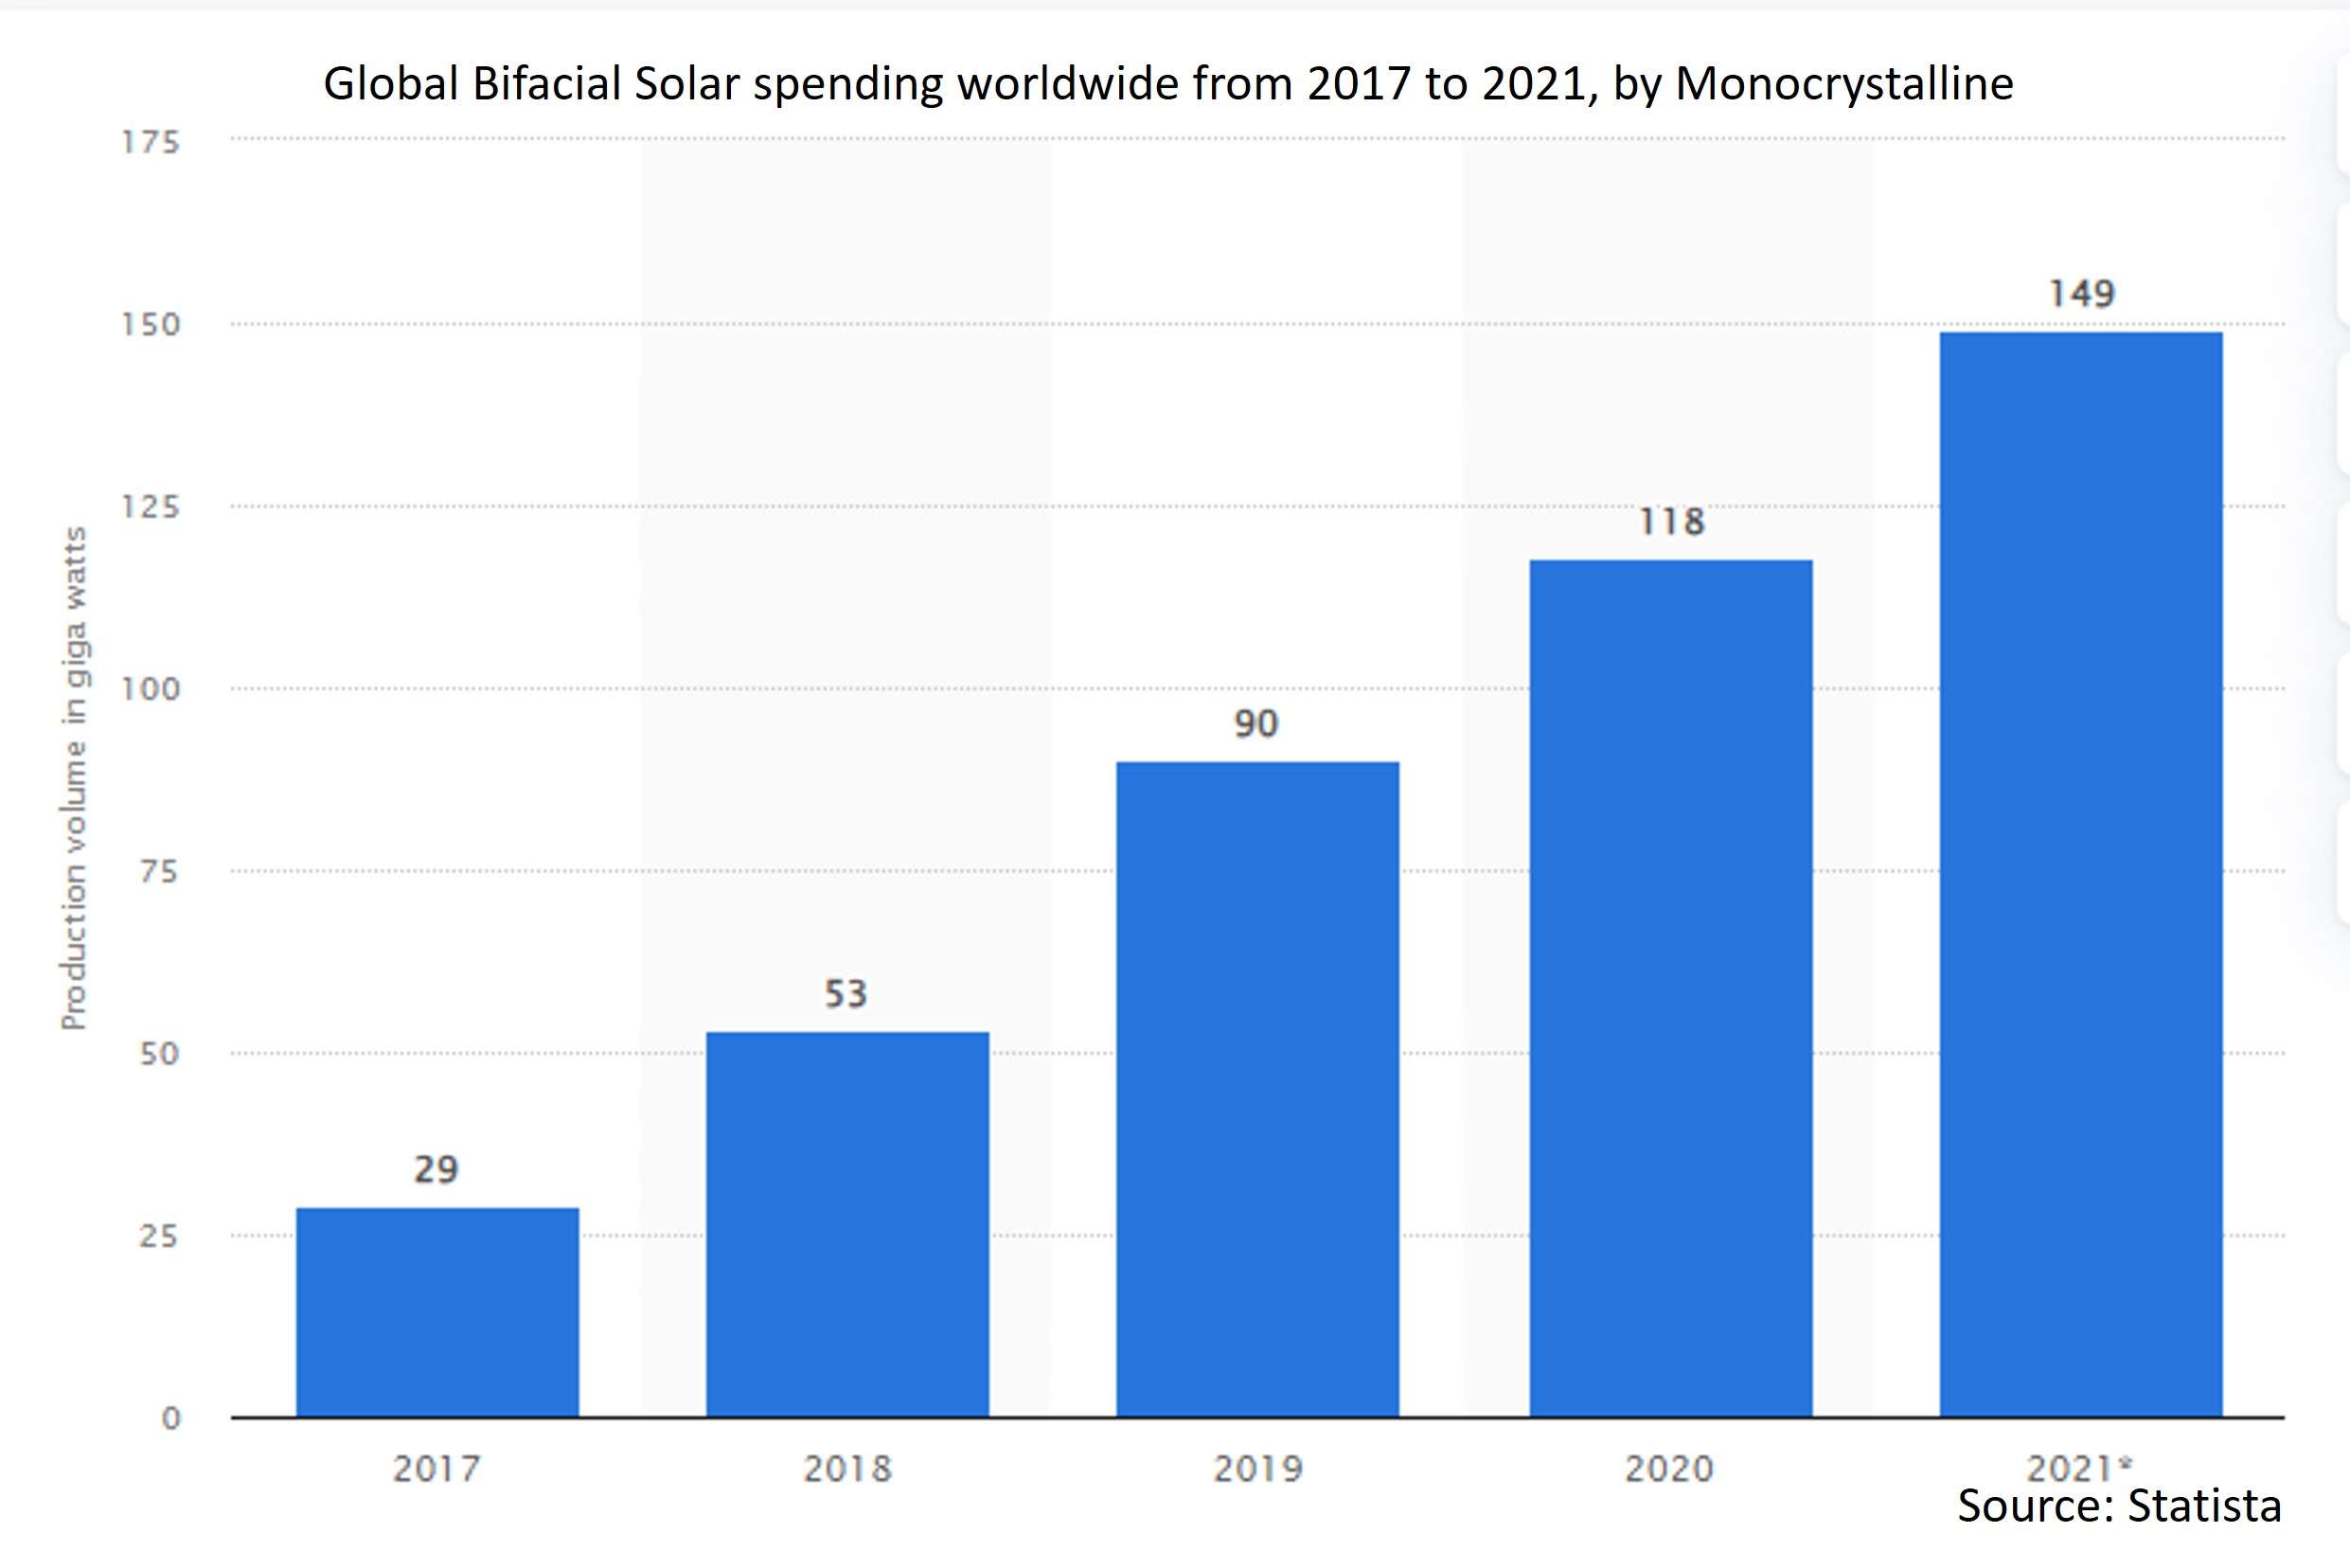
The monocrystalline segment is expected to be the largest during the forecast period
Because of the highest efficiency rates, which are typically in the range of 15% to 20%, the monocrystalline sector held the largest share over the predicted period. Monocrystalline solar panels are also more effective in hot climates than polycrystalline ones. Additionally, monocrystalline materials are anticipated to endure the longest and perform better in heat. Growing advancements will propel the market for monocrystalline panels over the projection period, expanding the market for bifacial solar.
The commercial segment is expected to have the highest CAGR during the forecast period
Because of a rise in demand for electricity in the commercial sector during peak hours, the commercial category is anticipated to experience the highest CAGR during the forecast period. Bifacial solar panels generated 11% more energy than conventional solar panels in an inclined, ground-mounted solar system in China, according to a report by solar panel manufacturer. In the commercial sector, a system with bifacial panels and solar trackers generated 27% more solar energy than a comparable-sized system with conventional panels.
Region with largest share:
Europe is anticipated to hold the largest share over the extrapolated period due to the existence of strict regulations regarding the reduction of carbon footprints across the country, and rapid developments in recent years have exceeded expectations regarding steep cost reduction, flexibility, user friendliness, and its numerous applications in many sectors. This has encouraged the manufacturer to increase its production capacity. Furthermore, the European Union (EU) and other national organizations with business members assist policymakers in enabling solar to realize its enormous potential in order to reach the EU's 2030 targets.
Region with highest CAGR:
Asia Pacific is predicted to witness a profitable CAGR due to governments in the region, especially India, China, and a few South Asian nations, spending a lot of effort creating renewable energy sources and investing in solar energy. The region has been growing as a result of considerable government support for the development of renewable energy sources. Additionally, in India and China, the bifacial solar industry is anticipated to expand rapidly due to the enormous installed base of solar panels.

Key players in the market
Some of the key players in Bifacial Solar market include Canadian Solar Inc, Jinkosolar holding CO. Ltd, LG Electronics, LONGi, Lumos Solar, MegaCell, Neo Solar Power, Panasonic, Prism Solar, PVG Solutions, Silfab, SolarWorld, Sunpreme, Trina Solar and Yingli Green Energy.
Key Developments:
In August 2023, LG Electronics launches LG UltraGear OLED for a smoother, more immersive gaming experience. These monitors come equipped with a range of winning features that set them apart in the gaming monitor arena, promising an unparalleled gaming experience.
In August 2023, LG Electronics has announced a strategic partnership with ITC Foods to redefine cooking experience for consumers in the country. As part of the partnership, 2 new microwave ovens are announced with ‘Scan to Cook’ feature. This will bring together LG’s expertise in home appliances and ITC Foods excellence to create a seamless and intuitive cooking environment, making life simpler for consumers.
Cell Types Covered:
• Passivated emitter rear cells
• Heterojunction cells
• Other Cell Types
Frame Types Covered:
• Frameless
• Framed
• Other Frame Types
Types Covered:
• Monocrystalline
• Polycrystalline
• Other Types
End Users Covered:
• Industrial
• Commercial
• Residential
• Other End Users
Regions Covered:
• North America
o US
o Canada
o Mexico
• Europe
o Germany
o UK
o Italy
o France
o Spain
o Rest of Europe
• Asia Pacific
o Japan
o China
o India
o Australia
o New Zealand
o South Korea
o Rest of Asia Pacific
• South America
o Argentina
o Brazil
o Chile
o Rest of South America
• Middle East & Africa
o Saudi Arabia
o UAE
o Qatar
o South Africa
o Rest of Middle East & Africa
What our report offers:
- Market share assessments for the regional and country-level segments
- Strategic recommendations for the new entrants
- Covers Market data for the years 2021, 2022, 2023, 2026, and 2030
- Market Trends (Drivers, Constraints, Opportunities, Threats, Challenges, Investment Opportunities, and recommendations)
- Strategic recommendations in key business segments based on the market estimations
- Competitive landscaping mapping the key common trends
- Company profiling with detailed strategies, financials, and recent developments
- Supply chain trends mapping the latest technological advancements
Free Customization Offerings:
All the customers of this report will be entitled to receive one of the following free customization options:
• Company Profiling
o Comprehensive profiling of additional market players (up to 3)
o SWOT Analysis of key players (up to 3)
• Regional Segmentation
o Market estimations, Forecasts and CAGR of any prominent country as per the client's interest (Note: Depends on feasibility check)
• Competitive Benchmarking
Benchmarking of key players based on product portfolio, geographical presence, and strategic alliances
Table of Contents
1 Executive Summary
2 Preface
2.1 Abstract
2.2 Stake Holders
2.3 Research Scope
2.4 Research Methodology
2.4.1 Data Mining
2.4.2 Data Analysis
2.4.3 Data Validation
2.4.4 Research Approach
2.5 Research Sources
2.5.1 Primary Research Sources
2.5.2 Secondary Research Sources
2.5.3 Assumptions
3 Market Trend Analysis
3.1 Introduction
3.2 Drivers
3.3 Restraints
3.4 Opportunities
3.5 Threats
3.6 End User Analysis
3.7 Emerging Markets
3.8 Impact of Covid-19
4 Porters Five Force Analysis
4.1 Bargaining power of suppliers
4.2 Bargaining power of buyers
4.3 Threat of substitutes
4.4 Threat of new entrants
4.5 Competitive rivalry
5 Global Bifacial Solar Market, By Cell Type
5.1 Introduction
5.2 Passivated emitter rear cells
5.3 Heterojunction cells
5.4 Other Cell Types
6 Global Bifacial Solar Market, By Frame Type
6.1 Introduction
6.2 Frameless
6.3 Framed
6.4 Other Frame Types
7 Global Bifacial Solar Market, By Type
7.1 Introduction
7.2 Monocrystalline
7.3 Polycrystalline
7.4 Other Types
8 Global Bifacial Solar Market, By End User
8.1 Introduction
8.2 Industrial
8.3 Commercial
8.4 Residential
8.5 Other End Users
9 Global Bifacial Solar Market, By Geography
9.1 Introduction
9.2 North America
9.2.1 US
9.2.2 Canada
9.2.3 Mexico
9.3 Europe
9.3.1 Germany
9.3.2 UK
9.3.3 Italy
9.3.4 France
9.3.5 Spain
9.3.6 Rest of Europe
9.4 Asia Pacific
9.4.1 Japan
9.4.2 China
9.4.3 India
9.4.4 Australia
9.4.5 New Zealand
9.4.6 South Korea
9.4.7 Rest of Asia Pacific
9.5 South America
9.5.1 Argentina
9.5.2 Brazil
9.5.3 Chile
9.5.4 Rest of South America
9.6 Middle East & Africa
9.6.1 Saudi Arabia
9.6.2 UAE
9.6.3 Qatar
9.6.4 South Africa
9.6.5 Rest of Middle East & Africa
10 Key Developments
10.1 Agreements, Partnerships, Collaborations and Joint Ventures
10.2 Acquisitions & Mergers
10.3 New Product Launch
10.4 Expansions
10.5 Other Key Strategies
11 Company Profiling
11.1 Canadian Solar Inc
11.2 Jinkosolar holding CO. Ltd
11.3 LG Electronics
11.4 LONGi
11.5 Lumos Solar
11.6 MegaCell
11.7 Neo Solar Power
11.8 Panasonic
11.9 Prism Solar
11.10 PVG Solutions
11.11 Silfab
11.12 SolarWorld
11.13 Sunpreme
11.14 Trina Solar
11.15 Yingli Green Energy
List of Tables
1 Global Bifacial Solar Market Outlook, By Region (2021-2030) ($MN)
2 Global Bifacial Solar Market Outlook, By Cell Type (2021-2030) ($MN)
3 Global Bifacial Solar Market Outlook, By Passivated emitter rear cells (2021-2030) ($MN)
4 Global Bifacial Solar Market Outlook, By Heterojunction cells (2021-2030) ($MN)
5 Global Bifacial Solar Market Outlook, By Other Cell Types (2021-2030) ($MN)
6 Global Bifacial Solar Market Outlook, By Frame Type (2021-2030) ($MN)
7 Global Bifacial Solar Market Outlook, By Frameless (2021-2030) ($MN)
8 Global Bifacial Solar Market Outlook, By Framed (2021-2030) ($MN)
9 Global Bifacial Solar Market Outlook, By Other Frame Types (2021-2030) ($MN)
10 Global Bifacial Solar Market Outlook, By Type (2021-2030) ($MN)
11 Global Bifacial Solar Market Outlook, By Monocrystalline (2021-2030) ($MN)
12 Global Bifacial Solar Market Outlook, By Polycrystalline (2021-2030) ($MN)
13 Global Bifacial Solar Market Outlook, By Other Types (2021-2030) ($MN)
14 Global Bifacial Solar Market Outlook, By End User (2021-2030) ($MN)
15 Global Bifacial Solar Market Outlook, By Industrial (2021-2030) ($MN)
16 Global Bifacial Solar Market Outlook, By Commercial (2021-2030) ($MN)
17 Global Bifacial Solar Market Outlook, By Residential (2021-2030) ($MN)
18 Global Bifacial Solar Market Outlook, By Other End Users (2021-2030) ($MN)
19 North America Bifacial Solar Market Outlook, By Country (2021-2030) ($MN)
20 North America Bifacial Solar Market Outlook, By Cell Type (2021-2030) ($MN)
21 North America Bifacial Solar Market Outlook, By Passivated emitter rear cells (2021-2030) ($MN)
22 North America Bifacial Solar Market Outlook, By Heterojunction cells (2021-2030) ($MN)
23 North America Bifacial Solar Market Outlook, By Other Cell Types (2021-2030) ($MN)
24 North America Bifacial Solar Market Outlook, By Frame Type (2021-2030) ($MN)
25 North America Bifacial Solar Market Outlook, By Frameless (2021-2030) ($MN)
26 North America Bifacial Solar Market Outlook, By Framed (2021-2030) ($MN)
27 North America Bifacial Solar Market Outlook, By Other Frame Types (2021-2030) ($MN)
28 North America Bifacial Solar Market Outlook, By Type (2021-2030) ($MN)
29 North America Bifacial Solar Market Outlook, By Monocrystalline (2021-2030) ($MN)
30 North America Bifacial Solar Market Outlook, By Polycrystalline (2021-2030) ($MN)
31 North America Bifacial Solar Market Outlook, By Other Types (2021-2030) ($MN)
32 North America Bifacial Solar Market Outlook, By End User (2021-2030) ($MN)
33 North America Bifacial Solar Market Outlook, By Industrial (2021-2030) ($MN)
34 North America Bifacial Solar Market Outlook, By Commercial (2021-2030) ($MN)
35 North America Bifacial Solar Market Outlook, By Residential (2021-2030) ($MN)
36 North America Bifacial Solar Market Outlook, By Other End Users (2021-2030) ($MN)
37 Europe Bifacial Solar Market Outlook, By Country (2021-2030) ($MN)
38 Europe Bifacial Solar Market Outlook, By Cell Type (2021-2030) ($MN)
39 Europe Bifacial Solar Market Outlook, By Passivated emitter rear cells (2021-2030) ($MN)
40 Europe Bifacial Solar Market Outlook, By Heterojunction cells (2021-2030) ($MN)
41 Europe Bifacial Solar Market Outlook, By Other Cell Types (2021-2030) ($MN)
42 Europe Bifacial Solar Market Outlook, By Frame Type (2021-2030) ($MN)
43 Europe Bifacial Solar Market Outlook, By Frameless (2021-2030) ($MN)
44 Europe Bifacial Solar Market Outlook, By Framed (2021-2030) ($MN)
45 Europe Bifacial Solar Market Outlook, By Other Frame Types (2021-2030) ($MN)
46 Europe Bifacial Solar Market Outlook, By Type (2021-2030) ($MN)
47 Europe Bifacial Solar Market Outlook, By Monocrystalline (2021-2030) ($MN)
48 Europe Bifacial Solar Market Outlook, By Polycrystalline (2021-2030) ($MN)
49 Europe Bifacial Solar Market Outlook, By Other Types (2021-2030) ($MN)
50 Europe Bifacial Solar Market Outlook, By End User (2021-2030) ($MN)
51 Europe Bifacial Solar Market Outlook, By Industrial (2021-2030) ($MN)
52 Europe Bifacial Solar Market Outlook, By Commercial (2021-2030) ($MN)
53 Europe Bifacial Solar Market Outlook, By Residential (2021-2030) ($MN)
54 Europe Bifacial Solar Market Outlook, By Other End Users (2021-2030) ($MN)
55 Asia Pacific Bifacial Solar Market Outlook, By Country (2021-2030) ($MN)
56 Asia Pacific Bifacial Solar Market Outlook, By Cell Type (2021-2030) ($MN)
57 Asia Pacific Bifacial Solar Market Outlook, By Passivated emitter rear cells (2021-2030) ($MN)
58 Asia Pacific Bifacial Solar Market Outlook, By Heterojunction cells (2021-2030) ($MN)
59 Asia Pacific Bifacial Solar Market Outlook, By Other Cell Types (2021-2030) ($MN)
60 Asia Pacific Bifacial Solar Market Outlook, By Frame Type (2021-2030) ($MN)
61 Asia Pacific Bifacial Solar Market Outlook, By Frameless (2021-2030) ($MN)
62 Asia Pacific Bifacial Solar Market Outlook, By Framed (2021-2030) ($MN)
63 Asia Pacific Bifacial Solar Market Outlook, By Other Frame Types (2021-2030) ($MN)
64 Asia Pacific Bifacial Solar Market Outlook, By Type (2021-2030) ($MN)
65 Asia Pacific Bifacial Solar Market Outlook, By Monocrystalline (2021-2030) ($MN)
66 Asia Pacific Bifacial Solar Market Outlook, By Polycrystalline (2021-2030) ($MN)
67 Asia Pacific Bifacial Solar Market Outlook, By Other Types (2021-2030) ($MN)
68 Asia Pacific Bifacial Solar Market Outlook, By End User (2021-2030) ($MN)
69 Asia Pacific Bifacial Solar Market Outlook, By Industrial (2021-2030) ($MN)
70 Asia Pacific Bifacial Solar Market Outlook, By Commercial (2021-2030) ($MN)
71 Asia Pacific Bifacial Solar Market Outlook, By Residential (2021-2030) ($MN)
72 Asia Pacific Bifacial Solar Market Outlook, By Other End Users (2021-2030) ($MN)
73 South America Bifacial Solar Market Outlook, By Country (2021-2030) ($MN)
74 South America Bifacial Solar Market Outlook, By Cell Type (2021-2030) ($MN)
75 South America Bifacial Solar Market Outlook, By Passivated emitter rear cells (2021-2030) ($MN)
76 South America Bifacial Solar Market Outlook, By Heterojunction cells (2021-2030) ($MN)
77 South America Bifacial Solar Market Outlook, By Other Cell Types (2021-2030) ($MN)
78 South America Bifacial Solar Market Outlook, By Frame Type (2021-2030) ($MN)
79 South America Bifacial Solar Market Outlook, By Frameless (2021-2030) ($MN)
80 South America Bifacial Solar Market Outlook, By Framed (2021-2030) ($MN)
81 South America Bifacial Solar Market Outlook, By Other Frame Types (2021-2030) ($MN)
82 South America Bifacial Solar Market Outlook, By Type (2021-2030) ($MN)
83 South America Bifacial Solar Market Outlook, By Monocrystalline (2021-2030) ($MN)
84 South America Bifacial Solar Market Outlook, By Polycrystalline (2021-2030) ($MN)
85 South America Bifacial Solar Market Outlook, By Other Types (2021-2030) ($MN)
86 South America Bifacial Solar Market Outlook, By End User (2021-2030) ($MN)
87 South America Bifacial Solar Market Outlook, By Industrial (2021-2030) ($MN)
88 South America Bifacial Solar Market Outlook, By Commercial (2021-2030) ($MN)
89 South America Bifacial Solar Market Outlook, By Residential (2021-2030) ($MN)
90 South America Bifacial Solar Market Outlook, By Other End Users (2021-2030) ($MN)
91 Middle East & Africa Bifacial Solar Market Outlook, By Country (2021-2030) ($MN)
92 Middle East & Africa Bifacial Solar Market Outlook, By Cell Type (2021-2030) ($MN)
93 Middle East & Africa Bifacial Solar Market Outlook, By Passivated emitter rear cells (2021-2030) ($MN)
94 Middle East & Africa Bifacial Solar Market Outlook, By Heterojunction cells (2021-2030) ($MN)
95 Middle East & Africa Bifacial Solar Market Outlook, By Other Cell Types (2021-2030) ($MN)
96 Middle East & Africa Bifacial Solar Market Outlook, By Frame Type (2021-2030) ($MN)
97 Middle East & Africa Bifacial Solar Market Outlook, By Frameless (2021-2030) ($MN)
98 Middle East & Africa Bifacial Solar Market Outlook, By Framed (2021-2030) ($MN)
99 Middle East & Africa Bifacial Solar Market Outlook, By Other Frame Types (2021-2030) ($MN)
100 Middle East & Africa Bifacial Solar Market Outlook, By Type (2021-2030) ($MN)
101 Middle East & Africa Bifacial Solar Market Outlook, By Monocrystalline (2021-2030) ($MN)
102 Middle East & Africa Bifacial Solar Market Outlook, By Polycrystalline (2021-2030) ($MN)
103 Middle East & Africa Bifacial Solar Market Outlook, By Other Types (2021-2030) ($MN)
104 Middle East & Africa Bifacial Solar Market Outlook, By End User (2021-2030) ($MN)
105 Middle East & Africa Bifacial Solar Market Outlook, By Industrial (2021-2030) ($MN)
106 Middle East & Africa Bifacial Solar Market Outlook, By Commercial (2021-2030) ($MN)
107 Middle East & Africa Bifacial Solar Market Outlook, By Residential (2021-2030) ($MN)
108 Middle East & Africa Bifacial Solar Market Outlook, By Other End Users (2021-2030) ($MN)
List of Figures
RESEARCH METHODOLOGY

We at ‘Stratistics’ opt for an extensive research approach which involves data mining, data validation, and data analysis. The various research sources include in-house repository, secondary research, competitor’s sources, social media research, client internal data, and primary research.
Our team of analysts prefers the most reliable and authenticated data sources in order to perform the comprehensive literature search. With access to most of the authenticated data bases our team highly considers the best mix of information through various sources to obtain extensive and accurate analysis.
Each report takes an average time of a month and a team of 4 industry analysts. The time may vary depending on the scope and data availability of the desired market report. The various parameters used in the market assessment are standardized in order to enhance the data accuracy.
Data Mining
The data is collected from several authenticated, reliable, paid and unpaid sources and is filtered depending on the scope & objective of the research. Our reports repository acts as an added advantage in this procedure. Data gathering from the raw material suppliers, distributors and the manufacturers is performed on a regular basis, this helps in the comprehensive understanding of the products value chain. Apart from the above mentioned sources the data is also collected from the industry consultants to ensure the objective of the study is in the right direction.
Market trends such as technological advancements, regulatory affairs, market dynamics (Drivers, Restraints, Opportunities and Challenges) are obtained from scientific journals, market related national & international associations and organizations.
Data Analysis
From the data that is collected depending on the scope & objective of the research the data is subjected for the analysis. The critical steps that we follow for the data analysis include:
- Product Lifecycle Analysis
- Competitor analysis
- Risk analysis
- Porters Analysis
- PESTEL Analysis
- SWOT Analysis
The data engineering is performed by the core industry experts considering both the Marketing Mix Modeling and the Demand Forecasting. The marketing mix modeling makes use of multiple-regression techniques to predict the optimal mix of marketing variables. Regression factor is based on a number of variables and how they relate to an outcome such as sales or profits.
Data Validation
The data validation is performed by the exhaustive primary research from the expert interviews. This includes telephonic interviews, focus groups, face to face interviews, and questionnaires to validate our research from all aspects. The industry experts we approach come from the leading firms, involved in the supply chain ranging from the suppliers, distributors to the manufacturers and consumers so as to ensure an unbiased analysis.
We are in touch with more than 15,000 industry experts with the right mix of consultants, CEO's, presidents, vice presidents, managers, experts from both supply side and demand side, executives and so on.
The data validation involves the primary research from the industry experts belonging to:
- Leading Companies
- Suppliers & Distributors
- Manufacturers
- Consumers
- Industry/Strategic Consultants
Apart from the data validation the primary research also helps in performing the fill gap research, i.e. providing solutions for the unmet needs of the research which helps in enhancing the reports quality.
For more details about research methodology, kindly write to us at info@strategymrc.com
Frequently Asked Questions
In case of any queries regarding this report, you can contact the customer service by filing the “Inquiry Before Buy” form available on the right hand side. You may also contact us through email: info@strategymrc.com or phone: +1-301-202-5929
Yes, the samples are available for all the published reports. You can request them by filling the “Request Sample” option available in this page.
Yes, you can request a sample with your specific requirements. All the customized samples will be provided as per the requirement with the real data masked.
All our reports are available in Digital PDF format. In case if you require them in any other formats, such as PPT, Excel etc you can submit a request through “Inquiry Before Buy” form available on the right hand side. You may also contact us through email: info@strategymrc.com or phone: +1-301-202-5929
We offer a free 15% customization with every purchase. This requirement can be fulfilled for both pre and post sale. You may send your customization requirements through email at info@strategymrc.com or call us on +1-301-202-5929.
We have 3 different licensing options available in electronic format.
- Single User Licence: Allows one person, typically the buyer, to have access to the ordered product. The ordered product cannot be distributed to anyone else.
- 2-5 User Licence: Allows the ordered product to be shared among a maximum of 5 people within your organisation.
- Corporate License: Allows the product to be shared among all employees of your organisation regardless of their geographical location.
All our reports are typically be emailed to you as an attachment.
To order any available report you need to register on our website. The payment can be made either through CCAvenue or PayPal payments gateways which accept all international cards.
We extend our support to 6 months post sale. A post sale customization is also provided to cover your unmet needs in the report.
Request Customization
We offer complimentary customization of up to 15% with every purchase. To share your customization requirements, feel free to email us at info@strategymrc.com or call us on +1-301-202-5929. .
Please Note: Customization within the 15% threshold is entirely free of charge. If your request exceeds this limit, we will conduct a feasibility assessment. Following that, a detailed quote and timeline will be provided.
WHY CHOOSE US ?

Assured Quality
Best in class reports with high standard of research integrity

24X7 Research Support
Continuous support to ensure the best customer experience.

Free Customization
Adding more values to your product of interest.

Safe & Secure Access
Providing a secured environment for all online transactions.

Trusted by 600+ Brands
Serving the most reputed brands across the world.