
Cerium Oxide Nanoparticles Market
Cerium Oxide Nanoparticles Market Forecasts to 2030 - Global Analysis By Form (Dispersion and Powder), Application (Chemical Mechanical Planarization (CMP), Polishing Agent, Coatings, Energy Storage, Sunscreen Cosmetics, Catalyst and Other Applications), End User and by Geography

|
Years Covered |
2022-2030 |
|
Estimated Year Value (2024) |
US $928.79 MN |
|
Projected Year Value (2030) |
US $2973.23 MN |
|
CAGR (2024 - 2030) |
21.4% |
|
Regions Covered |
North America, Europe, Asia Pacific, South America, and Middle East & Africa |
|
Countries Covered |
US, Canada, Mexico, Germany, UK, Italy, France, Spain, Japan, China, India, Australia, New Zealand, South Korea, Rest of Asia Pacific, South America, Argentina, Brazil, Chile, Middle East & Africa, Saudi Arabia, UAE, Qatar, and South Africa |
|
Largest Market |
Asia Pacific |
|
Highest Growing Market |
North America |
According to Stratistics MRC, the Global Cerium Oxide Nanoparticles Market is accounted for $928.79 million in 2024 and is expected to reach $2973.23 million by 2030 growing at a CAGR of 21.4% during the forecast period. Cerium oxide nanoparticles, or CeO2 nanoparticles for short, have special qualities that make them useful for a range of applications. Because of their capacity to transition between the oxidation states of Ce3+ and Ce4+, these nanoparticles are well-known for their high catalytic activity, which promotes redox reactions. They also play a critical role in automobile catalytic converters, which reduce exhaust emissions owing to their remarkable oxygen storage capacity.
According to the American Chemical Society, advancements in nanotechnology have revolutionized materials science and enabled breakthroughs in fields ranging from medicine to energy storage.
Market Dynamics:
Driver:
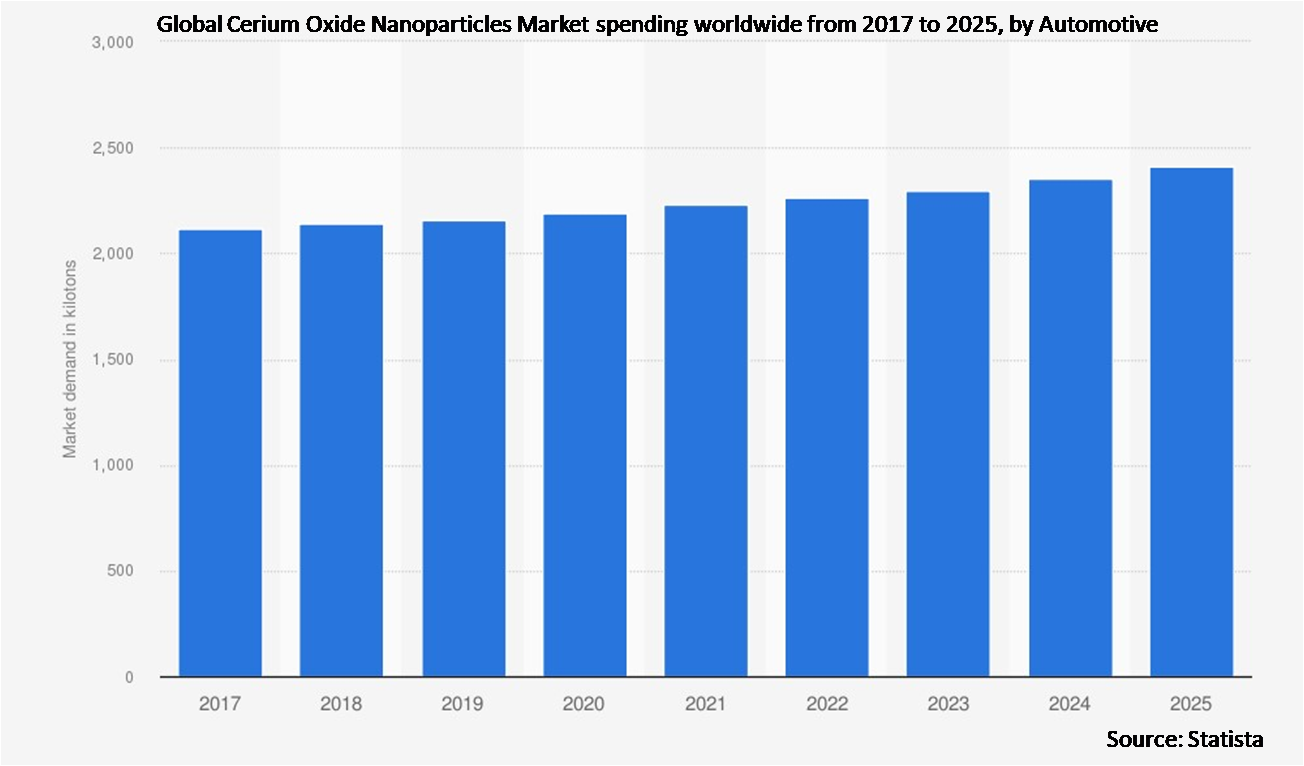
Increasing demand for car catalytic converters
Due to their effective oxygen storage and release capabilities, cerium oxide nanoparticles are widely utilized in automotive catalytic converters. With the help of this characteristic, toxic gases like nitrogen oxides and carbon monoxide can be converted into less toxic emissions like nitrogen and carbon dioxide. Additionally, the heightened emphasis on vehicle emissions reduction by the automotive industry in order to comply with strict environmental regulations has led to a notable increase in the demand for cerium oxide nanoparticles.
Restraint:
Scalability and cost concerns
The high cost of producing cerium oxide nanoparticles on a commercial scale is one of the main obstacles. Higher production costs are often caused by the need for complex procedures and specialized equipment in the synthesis of nanoparticles with consistent quality and purity. Furthermore, this may prevent them from being widely used, especially in markets with tight budgets or in situations where economies of scale are essential.
Opportunity:
Technological developments in biomedicine and healthcare
Cerium oxide nanoparticles present prospects for novel therapeutic treatments, targeted drug delivery methods, and diagnostic instruments in the healthcare industry. Their biocompatibility and antioxidant qualities are especially helpful in treating diseases linked to oxidative stress, promoting wound healing, and advancing imaging methods. Moreover, improved healthcare outcomes and personalized medicine may be possible with further research.
Threat:
Severe rivalry and substitution
Cerium oxide and other nanoparticles-related materials and technologies are fierce competitors in the market, offering comparable or better qualities. Developments in materials science and nanotechnology could result in the creation of more economical, effective, or environmentally friendly alternatives. Additionally, in some markets and applications, this might lessen the need for cerium oxide nanoparticles.
Covid-19 Impact:
The market for cerium oxide nanoparticles has experienced a variety of effects from the COVID-19 pandemic. Initially, delays in production and distribution had an impact on market availability due to disruptions in global supply chains and manufacturing operations. The demand from industries that use cerium oxide nanoparticles extensively, like the automotive, electronics, and construction sectors, was further suppressed by a reduction in industrial activity and strict lockdown measures implemented in many nations. However, demand increased as economies gradually recovered, especially in healthcare applications where cerium oxide nanoparticles are used in diagnostics and therapeutics.
The Powder segment is expected to be the largest during the forecast period
The powder segment typically holds the largest share in the cerium oxide nanoparticles market. Powdered cerium oxide nanoparticles are widely used across various industries due to their ease of handling, versatile applications, and ability to be integrated into different manufacturing processes. They are extensively employed in automotive catalytic converters for emissions control, where their high surface area and catalytic properties are crucial. Additionally, powdered cerium oxide nanoparticles find applications in polishing agents for precision optics, electronics, and ceramics due to their abrasive properties and ability to achieve fine surface finishes.
The Healthcare segment is expected to have the highest CAGR during the forecast period
The healthcare segment typically exhibits the highest CAGR in the cerium oxide nanoparticles market. This growth is driven by increasing research and development activities focused on utilizing cerium oxide nanoparticles in biomedical applications. In healthcare, these nanoparticles are valued for their antioxidant properties, biocompatibility, and potential therapeutic benefits in treating oxidative stress-related diseases and enhancing drug delivery systems. Moreover, their role in diagnostic imaging and biomarker detection further boosts demand.
Region with largest share:
In the cerium oxide nanoparticle market, the Asia-Pacific region usually holds the largest share. Widespread industrial activity in nations like China, Japan, South Korea, and India, especially in the automotive and electronics industries, is what fuels this dominance. The extensive use of cerium oxide nanoparticles in catalytic converters, electronics polishing, and other industrial applications is made possible by these countries strong infrastructures for advanced material research and development. Furthermore, the region's substantial market share is also largely due to rising investments in healthcare infrastructure and rising demand for cutting-edge medical technologies.
Region with highest CAGR:
The North American region has the highest CAGR in the cerium oxide nanoparticles market. Growing investments in R&D, especially in environmental and biomedical applications, are the main driver of this growth. Technological innovation and regulatory frameworks that facilitate the use of cutting-edge materials such as cerium oxide nanoparticles are highly valued in North America. Moreover, propelling market growth is the region's robust healthcare sector and strict environmental regulations that are creating a demand for cleaner technologies.
Key players in the market
Some of the key players in Cerium Oxide Nanoparticles market include Solvay, Nyacol Nano Technologies Inc., BASF, Advanced Nano Products Co., Ltd., Evonik Industries, Inframat Corporation, Strem Chemicals, Inc., Meliorum Technologies, Inc., Nanoshell, American Elements Inc, SkySpring Nanomaterials, Inc., Umicore, Cerion, LLC, Nanophase Technologies Corporation and Plasmachem GmbH.
Key Developments:
In July 2024, BASF and ENGIE have signed a seven year biomethane purchase agreement (BPA). Under the BPA, ENGIE will supply BASF with 2.7 to 3.0 terawatt hours of biomethane throughout the term of the agreement. BASF uses certified biomethane at its Ludwigshafen,Germany and Antwerp,Belgium sites as a sustainable alternative to fossil raw materials in its manufacturing process.
In June 2024, Solvay, a leader in rare earth materials supply for catalysis and electronics, and Cyclic Materials, an advanced metals recycling company building a circular supply chain for rare earth elements and other critical metals, announced the signing of an agreement for the supply of recycled mixed rare earth oxide (rMREO) from Cyclic Materials to Solvay, with shipments to begin in late 2024.
In February 2024, Vattenfall and Evonik have inked new long-term electricity supply contracts, aiming to bolster Evonik’s green energy consumption for chemical production. Commencing in 2025, two solar parks operated by Vattenfall in Schleswig-Holstein will furnish Evonik with approximately 120 gigawatt hours of solar power annually over a decade, under fixed conditions termed as “Power Purchase Agreements” (PPA).
Forms Covered:
• Dispersion
• Powder
Applications Covered:
• Chemical Mechanical Planarization (CMP)
• Polishing Agent
• Coatings
• Energy Storage
• Sunscreen Cosmetics
• Catalyst
• Other Applications
End Users Covered:
• Electronics
• Automotive
• Healthcare
• Other End Users
Regions Covered:
• North America
o US
o Canada
o Mexico
• Europe
o Germany
o UK
o Italy
o France
o Spain
o Rest of Europe
• Asia Pacific
o Japan
o China
o India
o Australia
o New Zealand
o South Korea
o Rest of Asia Pacific
• South America
o Argentina
o Brazil
o Chile
o Rest of South America
• Middle East & Africa
o Saudi Arabia
o UAE
o Qatar
o South Africa
o Rest of Middle East & Africa
What our report offers:
- Market share assessments for the regional and country-level segments
- Strategic recommendations for the new entrants
- Covers Market data for the years 2022, 2023, 2024, 2026, and 2030
- Market Trends (Drivers, Constraints, Opportunities, Threats, Challenges, Investment Opportunities, and recommendations)
- Strategic recommendations in key business segments based on the market estimations
- Competitive landscaping mapping the key common trends
- Company profiling with detailed strategies, financials, and recent developments
- Supply chain trends mapping the latest technological advancements
Free Customization Offerings:
All the customers of this report will be entitled to receive one of the following free customization options:
• Company Profiling
o Comprehensive profiling of additional market players (up to 3)
o SWOT Analysis of key players (up to 3)
• Regional Segmentation
o Market estimations, Forecasts and CAGR of any prominent country as per the client's interest (Note: Depends on feasibility check)
• Competitive Benchmarking
Benchmarking of key players based on product portfolio, geographical presence, and strategic alliances
Table of Contents
1 Executive Summary
2 Preface
2.1 Abstract
2.2 Stake Holders
2.3 Research Scope
2.4 Research Methodology
2.4.1 Data Mining
2.4.2 Data Analysis
2.4.3 Data Validation
2.4.4 Research Approach
2.5 Research Sources
2.5.1 Primary Research Sources
2.5.2 Secondary Research Sources
2.5.3 Assumptions
3 Market Trend Analysis
3.1 Introduction
3.2 Drivers
3.3 Restraints
3.4 Opportunities
3.5 Threats
3.6 Application Analysis
3.7 End User Analysis
3.8 Emerging Markets
3.9 Impact of Covid-19
4 Porters Five Force Analysis
4.1 Bargaining power of suppliers
4.2 Bargaining power of buyers
4.3 Threat of substitutes
4.4 Threat of new entrants
4.5 Competitive rivalry
5 Global Cerium Oxide Nanoparticles Market, By Form
5.1 Introduction
5.2 Dispersion
5.3 Powder
6 Global Cerium Oxide Nanoparticles Market, By Application
6.1 Introduction
6.2 Chemical Mechanical Planarization (CMP)
6.3 Polishing Agent
6.4 Coatings
6.5 Energy Storage
6.6 Sunscreen Cosmetics
6.6.1 SPF 30
6.6.2 SPF 45
6.6.3 SPF 50
6.7 Catalyst
6.8 Other Applications
7 Global Cerium Oxide Nanoparticles Market, By End User
7.1 Introduction
7.2 Electronics
7.3 Automotive
7.4 Healthcare
7.5 Other End Users
8 Global Cerium Oxide Nanoparticles Market, By Geography
8.1 Introduction
8.2 North America
8.2.1 US
8.2.2 Canada
8.2.3 Mexico
8.3 Europe
8.3.1 Germany
8.3.2 UK
8.3.3 Italy
8.3.4 France
8.3.5 Spain
8.3.6 Rest of Europe
8.4 Asia Pacific
8.4.1 Japan
8.4.2 China
8.4.3 India
8.4.4 Australia
8.4.5 New Zealand
8.4.6 South Korea
8.4.7 Rest of Asia Pacific
8.5 South America
8.5.1 Argentina
8.5.2 Brazil
8.5.3 Chile
8.5.4 Rest of South America
8.6 Middle East & Africa
8.6.1 Saudi Arabia
8.6.2 UAE
8.6.3 Qatar
8.6.4 South Africa
8.6.5 Rest of Middle East & Africa
9 Key Developments
9.1 Agreements, Partnerships, Collaborations and Joint Ventures
9.2 Acquisitions & Mergers
9.3 New Product Launch
9.4 Expansions
9.5 Other Key Strategies
10 Company Profiling
10.1 Solvay
10.2 Nyacol Nano Technologies Inc.
10.3 BASF
10.4 Advanced Nano Products Co., Ltd.
10.5 Evonik Industries
10.6 Inframat Corporation
10.7 Strem Chemicals, Inc.
10.8 Meliorum Technologies, Inc.
10.9 Nanoshell
10.10 American Elements Inc
10.11 SkySpring Nanomaterials, Inc.
10.12 Umicore
10.13 Cerion, LLC
10.14 Nanophase Technologies Corporation
10.15 Plasmachem GmbH
List of Tables
1 Global Cerium Oxide Nanoparticles Market Outlook, By Region (2022-2030) ($MN)
2 Global Cerium Oxide Nanoparticles Market Outlook, By Form (2022-2030) ($MN)
3 Global Cerium Oxide Nanoparticles Market Outlook, By Dispersion (2022-2030) ($MN)
4 Global Cerium Oxide Nanoparticles Market Outlook, By Powder (2022-2030) ($MN)
5 Global Cerium Oxide Nanoparticles Market Outlook, By Application (2022-2030) ($MN)
6 Global Cerium Oxide Nanoparticles Market Outlook, By Chemical Mechanical Planarization (CMP) (2022-2030) ($MN)
7 Global Cerium Oxide Nanoparticles Market Outlook, By Polishing Agent (2022-2030) ($MN)
8 Global Cerium Oxide Nanoparticles Market Outlook, By Coatings (2022-2030) ($MN)
9 Global Cerium Oxide Nanoparticles Market Outlook, By Energy Storage (2022-2030) ($MN)
10 Global Cerium Oxide Nanoparticles Market Outlook, By Sunscreen Cosmetics (2022-2030) ($MN)
11 Global Cerium Oxide Nanoparticles Market Outlook, By SPF 30 (2022-2030) ($MN)
12 Global Cerium Oxide Nanoparticles Market Outlook, By SPF 45 (2022-2030) ($MN)
13 Global Cerium Oxide Nanoparticles Market Outlook, By SPF 50 (2022-2030) ($MN)
14 Global Cerium Oxide Nanoparticles Market Outlook, By Catalyst (2022-2030) ($MN)
15 Global Cerium Oxide Nanoparticles Market Outlook, By Other Applications (2022-2030) ($MN)
16 Global Cerium Oxide Nanoparticles Market Outlook, By End User (2022-2030) ($MN)
17 Global Cerium Oxide Nanoparticles Market Outlook, By Electronics (2022-2030) ($MN)
18 Global Cerium Oxide Nanoparticles Market Outlook, By Automotive (2022-2030) ($MN)
19 Global Cerium Oxide Nanoparticles Market Outlook, By Healthcare (2022-2030) ($MN)
20 Global Cerium Oxide Nanoparticles Market Outlook, By Other End Users (2022-2030) ($MN)
21 North America Cerium Oxide Nanoparticles Market Outlook, By Country (2022-2030) ($MN)
22 North America Cerium Oxide Nanoparticles Market Outlook, By Form (2022-2030) ($MN)
23 North America Cerium Oxide Nanoparticles Market Outlook, By Dispersion (2022-2030) ($MN)
24 North America Cerium Oxide Nanoparticles Market Outlook, By Powder (2022-2030) ($MN)
25 North America Cerium Oxide Nanoparticles Market Outlook, By Application (2022-2030) ($MN)
26 North America Cerium Oxide Nanoparticles Market Outlook, By Chemical Mechanical Planarization (CMP) (2022-2030) ($MN)
27 North America Cerium Oxide Nanoparticles Market Outlook, By Polishing Agent (2022-2030) ($MN)
28 North America Cerium Oxide Nanoparticles Market Outlook, By Coatings (2022-2030) ($MN)
29 North America Cerium Oxide Nanoparticles Market Outlook, By Energy Storage (2022-2030) ($MN)
30 North America Cerium Oxide Nanoparticles Market Outlook, By Sunscreen Cosmetics (2022-2030) ($MN)
31 North America Cerium Oxide Nanoparticles Market Outlook, By SPF 30 (2022-2030) ($MN)
32 North America Cerium Oxide Nanoparticles Market Outlook, By SPF 45 (2022-2030) ($MN)
33 North America Cerium Oxide Nanoparticles Market Outlook, By SPF 50 (2022-2030) ($MN)
34 North America Cerium Oxide Nanoparticles Market Outlook, By Catalyst (2022-2030) ($MN)
35 North America Cerium Oxide Nanoparticles Market Outlook, By Other Applications (2022-2030) ($MN)
36 North America Cerium Oxide Nanoparticles Market Outlook, By End User (2022-2030) ($MN)
37 North America Cerium Oxide Nanoparticles Market Outlook, By Electronics (2022-2030) ($MN)
38 North America Cerium Oxide Nanoparticles Market Outlook, By Automotive (2022-2030) ($MN)
39 North America Cerium Oxide Nanoparticles Market Outlook, By Healthcare (2022-2030) ($MN)
40 North America Cerium Oxide Nanoparticles Market Outlook, By Other End Users (2022-2030) ($MN)
41 Europe Cerium Oxide Nanoparticles Market Outlook, By Country (2022-2030) ($MN)
42 Europe Cerium Oxide Nanoparticles Market Outlook, By Form (2022-2030) ($MN)
43 Europe Cerium Oxide Nanoparticles Market Outlook, By Dispersion (2022-2030) ($MN)
44 Europe Cerium Oxide Nanoparticles Market Outlook, By Powder (2022-2030) ($MN)
45 Europe Cerium Oxide Nanoparticles Market Outlook, By Application (2022-2030) ($MN)
46 Europe Cerium Oxide Nanoparticles Market Outlook, By Chemical Mechanical Planarization (CMP) (2022-2030) ($MN)
47 Europe Cerium Oxide Nanoparticles Market Outlook, By Polishing Agent (2022-2030) ($MN)
48 Europe Cerium Oxide Nanoparticles Market Outlook, By Coatings (2022-2030) ($MN)
49 Europe Cerium Oxide Nanoparticles Market Outlook, By Energy Storage (2022-2030) ($MN)
50 Europe Cerium Oxide Nanoparticles Market Outlook, By Sunscreen Cosmetics (2022-2030) ($MN)
51 Europe Cerium Oxide Nanoparticles Market Outlook, By SPF 30 (2022-2030) ($MN)
52 Europe Cerium Oxide Nanoparticles Market Outlook, By SPF 45 (2022-2030) ($MN)
53 Europe Cerium Oxide Nanoparticles Market Outlook, By SPF 50 (2022-2030) ($MN)
54 Europe Cerium Oxide Nanoparticles Market Outlook, By Catalyst (2022-2030) ($MN)
55 Europe Cerium Oxide Nanoparticles Market Outlook, By Other Applications (2022-2030) ($MN)
56 Europe Cerium Oxide Nanoparticles Market Outlook, By End User (2022-2030) ($MN)
57 Europe Cerium Oxide Nanoparticles Market Outlook, By Electronics (2022-2030) ($MN)
58 Europe Cerium Oxide Nanoparticles Market Outlook, By Automotive (2022-2030) ($MN)
59 Europe Cerium Oxide Nanoparticles Market Outlook, By Healthcare (2022-2030) ($MN)
60 Europe Cerium Oxide Nanoparticles Market Outlook, By Other End Users (2022-2030) ($MN)
61 Asia Pacific Cerium Oxide Nanoparticles Market Outlook, By Country (2022-2030) ($MN)
62 Asia Pacific Cerium Oxide Nanoparticles Market Outlook, By Form (2022-2030) ($MN)
63 Asia Pacific Cerium Oxide Nanoparticles Market Outlook, By Dispersion (2022-2030) ($MN)
64 Asia Pacific Cerium Oxide Nanoparticles Market Outlook, By Powder (2022-2030) ($MN)
65 Asia Pacific Cerium Oxide Nanoparticles Market Outlook, By Application (2022-2030) ($MN)
66 Asia Pacific Cerium Oxide Nanoparticles Market Outlook, By Chemical Mechanical Planarization (CMP) (2022-2030) ($MN)
67 Asia Pacific Cerium Oxide Nanoparticles Market Outlook, By Polishing Agent (2022-2030) ($MN)
68 Asia Pacific Cerium Oxide Nanoparticles Market Outlook, By Coatings (2022-2030) ($MN)
69 Asia Pacific Cerium Oxide Nanoparticles Market Outlook, By Energy Storage (2022-2030) ($MN)
70 Asia Pacific Cerium Oxide Nanoparticles Market Outlook, By Sunscreen Cosmetics (2022-2030) ($MN)
71 Asia Pacific Cerium Oxide Nanoparticles Market Outlook, By SPF 30 (2022-2030) ($MN)
72 Asia Pacific Cerium Oxide Nanoparticles Market Outlook, By SPF 45 (2022-2030) ($MN)
73 Asia Pacific Cerium Oxide Nanoparticles Market Outlook, By SPF 50 (2022-2030) ($MN)
74 Asia Pacific Cerium Oxide Nanoparticles Market Outlook, By Catalyst (2022-2030) ($MN)
75 Asia Pacific Cerium Oxide Nanoparticles Market Outlook, By Other Applications (2022-2030) ($MN)
76 Asia Pacific Cerium Oxide Nanoparticles Market Outlook, By End User (2022-2030) ($MN)
77 Asia Pacific Cerium Oxide Nanoparticles Market Outlook, By Electronics (2022-2030) ($MN)
78 Asia Pacific Cerium Oxide Nanoparticles Market Outlook, By Automotive (2022-2030) ($MN)
79 Asia Pacific Cerium Oxide Nanoparticles Market Outlook, By Healthcare (2022-2030) ($MN)
80 Asia Pacific Cerium Oxide Nanoparticles Market Outlook, By Other End Users (2022-2030) ($MN)
81 South America Cerium Oxide Nanoparticles Market Outlook, By Country (2022-2030) ($MN)
82 South America Cerium Oxide Nanoparticles Market Outlook, By Form (2022-2030) ($MN)
83 South America Cerium Oxide Nanoparticles Market Outlook, By Dispersion (2022-2030) ($MN)
84 South America Cerium Oxide Nanoparticles Market Outlook, By Powder (2022-2030) ($MN)
85 South America Cerium Oxide Nanoparticles Market Outlook, By Application (2022-2030) ($MN)
86 South America Cerium Oxide Nanoparticles Market Outlook, By Chemical Mechanical Planarization (CMP) (2022-2030) ($MN)
87 South America Cerium Oxide Nanoparticles Market Outlook, By Polishing Agent (2022-2030) ($MN)
88 South America Cerium Oxide Nanoparticles Market Outlook, By Coatings (2022-2030) ($MN)
89 South America Cerium Oxide Nanoparticles Market Outlook, By Energy Storage (2022-2030) ($MN)
90 South America Cerium Oxide Nanoparticles Market Outlook, By Sunscreen Cosmetics (2022-2030) ($MN)
91 South America Cerium Oxide Nanoparticles Market Outlook, By SPF 30 (2022-2030) ($MN)
92 South America Cerium Oxide Nanoparticles Market Outlook, By SPF 45 (2022-2030) ($MN)
93 South America Cerium Oxide Nanoparticles Market Outlook, By SPF 50 (2022-2030) ($MN)
94 South America Cerium Oxide Nanoparticles Market Outlook, By Catalyst (2022-2030) ($MN)
95 South America Cerium Oxide Nanoparticles Market Outlook, By Other Applications (2022-2030) ($MN)
96 South America Cerium Oxide Nanoparticles Market Outlook, By End User (2022-2030) ($MN)
97 South America Cerium Oxide Nanoparticles Market Outlook, By Electronics (2022-2030) ($MN)
98 South America Cerium Oxide Nanoparticles Market Outlook, By Automotive (2022-2030) ($MN)
99 South America Cerium Oxide Nanoparticles Market Outlook, By Healthcare (2022-2030) ($MN)
100 South America Cerium Oxide Nanoparticles Market Outlook, By Other End Users (2022-2030) ($MN)
101 Middle East & Africa Cerium Oxide Nanoparticles Market Outlook, By Country (2022-2030) ($MN)
102 Middle East & Africa Cerium Oxide Nanoparticles Market Outlook, By Form (2022-2030) ($MN)
103 Middle East & Africa Cerium Oxide Nanoparticles Market Outlook, By Dispersion (2022-2030) ($MN)
104 Middle East & Africa Cerium Oxide Nanoparticles Market Outlook, By Powder (2022-2030) ($MN)
105 Middle East & Africa Cerium Oxide Nanoparticles Market Outlook, By Application (2022-2030) ($MN)
106 Middle East & Africa Cerium Oxide Nanoparticles Market Outlook, By Chemical Mechanical Planarization (CMP) (2022-2030) ($MN)
107 Middle East & Africa Cerium Oxide Nanoparticles Market Outlook, By Polishing Agent (2022-2030) ($MN)
108 Middle East & Africa Cerium Oxide Nanoparticles Market Outlook, By Coatings (2022-2030) ($MN)
109 Middle East & Africa Cerium Oxide Nanoparticles Market Outlook, By Energy Storage (2022-2030) ($MN)
110 Middle East & Africa Cerium Oxide Nanoparticles Market Outlook, By Sunscreen Cosmetics (2022-2030) ($MN)
111 Middle East & Africa Cerium Oxide Nanoparticles Market Outlook, By SPF 30 (2022-2030) ($MN)
112 Middle East & Africa Cerium Oxide Nanoparticles Market Outlook, By SPF 45 (2022-2030) ($MN)
113 Middle East & Africa Cerium Oxide Nanoparticles Market Outlook, By SPF 50 (2022-2030) ($MN)
114 Middle East & Africa Cerium Oxide Nanoparticles Market Outlook, By Catalyst (2022-2030) ($MN)
115 Middle East & Africa Cerium Oxide Nanoparticles Market Outlook, By Other Applications (2022-2030) ($MN)
116 Middle East & Africa Cerium Oxide Nanoparticles Market Outlook, By End User (2022-2030) ($MN)
117 Middle East & Africa Cerium Oxide Nanoparticles Market Outlook, By Electronics (2022-2030) ($MN)
118 Middle East & Africa Cerium Oxide Nanoparticles Market Outlook, By Automotive (2022-2030) ($MN)
119 Middle East & Africa Cerium Oxide Nanoparticles Market Outlook, By Healthcare (2022-2030) ($MN)
120 Middle East & Africa Cerium Oxide Nanoparticles Market Outlook, By Other End Users (2022-2030) ($MN)
List of Figures
RESEARCH METHODOLOGY

We at ‘Stratistics’ opt for an extensive research approach which involves data mining, data validation, and data analysis. The various research sources include in-house repository, secondary research, competitor’s sources, social media research, client internal data, and primary research.
Our team of analysts prefers the most reliable and authenticated data sources in order to perform the comprehensive literature search. With access to most of the authenticated data bases our team highly considers the best mix of information through various sources to obtain extensive and accurate analysis.
Each report takes an average time of a month and a team of 4 industry analysts. The time may vary depending on the scope and data availability of the desired market report. The various parameters used in the market assessment are standardized in order to enhance the data accuracy.
Data Mining
The data is collected from several authenticated, reliable, paid and unpaid sources and is filtered depending on the scope & objective of the research. Our reports repository acts as an added advantage in this procedure. Data gathering from the raw material suppliers, distributors and the manufacturers is performed on a regular basis, this helps in the comprehensive understanding of the products value chain. Apart from the above mentioned sources the data is also collected from the industry consultants to ensure the objective of the study is in the right direction.
Market trends such as technological advancements, regulatory affairs, market dynamics (Drivers, Restraints, Opportunities and Challenges) are obtained from scientific journals, market related national & international associations and organizations.
Data Analysis
From the data that is collected depending on the scope & objective of the research the data is subjected for the analysis. The critical steps that we follow for the data analysis include:
- Product Lifecycle Analysis
- Competitor analysis
- Risk analysis
- Porters Analysis
- PESTEL Analysis
- SWOT Analysis
The data engineering is performed by the core industry experts considering both the Marketing Mix Modeling and the Demand Forecasting. The marketing mix modeling makes use of multiple-regression techniques to predict the optimal mix of marketing variables. Regression factor is based on a number of variables and how they relate to an outcome such as sales or profits.
Data Validation
The data validation is performed by the exhaustive primary research from the expert interviews. This includes telephonic interviews, focus groups, face to face interviews, and questionnaires to validate our research from all aspects. The industry experts we approach come from the leading firms, involved in the supply chain ranging from the suppliers, distributors to the manufacturers and consumers so as to ensure an unbiased analysis.
We are in touch with more than 15,000 industry experts with the right mix of consultants, CEO's, presidents, vice presidents, managers, experts from both supply side and demand side, executives and so on.
The data validation involves the primary research from the industry experts belonging to:
- Leading Companies
- Suppliers & Distributors
- Manufacturers
- Consumers
- Industry/Strategic Consultants
Apart from the data validation the primary research also helps in performing the fill gap research, i.e. providing solutions for the unmet needs of the research which helps in enhancing the reports quality.
For more details about research methodology, kindly write to us at info@strategymrc.com
Frequently Asked Questions
In case of any queries regarding this report, you can contact the customer service by filing the “Inquiry Before Buy” form available on the right hand side. You may also contact us through email: info@strategymrc.com or phone: +1-301-202-5929
Yes, the samples are available for all the published reports. You can request them by filling the “Request Sample” option available in this page.
Yes, you can request a sample with your specific requirements. All the customized samples will be provided as per the requirement with the real data masked.
All our reports are available in Digital PDF format. In case if you require them in any other formats, such as PPT, Excel etc you can submit a request through “Inquiry Before Buy” form available on the right hand side. You may also contact us through email: info@strategymrc.com or phone: +1-301-202-5929
We offer a free 15% customization with every purchase. This requirement can be fulfilled for both pre and post sale. You may send your customization requirements through email at info@strategymrc.com or call us on +1-301-202-5929.
We have 3 different licensing options available in electronic format.
- Single User Licence: Allows one person, typically the buyer, to have access to the ordered product. The ordered product cannot be distributed to anyone else.
- 2-5 User Licence: Allows the ordered product to be shared among a maximum of 5 people within your organisation.
- Corporate License: Allows the product to be shared among all employees of your organisation regardless of their geographical location.
All our reports are typically be emailed to you as an attachment.
To order any available report you need to register on our website. The payment can be made either through CCAvenue or PayPal payments gateways which accept all international cards.
We extend our support to 6 months post sale. A post sale customization is also provided to cover your unmet needs in the report.
Request Customization
We offer complimentary customization of up to 15% with every purchase. To share your customization requirements, feel free to email us at info@strategymrc.com or call us on +1-301-202-5929. .
Please Note: Customization within the 15% threshold is entirely free of charge. If your request exceeds this limit, we will conduct a feasibility assessment. Following that, a detailed quote and timeline will be provided.
WHY CHOOSE US ?

Assured Quality
Best in class reports with high standard of research integrity

24X7 Research Support
Continuous support to ensure the best customer experience.

Free Customization
Adding more values to your product of interest.

Safe & Secure Access
Providing a secured environment for all online transactions.

Trusted by 600+ Brands
Serving the most reputed brands across the world.