
Cooling Tower Market
Cooling Tower Market Forecasts to 2028 - Global Analysis By Type (Dry Cooling Tower, Evaporative Cooling Tower and Hybrid Cooling Tower), Material (Wood, Concrete and Other Materials), Design (Natural Draft and Mechanical Draft), Flow Type (Counterflow and Crossflow), Technology (Close Circuit, Open Circuit and Hybrid Circuit), Application, End User and By Geography

|
Years Covered |
2020-2028 |
|
Estimated Year Value (2022) |
US $2.23 BN |
|
Projected Year Value (2028) |
US $3.26 BN |
|
CAGR (2022 - 2028) |
6.5% |
|
Regions Covered |
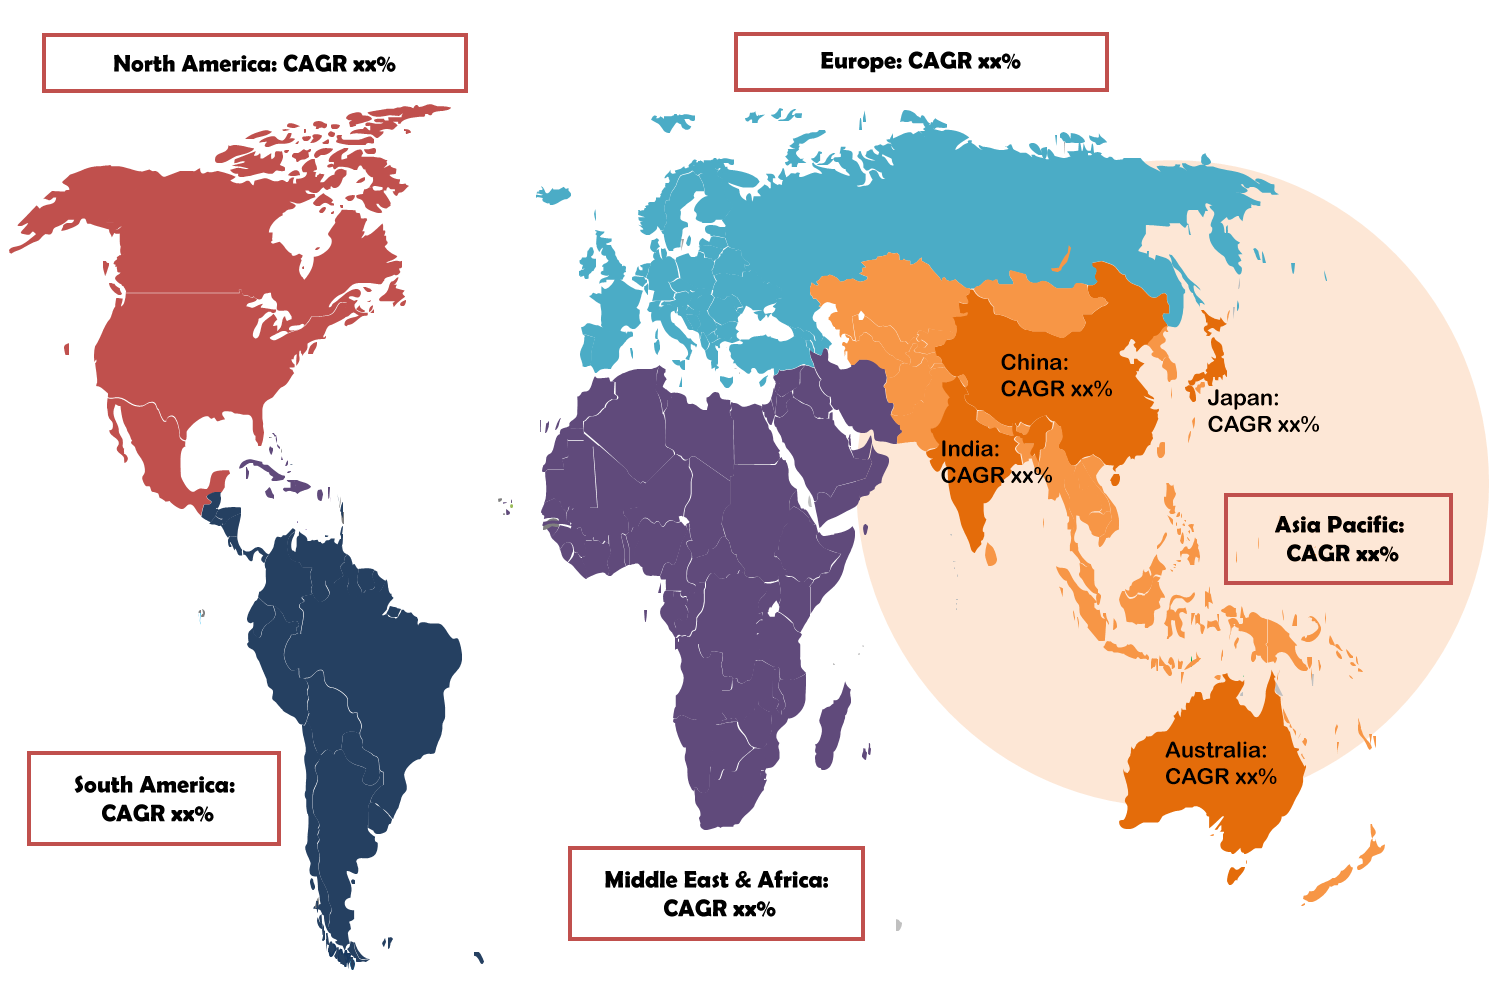
North America, Europe, Asia Pacific, South America, and Middle East & Africa |
|
Countries Covered |
US, Canada, Mexico, Germany, UK, Italy, France, Spain, Japan, China, India, Australia, New Zealand, South Korea, Rest of Asia Pacific, South America, Argentina, Brazil, Chile, Middle East & Africa, Saudi Arabia, UAE, Qatar, and South Africa |
|
Largest Market |
North America |
|
Highest Growing Market |
Asia Pacific |
According to Stratistics MRC, the Global Cooling Tower Market is accounted for $2.23 billion in 2022 and is expected to reach $3.26 billion by 2028 growing at a CAGR of 6.5% during the forecast period. A cooling tower is a mechanism that rejects waste heat to the environment by lowering the temperature of a stream of coolant, which is effectively a stream of water. These towers can either rely solely on air in the case of drying towers to cool the working liquid to the temperature of the dry bulb and then adjust temperature with radiators, or they can use the evaporation of water to remove process heat and cool the working fluid to approach the wet-bulb air temperature. The most common uses are for refrigerating the circulating water in petrochemical and other chemical industries, oil refineries, control rooms, atomic power plants, and HVAC systems for cooling buildings.
According to the Ministry of Energy India, the country is preparing to add as much as 56 GW of coal-fired generation capacity by 2030 to meet the growing electricity demand. The increase in coal-fired capacity would represent about a 25% jump above the country’s current 204 GW of coal-fueled generation from 285 coal thermal power plants.
Market Dynamics:
Driver:
Rising HVACR deployments and growth in industrial activities
The demand for cooling towers has increased as a result of rising modernity and urbanisation in emerging nations and moderate growth of the commercial construction industry globally. Increased government investments in this sector are encouraging an increase in HVACR deployments, which is further fueling market expansion. In building HVACR systems, cooling towers are frequently utilised to remove extra heat from chillers. Global demand for HVACR equipment is thus anticipated to grow, particularly in industrial and commercial environments. The usage of HVACR equipment has been promoted by elements like climate change and technical advancements. Thus, these factors are propelling the market growth, over the forecast period.
Restraint:
Sluggish market growth in Europe and North America
The cooling tower market in Europe and North America has matured and is currently seeing slow expansion. Although these regions hold a sizable portion of the market, growth over the projected period is anticipated to be less rapid than in the growing regions. An intensified focus on increasing energy efficiency and adhering to environmental standards is anticipated to be a major driver of demand in these regions. In these areas, the demand for cooling tower replacements is anticipated to increase relative to new installations. As a result, the markets in Europe and North America do not have room for new installations, leading to a slower growth rate overall.
Opportunity:
Rising demand from nuclear power generation sector
A nuclear reactor's cooling tower is a critical part. The efficiency and power output of a nuclear power plant are significantly impacted by the performance characteristics of a cooling tower. Nuclear power stations typically use cooling towers that use wet or hybrid technology. They are used in a variety of manufacturing processes where process cooling is necessary, including high pressure, high temperature applications. These are used in a variety of nuclear operations, including reheating of moisture separators, closed loop system cooling, and central cooling. Since nuclear energy is one of the most promising future energy sources, it offers a wide range of potential for the cooling towers market.
Threat:
Frequent corrosion in system results in reduced efficiency
Corrosion is caused by heavy chemicals moving through the water supply, endangering the usefulness and effectiveness of this cooling tower. Corrosion has two effects on the cooling tower system. Firstly, it causes equipment failure, which increases the cost of installation, repairs, and regular maintenance. The loss of heat transmission also results in a drop in the plant's efficiency. These elements make the expansion of this market difficult.
Covid-19 Impact
Manufacturing businesses have been severely impacted by the COVID-19 outbreak worldwide. Numerous nations have implemented nationwide lockdown as a result of the COVID-19. Due to the lockdown, employees at the production facility are not accessible. Due to a staffing shortage, manufacturing companies are unable to supply goods. In manufacturing facilities, cooling towers are utilised to remove extra heat from the system.
The mechanical draft segment is expected to be the largest during the forecast period
The mechanical draft segment is estimated to have a lucrative growth. Mechanical draft cooling towers, which pull or push air through the tower using powered fans, are the most widely used type of cooling tower for buildings. The two types of mechanical draft towers that are most frequently utilised in the HVAC sector are forced draft and induced draft. The mechanical draft is small in size and inexpensive to produce. Because of this, they are frequently utilised in the HVAC and power generation industries.
The open circuit segment is expected to have the highest CAGR during the forecast period
The open circuit segment is anticipated to witness the fastest CAGR growth during the forecast period, due to the improved cooling, lower process temperatures, and low carbon footprint provided by open-circuit cooling towers. All of these elements contribute to the rising use of open-circuit cooling towers in the refineries, cement, chemicals, commercial and residential real estate, pharmaceutical, and power generation industries. Experimental trials have shown superior cooling, lower process temperatures, and a lesser carbon footprint as the main benefits of open-circuit cooling towers.
Region with highest share:
North America is projected to hold the largest market share during the forecast period owing to the rigorous government regulations. The market in the region is benefited by government laws that limit the water consumption for cooling equipment and power producing plants. The substantial presence of well-known businesses in North America, including SPX Corporation, Babcock & Wilcox Enterprises, Inc., and EVAPCO, Inc., is also assisting the market's expansion.
Region with highest CAGR:
Asia Pacific is projected to have the highest CAGR over the forecast period, owing to The expanding infrastructure problems in China and India, as well as urbanisation, industrialization, and population increase in these nations, will all have an impact on the worldwide market in this sector. The market expansion for food and beverage items as well as energy-efficient businesses in the APAC region was driven by the region's increasing demand. New power plants were built due to the rising demand for electricity and the growing population, which fuelled the market's expansion.
Key players in the market
Some of the key players profiled in the Cooling Tower Market include ENEXIO, Thermax Limited, Baltimore Aircoil Company Inc., Nihon Spindle Manufacturing CO. LTD., Hamon & CIE, Mita Cooling Technologies SRL., Artech Cooling Towers PVT. LTD., SPX Corporation, United Metal Products, Amcot Cooling Tower Corporation, Johnson Controls, Boldrocchi T.E. SRL, Paharpur Cooling Tower Limited, Evapco, INC., Star Cooling Towers Pvt. Ltd, Tower Thermal PTY. LTD., Babcock & Wilcox Enterprises INC., Bell Cooling Tower, Brentwood Industries, INC. and Thermal Care, Inc.
Key Developments:
In July 2021, Baltimore Aircoil Company Inc. acquired Eurocoil Spa (Italy), a prominent European commercial and refrigeration manufacturer. This acquisition has further strengthened its position in the global cooling market.
In December 2020, Hamon acquired ESINDUS (Spain) engaged in the cooling business in the Iberian Peninsula, Mexico, and South America. Hamon & CIE aims to strengthen its geographic presence in Asia, EMEA, and North America through this acquisition.
Types Covered:
• Dry Cooling Tower
• Evaporative Cooling Tower
• Hybrid Cooling Tower
Materials Covered:
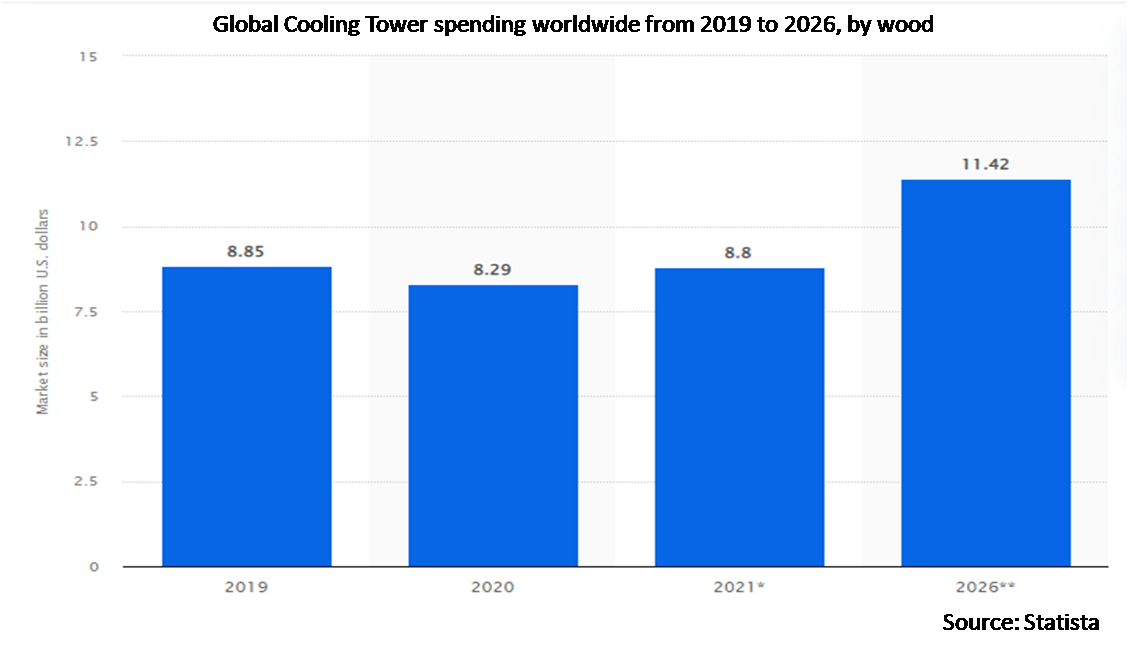
• Wood
• Concrete
• Steel
• Fibre Reinforced Polymers (FRP)
• High-Density Polyethylene (HDPE)
• Other Materials
Designs Covered:
• Natural Draft
• Mechanical Draft
Flow Types Covered:
• Counterflow
• Crossflow
Technologies Covered:
• Close Circuit
• Open Circuit
• Hybrid Circuit
Applications Covered:
• Heating, Ventilation, Air Conditioning and Refrigeration (HVACR)
• Induction Melting Steel Furances
• Refrigeration & Chilling plant
• Diesel Engine & Gas Engine
• Renewable Energy Power plant
• Cold Storage
• Oxygen Plants
• Other Applications
End Users Covered:
• Food & Beverage
• Petrochemical and Oil & Gas
• Power Generation
• Chemical
• Pharmaceutical
• Paper & Pulp
• Plastics
• Other End Users
Regions Covered:
• North America
o US
o Canada
o Mexico
• Europe
o Germany
o UK
o Italy
o France
o Spain
o Rest of Europe
• Asia Pacific
o Japan
o China
o India
o Australia
o New Zealand
o South Korea
o Rest of Asia Pacific
• South America
o Argentina
o Brazil
o Chile
o Rest of South America
• Middle East & Africa
o Saudi Arabia
o UAE
o Qatar
o South Africa
o Rest of Middle East & Africa
What our report offers:
- Market share assessments for the regional and country-level segments
- Strategic recommendations for the new entrants
- Covers Market data for the years 2020, 2021, 2022, 2025, and 2028
- Market Trends (Drivers, Constraints, Opportunities, Threats, Challenges, Investment Opportunities, and recommendations)
- Strategic recommendations in key business segments based on the market estimations
- Competitive landscaping mapping the key common trends
- Company profiling with detailed strategies, financials, and recent developments
- Supply chain trends mapping the latest technological advancements
Free Customization Offerings:
All the customers of this report will be entitled to receive one of the following free customization options:
• Company Profiling
o Comprehensive profiling of additional market players (up to 3)
o SWOT Analysis of key players (up to 3)
• Regional Segmentation
o Market estimations, Forecasts and CAGR of any prominent country as per the client's interest (Note: Depends on feasibility check)
• Competitive Benchmarking
o Benchmarking of key players based on product portfolio, geographical presence, and strategic alliances
Table of Contents
1 Executive Summary
2 Preface
2.1 Abstract
2.2 Stake Holders
2.3 Research Scope
2.4 Research Methodology
2.4.1 Data Mining
2.4.2 Data Analysis
2.4.3 Data Validation
2.4.4 Research Approach
2.5 Research Sources
2.5.1 Primary Research Sources
2.5.2 Secondary Research Sources
2.5.3 Assumptions
3 Market Trend Analysis
3.1 Introduction
3.2 Drivers
3.3 Restraints
3.4 Opportunities
3.5 Threats
3.6 Technology Analysis
3.7 Application Analysis
3.8 End User Analysis
3.9 Emerging Markets
3.10 Impact of Covid-19
4 Porters Five Force Analysis
4.1 Bargaining power of suppliers
4.2 Bargaining power of buyers
4.3 Threat of substitutes
4.4 Threat of new entrants
4.5 Competitive rivalry
5 Global Cooling Tower Market, By Type
5.1 Introduction
5.2 Dry Cooling Tower
5.3 Evaporative Cooling Tower
5.4 Hybrid Cooling Tower
6 Global Cooling Tower Market, By Material
6.1 Introduction
6.2 Wood
6.3 Concrete
6.4 Steel
6.5 Fibre Reinforced Polymers (FRP)
6.6 High-Density Polyethylene (HDPE)
6.7 Other Materials
7 Global Cooling Tower Market, By Design
7.1 Introduction
7.2 Natural Draft
7.3 Mechanical Draft
8 Global Cooling Tower Market, By Flow Type
8.1 Introduction
8.2 Counterflow
8.3 Crossflow
9 Global Cooling Tower Market, By Technology
9.1 Introduction
9.2 Close Circuit
9.3 Open Circuit
9.4 Hybrid Circuit
10 Global Cooling Tower Market, By Application
10.1 Introduction
10.2 Heating, Ventilation, Air Conditioning and Refrigeration (HVACR)
10.3 Induction Melting Steel Furances
10.4 Refrigeration & Chilling plant
10.5 Diesel Engine & Gas Engine
10.6 Renewable Energy Power plant
10.7 Cold Storage
10.8 Oxygen Plants
10.9 Other Applications
11 Global Cooling Tower Market, By End User
11.1 Introduction
11.2 Food & Beverage
11.3 Petrochemical and Oil & Gas
11.4 Power Generation
11.5 Chemical
11.6 Pharmaceutical
11.7 Paper & Pulp
11.8 Plastics
11.9 Other End Users
12 Global Cooling Tower Market, By Geography
12.1 Introduction
12.2 North America
12.2.1 US
12.2.2 Canada
12.2.3 Mexico
12.3 Europe
12.3.1 Germany
12.3.2 UK
12.3.3 Italy
12.3.4 France
12.3.5 Spain
12.3.6 Rest of Europe
12.4 Asia Pacific
12.4.1 Japan
12.4.2 China
12.4.3 India
12.4.4 Australia
12.4.5 New Zealand
12.4.6 South Korea
12.4.7 Rest of Asia Pacific
12.5 South America
12.5.1 Argentina
12.5.2 Brazil
12.5.3 Chile
12.5.4 Rest of South America
12.6 Middle East & Africa
12.6.1 Saudi Arabia
12.6.2 UAE
12.6.3 Qatar
12.6.4 South Africa
12.6.5 Rest of Middle East & Africa
13 Key Developments
13.1 Agreements, Partnerships, Collaborations and Joint Ventures
13.2 Acquisitions & Mergers
13.3 New Product Launch
13.4 Expansions
13.5 Other Key Strategies
14 Company Profiling
14.1 ENEXIO
14.2 Thermax Limited
14.3 Baltimore Aircoil Company Inc.
14.4 Nihon Spindle Manufacturing CO. LTD.
14.5 Hamon & CIE
14.6 Mita Cooling Technologies SRL.
14.7 Artech Cooling Towers PVT. LTD.
14.8 SPX Corporation
14.9 United Metal Products
14.10 Amcot Cooling Tower Corporation
14.11 Johnson Controls
14.12 Boldrocchi T.E. SRL
14.13 Paharpur Cooling Tower Limited
14.14 Evapco, INC.
14.15 Star Cooling Towers Pvt. Ltd.
14.16 Tower Thermal PTY. LTD.
14.17 Babcock & Wilcox Enterprises INC.
14.18 Bell Cooling Tower
14.19 Brentwood Industries, INC.
14.20 Thermal Care, Inc.
List of Tables
1 Global Cooling Tower Market Outlook, By Region (2020-2028) ($MN)
2 Global Cooling Tower Market Outlook, By Type (2020-2028) ($MN)
3 Global Cooling Tower Market Outlook, By Dry Cooling Tower (2020-2028) ($MN)
4 Global Cooling Tower Market Outlook, By Evaporative Cooling Tower (2020-2028) ($MN)
5 Global Cooling Tower Market Outlook, By Hybrid Cooling Tower (2020-2028) ($MN)
6 Global Cooling Tower Market Outlook, By Material (2020-2028) ($MN)
7 Global Cooling Tower Market Outlook, By Wood (2020-2028) ($MN)
8 Global Cooling Tower Market Outlook, By Concrete (2020-2028) ($MN)
9 Global Cooling Tower Market Outlook, By Steel (2020-2028) ($MN)
10 Global Cooling Tower Market Outlook, By Fibre Reinforced Polymers (FRP) (2020-2028) ($MN)
11 Global Cooling Tower Market Outlook, By High-Density Polyethylene (HDPE) (2020-2028) ($MN)
12 Global Cooling Tower Market Outlook, By Other Materials (2020-2028) ($MN)
13 Global Cooling Tower Market Outlook, By Design (2020-2028) ($MN)
14 Global Cooling Tower Market Outlook, By Natural Draft (2020-2028) ($MN)
15 Global Cooling Tower Market Outlook, By Mechanical Draft (2020-2028) ($MN)
16 Global Cooling Tower Market Outlook, By Flow Type (2020-2028) ($MN)
17 Global Cooling Tower Market Outlook, By Counterflow (2020-2028) ($MN)
18 Global Cooling Tower Market Outlook, By Crossflow (2020-2028) ($MN)
19 Global Cooling Tower Market Outlook, By Technology (2020-2028) ($MN)
20 Global Cooling Tower Market Outlook, By Close Circuit (2020-2028) ($MN)
21 Global Cooling Tower Market Outlook, By Open Circuit (2020-2028) ($MN)
22 Global Cooling Tower Market Outlook, By Hybrid Circuit (2020-2028) ($MN)
23 Global Cooling Tower Market Outlook, By Application (2020-2028) ($MN)
24 Global Cooling Tower Market Outlook, By Heating, Ventilation, Air Conditioning and Refrigeration (HVACR) (2020-2028) ($MN)
25 Global Cooling Tower Market Outlook, By Induction Melting Steel Furances (2020-2028) ($MN)
26 Global Cooling Tower Market Outlook, By Refrigeration & Chilling plant (2020-2028) ($MN)
27 Global Cooling Tower Market Outlook, By Diesel Engine & Gas Engine (2020-2028) ($MN)
28 Global Cooling Tower Market Outlook, By Renewable Energy Power plant (2020-2028) ($MN)
29 Global Cooling Tower Market Outlook, By Cold Storage (2020-2028) ($MN)
30 Global Cooling Tower Market Outlook, By Oxygen Plants (2020-2028) ($MN)
31 Global Cooling Tower Market Outlook, By Other Applications (2020-2028) ($MN)
32 Global Cooling Tower Market Outlook, By End User (2020-2028) ($MN)
33 Global Cooling Tower Market Outlook, By Food & Beverage (2020-2028) ($MN)
34 Global Cooling Tower Market Outlook, By Petrochemical and Oil & Gas (2020-2028) ($MN)
35 Global Cooling Tower Market Outlook, By Power Generation (2020-2028) ($MN)
36 Global Cooling Tower Market Outlook, By Chemical (2020-2028) ($MN)
37 Global Cooling Tower Market Outlook, By Pharmaceutical (2020-2028) ($MN)
38 Global Cooling Tower Market Outlook, By Paper & Pulp (2020-2028) ($MN)
39 Global Cooling Tower Market Outlook, By Plastics (2020-2028) ($MN)
40 Global Cooling Tower Market Outlook, By Other End Users (2020-2028) ($MN)
Note: Tables for North America, Europe, APAC, South America, and Middle East & Africa Regions are also represented in the same manner as above.
List of Figures
RESEARCH METHODOLOGY

We at ‘Stratistics’ opt for an extensive research approach which involves data mining, data validation, and data analysis. The various research sources include in-house repository, secondary research, competitor’s sources, social media research, client internal data, and primary research.
Our team of analysts prefers the most reliable and authenticated data sources in order to perform the comprehensive literature search. With access to most of the authenticated data bases our team highly considers the best mix of information through various sources to obtain extensive and accurate analysis.
Each report takes an average time of a month and a team of 4 industry analysts. The time may vary depending on the scope and data availability of the desired market report. The various parameters used in the market assessment are standardized in order to enhance the data accuracy.
Data Mining
The data is collected from several authenticated, reliable, paid and unpaid sources and is filtered depending on the scope & objective of the research. Our reports repository acts as an added advantage in this procedure. Data gathering from the raw material suppliers, distributors and the manufacturers is performed on a regular basis, this helps in the comprehensive understanding of the products value chain. Apart from the above mentioned sources the data is also collected from the industry consultants to ensure the objective of the study is in the right direction.
Market trends such as technological advancements, regulatory affairs, market dynamics (Drivers, Restraints, Opportunities and Challenges) are obtained from scientific journals, market related national & international associations and organizations.
Data Analysis
From the data that is collected depending on the scope & objective of the research the data is subjected for the analysis. The critical steps that we follow for the data analysis include:
- Product Lifecycle Analysis
- Competitor analysis
- Risk analysis
- Porters Analysis
- PESTEL Analysis
- SWOT Analysis
The data engineering is performed by the core industry experts considering both the Marketing Mix Modeling and the Demand Forecasting. The marketing mix modeling makes use of multiple-regression techniques to predict the optimal mix of marketing variables. Regression factor is based on a number of variables and how they relate to an outcome such as sales or profits.
Data Validation
The data validation is performed by the exhaustive primary research from the expert interviews. This includes telephonic interviews, focus groups, face to face interviews, and questionnaires to validate our research from all aspects. The industry experts we approach come from the leading firms, involved in the supply chain ranging from the suppliers, distributors to the manufacturers and consumers so as to ensure an unbiased analysis.
We are in touch with more than 15,000 industry experts with the right mix of consultants, CEO's, presidents, vice presidents, managers, experts from both supply side and demand side, executives and so on.
The data validation involves the primary research from the industry experts belonging to:
- Leading Companies
- Suppliers & Distributors
- Manufacturers
- Consumers
- Industry/Strategic Consultants
Apart from the data validation the primary research also helps in performing the fill gap research, i.e. providing solutions for the unmet needs of the research which helps in enhancing the reports quality.
For more details about research methodology, kindly write to us at info@strategymrc.com
Frequently Asked Questions
In case of any queries regarding this report, you can contact the customer service by filing the “Inquiry Before Buy” form available on the right hand side. You may also contact us through email: info@strategymrc.com or phone: +1-301-202-5929
Yes, the samples are available for all the published reports. You can request them by filling the “Request Sample” option available in this page.
Yes, you can request a sample with your specific requirements. All the customized samples will be provided as per the requirement with the real data masked.
All our reports are available in Digital PDF format. In case if you require them in any other formats, such as PPT, Excel etc you can submit a request through “Inquiry Before Buy” form available on the right hand side. You may also contact us through email: info@strategymrc.com or phone: +1-301-202-5929
We offer a free 15% customization with every purchase. This requirement can be fulfilled for both pre and post sale. You may send your customization requirements through email at info@strategymrc.com or call us on +1-301-202-5929.
We have 3 different licensing options available in electronic format.
- Single User Licence: Allows one person, typically the buyer, to have access to the ordered product. The ordered product cannot be distributed to anyone else.
- 2-5 User Licence: Allows the ordered product to be shared among a maximum of 5 people within your organisation.
- Corporate License: Allows the product to be shared among all employees of your organisation regardless of their geographical location.
All our reports are typically be emailed to you as an attachment.
To order any available report you need to register on our website. The payment can be made either through CCAvenue or PayPal payments gateways which accept all international cards.
We extend our support to 6 months post sale. A post sale customization is also provided to cover your unmet needs in the report.
Request Customization
We offer complimentary customization of up to 15% with every purchase. To share your customization requirements, feel free to email us at info@strategymrc.com or call us on +1-301-202-5929. .
Please Note: Customization within the 15% threshold is entirely free of charge. If your request exceeds this limit, we will conduct a feasibility assessment. Following that, a detailed quote and timeline will be provided.
WHY CHOOSE US ?

Assured Quality
Best in class reports with high standard of research integrity

24X7 Research Support
Continuous support to ensure the best customer experience.

Free Customization
Adding more values to your product of interest.

Safe & Secure Access
Providing a secured environment for all online transactions.

Trusted by 600+ Brands
Serving the most reputed brands across the world.