
Desktop Virtualization Market
Desktop Virtualization Market Forecasts to 2028 - Global Analysis By Type (Desktop-as-a-service (DaaS), Remote Desktop Services (RDS) and Other Types), Organization Size (Large Enterprises and Small and Medium Sized Enterprises), Offering (Service and Solution), Deployment Mode (Cloud and On-Premise), Desktop Delivery Platform, End User, Pricing Model and By Geography

|
Years Covered |
2020-2028 |
|
Estimated Year Value (2022) |
US $12.3 BN |
|
Projected Year Value (2028) |
US $24.6 BN |
|
CAGR (2022 - 2028) |
12.3% |
|
Regions Covered |
North America, Europe, Asia Pacific, South America, and Middle East & Africa |
|
Countries Covered |
US, Canada, Mexico, Germany, UK, Italy, France, Spain, Japan, China, India, Australia, New Zealand, South Korea, Rest of Asia Pacific, South America, Argentina, Brazil, Chile, Middle East & Africa, Saudi Arabia, UAE, Qatar, and South Africa |
|
Largest Market |
North America |
|
Highest Growing Market |
Asia Pacific |
According to Stratistics MRC, the Global Desktop Virtualization Market is accounted for $12.3 billion in 2022 and is expected to reach $24.6 billion by 2028 growing at a CAGR of 12.3% during the forecast period. Desktop virtualization is a software technology used to imitate a workstation environment and access desktop computers through a linked device that is either local to the user or located remotely. Client software that is installed on the endpoint is typically used to access virtual desktops, allowing users to interact and enter data using a local mouse, keyboard, Touchscreen, and other peripheral devices. This helps to improve both the security and effectiveness of the actions carried out while reducing the overall computing strain placed on local users.
According to an article published by Search Virtual Desktop Blogs, in March 2020, the global spending on virtual desktop infrastructure was $4.91 billion in the year 2019, which is anticipated to grow with an average of 14.4%, post the outbreak of the COVID-19 pandemic.
Market Dynamics:
Driver:
Cost savings to reduce economic pressure on enterprises
Businesses are being compelled to embrace enterprise solutions, which help to reduce IT spending and concentrate on core business areas, by the increasingly competitive market and economic pressure. Several small and medium-sized businesses (SMBs), are transitioning from conventional desktop systems to virtual desktop workplaces in addition to large businesses. By giving workers a consistent and secure way to work from any location, VDI helps businesses cut back on the number of PCs and expensive hardware that need to maintain. As a result, desktop virtualization solutions will see widespread adoption in the coming years, since they enable organisations to cut expenditures on hardware and its upkeep.
Restraint:
System complexity and compatibility issues
Although desktop virtualization has many technological benefits, putting it into practise is a difficult task. A highly compatible infrastructure and software setup are necessary for creating many virtual desktop instances, and meeting these needs could be expensive, difficult, and need substantial preparation. Additionally, since all desktops and the operating system are virtually loaded and streamed across the network, virtual desktops demand a sizeable amount of network bandwidth. Therefore, system complexity and compatibility problems are preventing more desktop virtualization solutions from being employed.
Opportunity:
Shift toward remote working and rise in the adoption of cloud computing
To increase the effectiveness and productivity of their employees, businesses are focused on remote working. The cost of IT infrastructure is reduced via remote working and cloud computing. The emergence of clouds as an infrastructure has made it possible to supply computing resources quickly as a utility in a dynamically scaled and virtual way. The use of desktop virtualization is driven by an increase in cloud adoption and an organisational preference for cloud-based desktop deployment.
Threat:
Lack of skilled personnel
Desktop virtualization configuration and implementation are difficult processes since they include many intricacies and compatibility problems. Before implementing desktop virtualization solutions, it is necessary to assess the infrastructure requirements, including server size, network bandwidth, and workload. Sometimes, a user tries to implement a desktop virtualization solution on the existing infrastructure while making compromises regarding the necessary infrastructure configuration, which could further impair the performance of the implemented solution. In order to implement and reconfigure desktop virtualization solutions, manufacturers must train virtualization professionals that have up-to-date knowledge and a sufficient degree of abilities. Currently, there is a shortage of qualified workers on the market.
Covid-19 Impact
VDI, or virtual desktop infrastructure, is not a new idea. However, the COVID-19 pandemic has made VDI a public issue, and 2020 has been the year that this technology gained widespread usage. Although the pandemic has impacted almost every industry in the world, VDI adoption has been phenomenal as more and more businesses transition their entire workflow to remote working. Some businesses were compelled to quickly adjust and set up the necessary computing infrastructure for remote workers after the widespread shutdown to stop the corona virus’s spread. Since it has become obvious that VDI solutions make sense, businesses have used them extensively.
The large enterprises segment is expected to be the largest during the forecast period
The large enterprises segment is estimated to have a lucrative growth, due to the advantages offered by these technologies, which include a reduction in energy consumption, security risks, and replacement rates, all of which lead to cheap ownership costs and excellent returns on investments. Additionally, these technologies provide centralised management of hardware, software, and applications, which boosts utilisation and lowers management costs.
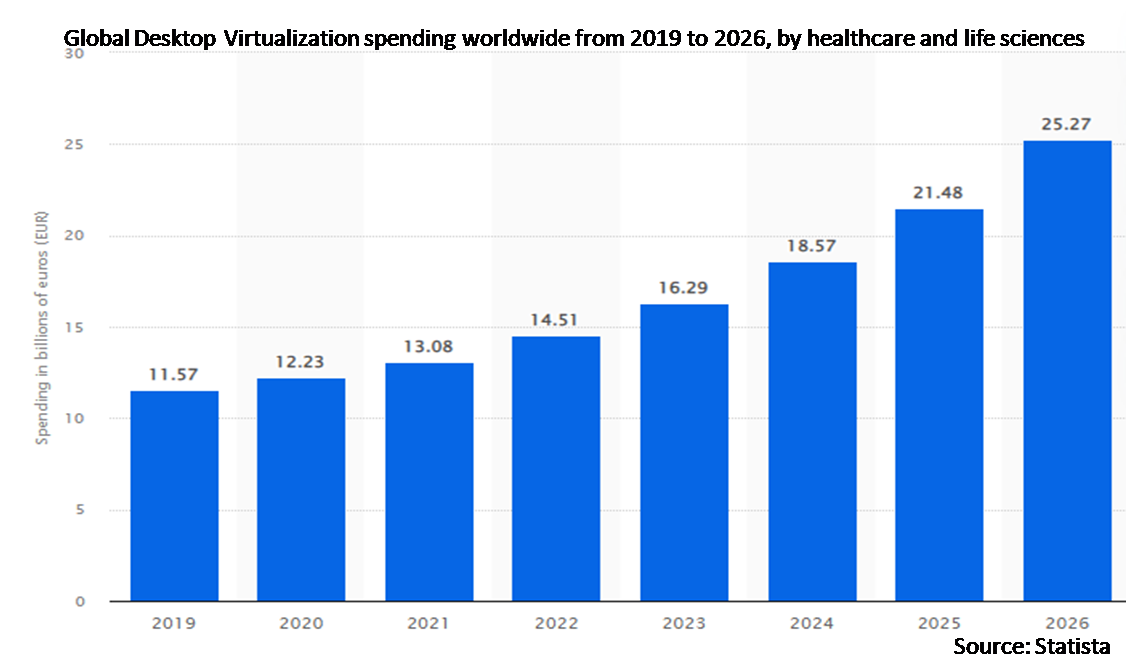
The healthcare and life sciences segment is expected to have the highest CAGR during the forecast period
The healthcare and life sciences segment is anticipated to witness the highest CAGR growth during the forecast period. The desktop virtualization has improved the healthcare industry as a whole by giving medical practitioners speedy, safe access to patient data whenever and wherever they need it. This has assisted them in overcoming all the conventional difficulties experienced by the sector in maintaining patients' paper records and giving them access to electronic medical records.
Region with highest share:
North America is projected to hold the largest market share during the forecast period owing to its achievements in digital and cloud technology. Additionally, the existence of significant suppliers and increased government support for regulatory compliance are the main drivers of the industry's growth. The market expansion in the region is further fuelled by the increasing acceptance of desktop virtualization solutions across end-user industries, including BFSI, IT & telecom, manufacturing, and others.
Region with highest CAGR:
Asia Pacific is projected to have the highest CAGR over the forecast period, owing to the increasing number of start-ups in the area. The adoption of desktop virtualization technologies has a great potential in the region's emerging economies, including China, India, Japan, and South Korea. These nations are experiencing significant economic expansion.

Key players in the market
Some of the key players profiled in the Desktop Virtualization Market include VMware, Citrix Systems, Oracle, Microsoft, Huawei, IBM, Cisco Systems, AWS, KYNDRYL Holdings, NTT Data, DXC Technology, SOFTCHOICE, Hewlett Packard Enterprise (HPE), Pure Storage and Amazon Web services Inc.
Key Developments:
In February 2022, IBM acquired Neudesic, a leading Microsoft Azure Consultancy, to expand IBM's portfolio of hybrid multicloud services and influence the company's hybrid cloud and AI strategy.
In November 2021, VMware and Vodafone partnered. The partnership aims to deploy the full VMware Telco Cloud Platform in all European markets. In addition to utilizing Telco Cloud Infrastructure for NFV, Vodafone will access VMware Tanzu for Telco and VMware Telco Cloud Automation.
In July 2021, Cisco acquired Socio Labs. The acquisition would expand Webex offerings beyond meetings, webinars, and webcasts; would include conferences; and would add power to the future of hybrid events.
In March 2021, Amazon Web Services launched an AWS Solution Consulting offer, Virtual Desktop Accelerator. It is supported by consulting engagement from RedNight Consulting. Virtual Desktop Accelerator will speed up Amazon WorkSpaces deployment.
Types Covered:
• Desktop-as-a-service (DaaS)
• Remote Desktop Services (RDS)
• Virtual Desktop Infrastructure (VDI)
• Other Types
Organization Sizes Covered:
• Large Enterprises
• Small and Medium Sized Enterprises
Offerings Covered:
• Service
• Solution
Deployment Modes Covered:
• Cloud
• On-Premise
Desktop Delivery Platforms Covered:
• Hosted Shared Desktop (HSD)
• Hosted Virtual Desktop (HVD)
• Other Desktop Delivery Forms
End Users Covered:
• Healthcare and Life Sciences
• Automotive, Transportation and Logistics
• Education
• Construction & Manufacturing
• Government and Defense
• Media and Entertainment
• Retail
• Banking, Finance services, and Insurance (BFSI)
• IT and ITeS
• Telecom
• Other End Users
Pricing Models Covered:
• Subscription
• Pay-as-You-Go
Regions Covered:
• North America
o US
o Canada
o Mexico
• Europe
o Germany
o UK
o Italy
o France
o Spain
o Rest of Europe
• Asia Pacific
o Japan
o China
o India
o Australia
o New Zealand
o South Korea
o Rest of Asia Pacific
• South America
o Argentina
o Brazil
o Chile
o Rest of South America
• Middle East & Africa
o Saudi Arabia
o UAE
o Qatar
o South Africa
o Rest of Middle East & Africa
What our report offers:
- Market share assessments for the regional and country-level segments
- Strategic recommendations for the new entrants
- Covers Market data for the years 2020, 2021, 2022, 2025, and 2028
- Market Trends (Drivers, Constraints, Opportunities, Threats, Challenges, Investment Opportunities, and recommendations)
- Strategic recommendations in key business segments based on the market estimations
- Competitive landscaping mapping the key common trends
- Company profiling with detailed strategies, financials, and recent developments
- Supply chain trends mapping the latest technological advancements
Free Customization Offerings:
All the customers of this report will be entitled to receive one of the following free customization options:
• Company Profiling
o Comprehensive profiling of additional market players (up to 3)
o SWOT Analysis of key players (up to 3)
• Regional Segmentation
o Market estimations, Forecasts and CAGR of any prominent country as per the client's interest (Note: Depends on feasibility check)
• Competitive Benchmarking
o Benchmarking of key players based on product portfolio, geographical presence, and strategic alliances
Table of Contents
1 Executive Summary
2 Preface
2.1 Abstract
2.2 Stake Holders
2.3 Research Scope
2.4 Research Methodology
2.4.1 Data Mining
2.4.2 Data Analysis
2.4.3 Data Validation
2.4.4 Research Approach
2.5 Research Sources
2.5.1 Primary Research Sources
2.5.2 Secondary Research Sources
2.5.3 Assumptions
3 Market Trend Analysis
3.1 Introduction
3.2 Drivers
3.3 Restraints
3.4 Opportunities
3.5 Threats
3.6 End User Analysis
3.7 Emerging Markets
3.8 Impact of Covid-19
4 Porters Five Force Analysis
4.1 Bargaining power of suppliers
4.2 Bargaining power of buyers
4.3 Threat of substitutes
4.4 Threat of new entrants
4.5 Competitive rivalry
5 Global Desktop Virtualization Market, By Type
5.1 Introduction
5.2 Desktop-as-a-service (DaaS)
5.3 Remote Desktop Services (RDS)
5.4 Virtual Desktop Infrastructure (VDI)
5.5 Other Types
6 Global Desktop Virtualization Market, By Organization Size
6.1 Introduction
6.2 Large Enterprises
6.3 Small and Medium Sized Enterprises
7 Global Desktop Virtualization Market, By Offering
7.1 Introduction
7.2 Service
7.3 Solution
8 Global Desktop Virtualization Market, By Deployment Mode
8.1 Introduction
8.2 Cloud
8.3 On-Premise
9 Global Desktop Virtualization Market, By Desktop Delivery Platform
9.1 Introduction
9.2 Hosted Shared Desktop (HSD)
9.3 Hosted Virtual Desktop (HVD)
9.4 Other Desktop Delivery Forms
10 Global Desktop Virtualization Market, By End User
10.1 Introduction
10.2 Healthcare and Life Sciences
10.3 Automotive, Transportation and Logistics
10.4 Education
10.4.1 Academic Institutions
10.4.2 Enterprises
10.5 Construction & Manufacturing
10.6 Government and Defense
10.7 Media and Entertainment
10.8 Retail
10.9 Banking, Finance services, and Insurance (BFSI)
10.10 IT and ITeS
10.11 Telecom
10.12 Other End Users
11 Global Desktop Virtualization Market, By Pricing Model
11.1 Introduction
11.2 Subscription
11.3 Pay-as-You-Go
12 Global Desktop Virtualization Market, By Geography
12.1 Introduction
12.2 North America
12.2.1 US
12.2.2 Canada
12.2.3 Mexico
12.3 Europe
12.3.1 Germany
12.3.2 UK
12.3.3 Italy
12.3.4 France
12.3.5 Spain
12.3.6 Rest of Europe
12.4 Asia Pacific
12.4.1 Japan
12.4.2 China
12.4.3 India
12.4.4 Australia
12.4.5 New Zealand
12.4.6 South Korea
12.4.7 Rest of Asia Pacific
12.5 South America
12.5.1 Argentina
12.5.2 Brazil
12.5.3 Chile
12.5.4 Rest of South America
12.6 Middle East & Africa
12.6.1 Saudi Arabia
12.6.2 UAE
12.6.3 Qatar
12.6.4 South Africa
12.6.5 Rest of Middle East & Africa
13 Key Developments
13.1 Agreements, Partnerships, Collaborations and Joint Ventures
13.2 Acquisitions & Mergers
13.3 New Product Launch
13.4 Expansions
13.5 Other Key Strategies
14 Company Profiling
14.1 VMware
14.2 Citrix Systems
14.3 Oracle
14.4 Microsoft
14.5 Huawei
14.6 IBM
14.7 Cisco Systems
14.8 AWS
14.9 KYNDRYL Holdings
14.10 NTT Data
14.11 DXC Technology
14.12 SOFTCHOICE
14.13 Hewlett Packard Enterprise (HPE)
14.14 Pure Storage
14.15 Amazon Web services Inc.
List of Tables
1 Global Desktop Virtualization Market Outlook, By Region (2020-2028) ($MN)
2 Global Desktop Virtualization Market Outlook, By Type (2020-2028) ($MN)
3 Global Desktop Virtualization Market Outlook, By Desktop-as-a-service (DaaS) (2020-2028) ($MN)
4 Global Desktop Virtualization Market Outlook, By Remote Desktop Services (RDS) (2020-2028) ($MN)
5 Global Desktop Virtualization Market Outlook, By Virtual Desktop Infrastructure (VDI) (2020-2028) ($MN)
6 Global Desktop Virtualization Market Outlook, By Other Types (2020-2028) ($MN)
7 Global Desktop Virtualization Market Outlook, By Organization Size (2020-2028) ($MN)
8 Global Desktop Virtualization Market Outlook, By Large Enterprises (2020-2028) ($MN)
9 Global Desktop Virtualization Market Outlook, By Small and Medium Sized Enterprises (2020-2028) ($MN)
10 Global Desktop Virtualization Market Outlook, By Offering (2020-2028) ($MN)
11 Global Desktop Virtualization Market Outlook, By Service (2020-2028) ($MN)
12 Global Desktop Virtualization Market Outlook, By Solution (2020-2028) ($MN)
13 Global Desktop Virtualization Market Outlook, By Deployment Mode (2020-2028) ($MN)
14 Global Desktop Virtualization Market Outlook, By Cloud (2020-2028) ($MN)
15 Global Desktop Virtualization Market Outlook, By On-Premise (2020-2028) ($MN)
16 Global Desktop Virtualization Market Outlook, By Desktop Delivery Platform (2020-2028) ($MN)
17 Global Desktop Virtualization Market Outlook, By Hosted Shared Desktop (HSD) (2020-2028) ($MN)
18 Global Desktop Virtualization Market Outlook, By Hosted Virtual Desktop (HVD) (2020-2028) ($MN)
19 Global Desktop Virtualization Market Outlook, By Other Desktop Delivery Forms (2020-2028) ($MN)
20 Global Desktop Virtualization Market Outlook, By End User (2020-2028) ($MN)
21 Global Desktop Virtualization Market Outlook, By Healthcare and Life Sciences (2020-2028) ($MN)
22 Global Desktop Virtualization Market Outlook, By Automotive, Transportation and Logistics (2020-2028) ($MN)
23 Global Desktop Virtualization Market Outlook, By Education (2020-2028) ($MN)
24 Global Desktop Virtualization Market Outlook, By Academic Institutions (2020-2028) ($MN)
25 Global Desktop Virtualization Market Outlook, By Enterprises (2020-2028) ($MN)
26 Global Desktop Virtualization Market Outlook, By Construction & Manufacturing (2020-2028) ($MN)
27 Global Desktop Virtualization Market Outlook, By Government and Defense (2020-2028) ($MN)
28 Global Desktop Virtualization Market Outlook, By Media and Entertainment (2020-2028) ($MN)
29 Global Desktop Virtualization Market Outlook, By Retail (2020-2028) ($MN)
30 Global Desktop Virtualization Market Outlook, By Banking, Finance services, and Insurance (BFSI) (2020-2028) ($MN)
31 Global Desktop Virtualization Market Outlook, By IT and ITeS (2020-2028) ($MN)
32 Global Desktop Virtualization Market Outlook, By Telecom (2020-2028) ($MN)
33 Global Desktop Virtualization Market Outlook, By Other End Users (2020-2028) ($MN)
34 Global Desktop Virtualization Market Outlook, By Pricing Model (2020-2028) ($MN)
35 Global Desktop Virtualization Market Outlook, By Subscription (2020-2028) ($MN)
36 Global Desktop Virtualization Market Outlook, By Pay-as-You-Go (2020-2028) ($MN)
Note: Tables for North America, Europe, APAC, South America, and Middle East & Africa Regions are also represented in the same manner as above.
List of Figures
RESEARCH METHODOLOGY

We at ‘Stratistics’ opt for an extensive research approach which involves data mining, data validation, and data analysis. The various research sources include in-house repository, secondary research, competitor’s sources, social media research, client internal data, and primary research.
Our team of analysts prefers the most reliable and authenticated data sources in order to perform the comprehensive literature search. With access to most of the authenticated data bases our team highly considers the best mix of information through various sources to obtain extensive and accurate analysis.
Each report takes an average time of a month and a team of 4 industry analysts. The time may vary depending on the scope and data availability of the desired market report. The various parameters used in the market assessment are standardized in order to enhance the data accuracy.
Data Mining
The data is collected from several authenticated, reliable, paid and unpaid sources and is filtered depending on the scope & objective of the research. Our reports repository acts as an added advantage in this procedure. Data gathering from the raw material suppliers, distributors and the manufacturers is performed on a regular basis, this helps in the comprehensive understanding of the products value chain. Apart from the above mentioned sources the data is also collected from the industry consultants to ensure the objective of the study is in the right direction.
Market trends such as technological advancements, regulatory affairs, market dynamics (Drivers, Restraints, Opportunities and Challenges) are obtained from scientific journals, market related national & international associations and organizations.
Data Analysis
From the data that is collected depending on the scope & objective of the research the data is subjected for the analysis. The critical steps that we follow for the data analysis include:
- Product Lifecycle Analysis
- Competitor analysis
- Risk analysis
- Porters Analysis
- PESTEL Analysis
- SWOT Analysis
The data engineering is performed by the core industry experts considering both the Marketing Mix Modeling and the Demand Forecasting. The marketing mix modeling makes use of multiple-regression techniques to predict the optimal mix of marketing variables. Regression factor is based on a number of variables and how they relate to an outcome such as sales or profits.
Data Validation
The data validation is performed by the exhaustive primary research from the expert interviews. This includes telephonic interviews, focus groups, face to face interviews, and questionnaires to validate our research from all aspects. The industry experts we approach come from the leading firms, involved in the supply chain ranging from the suppliers, distributors to the manufacturers and consumers so as to ensure an unbiased analysis.
We are in touch with more than 15,000 industry experts with the right mix of consultants, CEO's, presidents, vice presidents, managers, experts from both supply side and demand side, executives and so on.
The data validation involves the primary research from the industry experts belonging to:
- Leading Companies
- Suppliers & Distributors
- Manufacturers
- Consumers
- Industry/Strategic Consultants
Apart from the data validation the primary research also helps in performing the fill gap research, i.e. providing solutions for the unmet needs of the research which helps in enhancing the reports quality.
For more details about research methodology, kindly write to us at info@strategymrc.com
Frequently Asked Questions
In case of any queries regarding this report, you can contact the customer service by filing the “Inquiry Before Buy” form available on the right hand side. You may also contact us through email: info@strategymrc.com or phone: +1-301-202-5929
Yes, the samples are available for all the published reports. You can request them by filling the “Request Sample” option available in this page.
Yes, you can request a sample with your specific requirements. All the customized samples will be provided as per the requirement with the real data masked.
All our reports are available in Digital PDF format. In case if you require them in any other formats, such as PPT, Excel etc you can submit a request through “Inquiry Before Buy” form available on the right hand side. You may also contact us through email: info@strategymrc.com or phone: +1-301-202-5929
We offer a free 15% customization with every purchase. This requirement can be fulfilled for both pre and post sale. You may send your customization requirements through email at info@strategymrc.com or call us on +1-301-202-5929.
We have 3 different licensing options available in electronic format.
- Single User Licence: Allows one person, typically the buyer, to have access to the ordered product. The ordered product cannot be distributed to anyone else.
- 2-5 User Licence: Allows the ordered product to be shared among a maximum of 5 people within your organisation.
- Corporate License: Allows the product to be shared among all employees of your organisation regardless of their geographical location.
All our reports are typically be emailed to you as an attachment.
To order any available report you need to register on our website. The payment can be made either through CCAvenue or PayPal payments gateways which accept all international cards.
We extend our support to 6 months post sale. A post sale customization is also provided to cover your unmet needs in the report.
Request Customization
We offer complimentary customization of up to 15% with every purchase. To share your customization requirements, feel free to email us at info@strategymrc.com or call us on +1-301-202-5929. .
Please Note: Customization within the 15% threshold is entirely free of charge. If your request exceeds this limit, we will conduct a feasibility assessment. Following that, a detailed quote and timeline will be provided.
WHY CHOOSE US ?

Assured Quality
Best in class reports with high standard of research integrity

24X7 Research Support
Continuous support to ensure the best customer experience.

Free Customization
Adding more values to your product of interest.

Safe & Secure Access
Providing a secured environment for all online transactions.

Trusted by 600+ Brands
Serving the most reputed brands across the world.