
Electric Fuse Market
Electric Fuse Market Forecasts to 2028 - Global Analysis By Type (Distribution Cutouts, Power Fuse and Fuse Links and Other Types), Voltage (Low Voltage, Medium Voltage and High Voltage), Current Rating (<500A, 500A-2000A, 2000-4000A and >4000A), Application (Commercial, Residential and Other Applications), End User and Geography

|
Years Covered |
2020-2028 |
|
Estimated Year Value (2022) |
US $3.77 BN |
|
Projected Year Value (2028) |
US $5.92 BN |
|
CAGR (2022 - 2028) |
7.8% |
|
Regions Covered |
North America, Europe, Asia Pacific, South America, and Middle East & Africa |
|
Countries Covered |
US, Canada, Mexico, Germany, UK, Italy, France, Spain, Japan, China, India, Australia, New Zealand, South Korea, Rest of Asia Pacific, South America, Argentina, Brazil, Chile, Middle East & Africa, Saudi Arabia, UAE, Qatar, and South Africa |
|
Largest Market |
Asia Pacific |
|
Highest Growing Market |
North America |
According to Stratistics MRC, the Global Electric Fuse Market is accounted for $3.77 billion in 2022 and is expected to reach $5.92 billion by 2028 growing at a CAGR of 7.8% during the forecast period. A fuse is a type of electrical device used to guard against high current flow in electrical components. If there is an unneeded increase in the current flow, the fuse melts and separates. In high voltage and low voltage installations, it is utilised for overload and short circuit safety. Electrical fuses have a number of benefits, including no maintenance requirements, shorter working times than circuit breakers, and the ability to interrupt short circuit current without making a sound or producing smoke. An essential component of the system used in electricity infrastructure is the electric fuse.
According to the World Energy Report 2018, electricity generation increased by 2.8% in the last ten years, with emerging economies accounting for about 94% of the increase. According to the World Energy Council, at least 2,000 GW of new power producing capacity is required globally, with an additional 1,000 GW necessary to replace outdated infrastructure within the next decade.
Market Dynamics:
Driver:
Increasing electrification of different industries
The operation of mechanical drives, boilers, furnaces, heating, ventilation, and air-conditioning (HVAC) systems, etc., requires a lot of fuel and electricity, which is why industries require it. Traditional energy sources included those utilised by IC engines, furnaces, and boilers powered by fossil fuels, among others. Industries are electrifying more and more to transition to a low-carbon future and to guarantee reliable operations. This trend is more pronounced in developed places where national governments are actively working toward carbon-neutral objectives. To secure economic savings, industries have been electrifying themselves in other places as well, leading to increasing investments in the process. Companies can achieve sustainability objectives while lowering their energy and overhead costs by electrifying.
Restraint:
Surging demand for substitutes
Electric fuses have historically been a crucial component of circuit protection machinery in end-user industries. In the low-voltage market, however, there has been a noticeable shift in end users from residential and commercial settings from electric fuses to MCBs and MCCBs because these circuit protection devices are more dependable, reusable, safe, sensitive, and have a better interface with no need for manual intervention. Due to their higher reliability and automation capabilities, circuit breakers and protective relays are replacing electric fuses in the medium-voltage segment's existing infrastructures. Across all areas and plants, this has been the general trend. Since most companies are automating their processes, there is a high demand for intelligent devices like MCBs, MCCBs, and relays. Over the course of the projection period, this automation trend is projected to constrain demand for electric fuses worldwide.
Opportunity:
Upgrading of existing substations and feeder line protection
The current power grid will certainly experience stress if planned power generation capacities aren't increased and modernised. According to the World Energy Council, at least 2,000 GW of additional power generating capacity is needed globally, and another 1,000 GW will be required within the next ten years to replace the deteriorating infrastructure. These capacity increases call for brand-new, improved, and enlarged T&D infrastructures. Many affluent countries' current power infrastructures need to be improved because they are largely outdated. In order to safeguard feeder and distribution lines against transient short circuits that could result in protracted power outages and guarantee customers' reliable supply continuity, electric fuses are primarily installed in medium-voltage substations.
Threat:
Delays in grid expansion projects
A large amount of data is necessary for the planning and design of the equipment for a power supply network. Grid expansion projects are delayed by factors like political interference, environmental clearances, and drawn-out government approval processes. Numerous transmission and distribution projects have been examined for historical trends on 5- and 10-year network development plans. It has been noted that certain facilities that were scheduled for commissioning are still in the planning and approval stages. These delays increase the amount of time needed to complete grid expansion projects while lowering demand for electric fuses. For manufacturers of electric fuses, production planning is extremely difficult due to the delays in grid expansion projects.
Covid-19 Impact
The new coronavirus has had a significant negative impact on the growth of the electronic industry. Governments had to close a number of electronics production facilities and retail locations due to the global lockdown in order to stop the virus from spreading. Additionally, the lockout has decreased discretionary income, which further decreased consumer desire for devices. The manufacturing and sales channels have also experienced challenges as a result of supply chain disruptions. The demand for electronic gadgets is predicted to decline further as a result.
The low voltage segment is expected to be the largest during the forecast period
The low voltage segment is estimated to have a lucrative growth, due to their high appropriateness for a wide range of uses, mostly in electronics and automobiles. The penetration of the device will be boosted by its ability to reliably protect electrical installations and signal circuits against overload situations and short circuit current. The continued development of electric mobility has increased the use of comfort features such autonomous controls, air conditioners, and a variety of onboard devices, which will drastically change the industry landscape.
The automotive segment is expected to have the highest CAGR during the forecast period
The automotive segment is anticipated to witness the fastest CAGR growth during the forecast period, due to the increasing electrification of passenger and commercial vehicles as well as the increased concentration of automakers on cutting-edge propulsion technologies, the automotive electric fuse market will experience significant penetration. Circuit shrinking and the growing complexity of car electronics will create favourable business conditions. In addition, improvements in battery chemistry, increased manufacturing capacity, and incentives for low- and zero-emission vehicles will all contribute to the growth of the electric vehicle market and boost product demand.
Region with highest share:
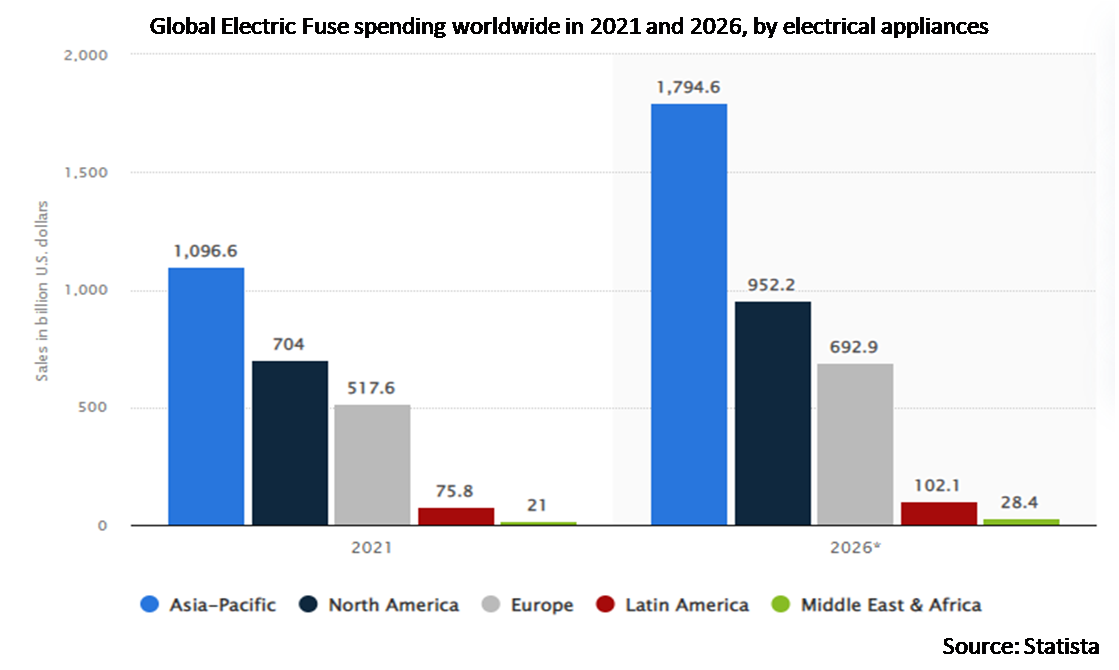
Asia Pacific is projected to hold the largest market share during the forecast period owing to rising per capita power consumption, which will be caused by increased urbanisation, industrialisation, the construction industry, and demand for better electric and electronic equipment. In addition, a strong manufacturing base and increased investments in infrastructure and power generation in the region's developing countries are likely to boost the market for electric fuses.
Region with highest CAGR:
North America is projected to have the highest CAGR over the forecast period, owing to rising digitisation. The demand for dependable energy has increased as a result of the presence of industry titans like Face book, Google, Twitter, Apple, Amazon, and others in the United States, which has prompted the development of electric fuses. The government has proposed several projects to upgrade the transmission and distribution network by replacing the outdated substations, and various authorities are putting safety measures in place in the electric utility to prevent harm and fatalities, which will increase the demand for electric fuses in North America.

Key players in the market
Some of the key players profiled in the Electric Fuse Market include Schneider Electric SE, Eaton Corporation Plc, ABB Ltd., Siemens AG, Mersen S.A, Fuji Electric Co., Ltd, Bel Fuse Inc., Littelfuse, Inc., Conquer Electronics Co., Ltd., SCHURTER AG, Hubbell, Legrand, S&C Electric Company, G&W Mantracourt Electronics, Mitsubishi Materials Corporation, Panasonic Electronic Devices Co., Ltd., Sano Corporation, TE Connectivity Ltd. and Polytronics Technology Corporation.
Key Developments:
In August 2018, Global leader of electrical power and advanced materials, Mersen recently launched globally certified HP15FHM32 1500VDC Helio Protection fuse holder series for photovoltaic application. The new fuse includes finger-safe rotating fuse carrier that accepts 10/14 x 85 mm gPV fuses, offering the next level of safety for utility scale photovoltaic applications.
In May 2018, Mersen announced the signing pact for the acquisition of FTCap that enable the company to broaden its product portfolios such as high-speed fuses, cooling devices and laminated bus bars to capacitors. This will strengthen the Merson’s position in the global power electronics market.
Types Covered:
• Distribution Cut-outs
• Power Fuse and Fuse Links
• Cartridge and Plug Fuses
• Industrial Power and UL Fuses
• Axial Radial Thru Hole Fuses
• Surface Mount Fuses
• Specialty Power Fuses
• Other Types
Voltages Covered:
• Low Voltage
• Medium Voltage
• High Voltage
Current Ratings Covered:
• <500A
• 500A-2000A
• 2000-4000A
• >4000A
Applications Covered:
• Commercial
• Residential
• Electric Utilities
• Industrial
• Other Applications
End Users Covered:
• Electrical Cabling
• Electronic Devices
• Electrical Appliances
• Power Transformers
• Automotive
• Other End Users
Regions Covered:
• North America
o US
o Canada
o Mexico
• Europe
o Germany
o UK
o Italy
o France
o Spain
o Rest of Europe
• Asia Pacific
o Japan
o China
o India
o Australia
o New Zealand
o South Korea
o Rest of Asia Pacific
• South America
o Argentina
o Brazil
o Chile
o Rest of South America
• Middle East & Africa
o Saudi Arabia
o UAE
o Qatar
o South Africa
o Rest of Middle East & Africa
What our report offers:
- Market share assessments for the regional and country-level segments
- Strategic recommendations for the new entrants
- Covers Market data for the years 2020, 2021, 2022, 2025, and 2028
- Market Trends (Drivers, Constraints, Opportunities, Threats, Challenges, Investment Opportunities, and recommendations)
- Strategic recommendations in key business segments based on the market estimations
- Competitive landscaping mapping the key common trends
- Company profiling with detailed strategies, financials, and recent developments
- Supply chain trends mapping the latest technological advancements
Free Customization Offerings:
All the customers of this report will be entitled to receive one of the following free customization options:
• Company Profiling
o Comprehensive profiling of additional market players (up to 3)
o SWOT Analysis of key players (up to 3)
• Regional Segmentation
o Market estimations, Forecasts and CAGR of any prominent country as per the client's interest (Note: Depends on feasibility check)
• Competitive Benchmarking
o Benchmarking of key players based on product portfolio, geographical presence, and strategic alliances
Table of Contents
1 Executive Summary
2 Preface
2.1 Abstract
2.2 Stake Holders
2.3 Research Scope
2.4 Research Methodology
2.4.1 Data Mining
2.4.2 Data Analysis
2.4.3 Data Validation
2.4.4 Research Approach
2.5 Research Sources
2.5.1 Primary Research Sources
2.5.2 Secondary Research Sources
2.5.3 Assumptions
3 Market Trend Analysis
3.1 Introduction
3.2 Drivers
3.3 Restraints
3.4 Opportunities
3.5 Threats
3.6 Application Analysis
3.7 End User Analysis
3.8 Emerging Markets
3.9 Impact of Covid-19
4 Porters Five Force Analysis
4.1 Bargaining power of suppliers
4.2 Bargaining power of buyers
4.3 Threat of substitutes
4.4 Threat of new entrants
4.5 Competitive rivalry
5 Global Electric Fuse Market, By Type
5.1 Introduction
5.2 Distribution Cutouts
5.3 Power Fuse and Fuse Links
5.4 Cartridge and Plug Fuses
5.5 Industrial Power and UL Fuses
5.6 Axial Radial Thru Hole Fuses
5.7 Surface Mount Fuses
5.8 Specialty Power Fuses
5.9 Other Types
6 Global Electric Fuse Market, By Voltage
6.1 Introduction
6.2 Low Voltage
6.2.1 <100V
6.2.2 100V-250V
6.2.3 250-400V
6.2.4 >400V
6.3 Medium Voltage
6.4 High Voltage
6.4.1 1kV-11kV
6.4.2 11kV-33kV
6.4.3 >33kV
7 Global Electric Fuse Market, By Current Rating
7.1 Introduction
7.2 <500A
7.3 500A-2000A
7.4 2000-4000A
7.5 >4000A
8 Global Electric Fuse Market, By Application
8.1 Introduction
8.2 Commercial
8.3 Residential
8.4 Electric Utilities
8.5 Industrial
8.6 Other Applications
9 Global Electric Fuse Market, By End User
9.1 Introduction
9.2 Electrical Cabling
9.3 Electronic Devices
9.4 Electrical Appliances
9.5 Power Transformers
9.6 Automotive
9.7 Other End Users
10 Global Electric Fuse Market, By Geography
10.1 Introduction
10.2 North America
10.2.1 US
10.2.2 Canada
10.2.3 Mexico
10.3 Europe
10.3.1 Germany
10.3.2 UK
10.3.3 Italy
10.3.4 France
10.3.5 Spain
10.3.6 Rest of Europe
10.4 Asia Pacific
10.4.1 Japan
10.4.2 China
10.4.3 India
10.4.4 Australia
10.4.5 New Zealand
10.4.6 South Korea
10.4.7 Rest of Asia Pacific
10.5 South America
10.5.1 Argentina
10.5.2 Brazil
10.5.3 Chile
10.5.4 Rest of South America
10.6 Middle East & Africa
10.6.1 Saudi Arabia
10.6.2 UAE
10.6.3 Qatar
10.6.4 South Africa
10.6.5 Rest of Middle East & Africa
11 Key Developments
11.1 Agreements, Partnerships, Collaborations and Joint Ventures
11.2 Acquisitions & Mergers
11.3 New Product Launch
11.4 Expansions
11.5 Other Key Strategies
12 Company Profiling
12.1 Schneider Electric SE
12.2 Eaton Corporation Plc
12.3 ABB Ltd.
12.4 Siemens AG
12.5 Mersen S.A
12.6 Fuji Electric Co., Ltd
12.7 Bel Fuse Inc.
12.8 Littelfuse, Inc.
12.9 Conquer Electronics Co., Ltd.
12.10 SCHURTER AG,
12.11 Hubbell
12.12 Legrand
12.13 S&C Electric Company
12.14 G&W Mantracourt Electronics
12.15 Mitsubishi Materials Corporation
12.16 Panasonic Electronic Devices Co., Ltd.
12.17 Sano Corporation
12.18 TE Connectivity Ltd.
12.19 Polytronics Technology Corporation
List of Tables
1 Global Electric Fuse Market Outlook, By Region (2020-2028) ($MN)
2 Global Electric Fuse Market Outlook, By Type (2020-2028) ($MN)
3 Global Electric Fuse Market Outlook, By Distribution Cutouts (2020-2028) ($MN)
4 Global Electric Fuse Market Outlook, By Power Fuse and Fuse Links (2020-2028) ($MN)
5 Global Electric Fuse Market Outlook, By Cartridge and Plug Fuses (2020-2028) ($MN)
6 Global Electric Fuse Market Outlook, By Industrial Power and UL Fuses (2020-2028) ($MN)
7 Global Electric Fuse Market Outlook, By Axial Radial Thru Hole Fuses (2020-2028) ($MN)
8 Global Electric Fuse Market Outlook, By Surface Mount Fuses (2020-2028) ($MN)
9 Global Electric Fuse Market Outlook, By Specialty Power Fuses (2020-2028) ($MN)
10 Global Electric Fuse Market Outlook, By Other Types (2020-2028) ($MN)
11 Global Electric Fuse Market Outlook, By Voltage (2020-2028) ($MN)
12 Global Electric Fuse Market Outlook, By Low Voltage (2020-2028) ($MN)
13 Global Electric Fuse Market Outlook, By <100V (2020-2028) ($MN)
14 Global Electric Fuse Market Outlook, By 100V-250V (2020-2028) ($MN)
15 Global Electric Fuse Market Outlook, By 250-400V (2020-2028) ($MN)
16 Global Electric Fuse Market Outlook, By >400V (2020-2028) ($MN)
17 Global Electric Fuse Market Outlook, By Medium Voltage (2020-2028) ($MN)
18 Global Electric Fuse Market Outlook, By High Voltage (2020-2028) ($MN)
19 Global Electric Fuse Market Outlook, By 1kV-11kV (2020-2028) ($MN)
20 Global Electric Fuse Market Outlook, By 11kV-33kV (2020-2028) ($MN)
21 Global Electric Fuse Market Outlook, By >33kV (2020-2028) ($MN)
22 Global Electric Fuse Market Outlook, By Current Rating (2020-2028) ($MN)
23 Global Electric Fuse Market Outlook, By <500A (2020-2028) ($MN)
24 Global Electric Fuse Market Outlook, By 500A-2000A (2020-2028) ($MN)
25 Global Electric Fuse Market Outlook, By 2000-4000A (2020-2028) ($MN)
26 Global Electric Fuse Market Outlook, By >4000A (2020-2028) ($MN)
27 Global Electric Fuse Market Outlook, By Application (2020-2028) ($MN)
28 Global Electric Fuse Market Outlook, By Commercial (2020-2028) ($MN)
29 Global Electric Fuse Market Outlook, By Residential (2020-2028) ($MN)
30 Global Electric Fuse Market Outlook, By Electric Utilities (2020-2028) ($MN)
31 Global Electric Fuse Market Outlook, By Industrial (2020-2028) ($MN)
32 Global Electric Fuse Market Outlook, By Other Applications (2020-2028) ($MN)
33 Global Electric Fuse Market Outlook, By End User (2020-2028) ($MN)
34 Global Electric Fuse Market Outlook, By Electrical Cabling (2020-2028) ($MN)
35 Global Electric Fuse Market Outlook, By Electronic Devices (2020-2028) ($MN)
36 Global Electric Fuse Market Outlook, By Electrical Appliances (2020-2028) ($MN)
37 Global Electric Fuse Market Outlook, By Power Transformers (2020-2028) ($MN)
38 Global Electric Fuse Market Outlook, By Automotive (2020-2028) ($MN)
39 Global Electric Fuse Market Outlook, By Other End Users (2020-2028) ($MN)
Note: Tables for North America, Europe, APAC, South America, and Middle East & Africa Regions are also represented in the same manner as above.
List of Figures
RESEARCH METHODOLOGY

We at ‘Stratistics’ opt for an extensive research approach which involves data mining, data validation, and data analysis. The various research sources include in-house repository, secondary research, competitor’s sources, social media research, client internal data, and primary research.
Our team of analysts prefers the most reliable and authenticated data sources in order to perform the comprehensive literature search. With access to most of the authenticated data bases our team highly considers the best mix of information through various sources to obtain extensive and accurate analysis.
Each report takes an average time of a month and a team of 4 industry analysts. The time may vary depending on the scope and data availability of the desired market report. The various parameters used in the market assessment are standardized in order to enhance the data accuracy.
Data Mining
The data is collected from several authenticated, reliable, paid and unpaid sources and is filtered depending on the scope & objective of the research. Our reports repository acts as an added advantage in this procedure. Data gathering from the raw material suppliers, distributors and the manufacturers is performed on a regular basis, this helps in the comprehensive understanding of the products value chain. Apart from the above mentioned sources the data is also collected from the industry consultants to ensure the objective of the study is in the right direction.
Market trends such as technological advancements, regulatory affairs, market dynamics (Drivers, Restraints, Opportunities and Challenges) are obtained from scientific journals, market related national & international associations and organizations.
Data Analysis
From the data that is collected depending on the scope & objective of the research the data is subjected for the analysis. The critical steps that we follow for the data analysis include:
- Product Lifecycle Analysis
- Competitor analysis
- Risk analysis
- Porters Analysis
- PESTEL Analysis
- SWOT Analysis
The data engineering is performed by the core industry experts considering both the Marketing Mix Modeling and the Demand Forecasting. The marketing mix modeling makes use of multiple-regression techniques to predict the optimal mix of marketing variables. Regression factor is based on a number of variables and how they relate to an outcome such as sales or profits.
Data Validation
The data validation is performed by the exhaustive primary research from the expert interviews. This includes telephonic interviews, focus groups, face to face interviews, and questionnaires to validate our research from all aspects. The industry experts we approach come from the leading firms, involved in the supply chain ranging from the suppliers, distributors to the manufacturers and consumers so as to ensure an unbiased analysis.
We are in touch with more than 15,000 industry experts with the right mix of consultants, CEO's, presidents, vice presidents, managers, experts from both supply side and demand side, executives and so on.
The data validation involves the primary research from the industry experts belonging to:
- Leading Companies
- Suppliers & Distributors
- Manufacturers
- Consumers
- Industry/Strategic Consultants
Apart from the data validation the primary research also helps in performing the fill gap research, i.e. providing solutions for the unmet needs of the research which helps in enhancing the reports quality.
For more details about research methodology, kindly write to us at info@strategymrc.com
Frequently Asked Questions
In case of any queries regarding this report, you can contact the customer service by filing the “Inquiry Before Buy” form available on the right hand side. You may also contact us through email: info@strategymrc.com or phone: +1-301-202-5929
Yes, the samples are available for all the published reports. You can request them by filling the “Request Sample” option available in this page.
Yes, you can request a sample with your specific requirements. All the customized samples will be provided as per the requirement with the real data masked.
All our reports are available in Digital PDF format. In case if you require them in any other formats, such as PPT, Excel etc you can submit a request through “Inquiry Before Buy” form available on the right hand side. You may also contact us through email: info@strategymrc.com or phone: +1-301-202-5929
We offer a free 15% customization with every purchase. This requirement can be fulfilled for both pre and post sale. You may send your customization requirements through email at info@strategymrc.com or call us on +1-301-202-5929.
We have 3 different licensing options available in electronic format.
- Single User Licence: Allows one person, typically the buyer, to have access to the ordered product. The ordered product cannot be distributed to anyone else.
- 2-5 User Licence: Allows the ordered product to be shared among a maximum of 5 people within your organisation.
- Corporate License: Allows the product to be shared among all employees of your organisation regardless of their geographical location.
All our reports are typically be emailed to you as an attachment.
To order any available report you need to register on our website. The payment can be made either through CCAvenue or PayPal payments gateways which accept all international cards.
We extend our support to 6 months post sale. A post sale customization is also provided to cover your unmet needs in the report.
Request Customization
We offer complimentary customization of up to 15% with every purchase. To share your customization requirements, feel free to email us at info@strategymrc.com or call us on +1-301-202-5929. .
Please Note: Customization within the 15% threshold is entirely free of charge. If your request exceeds this limit, we will conduct a feasibility assessment. Following that, a detailed quote and timeline will be provided.
WHY CHOOSE US ?

Assured Quality
Best in class reports with high standard of research integrity

24X7 Research Support
Continuous support to ensure the best customer experience.

Free Customization
Adding more values to your product of interest.

Safe & Secure Access
Providing a secured environment for all online transactions.

Trusted by 600+ Brands
Serving the most reputed brands across the world.