
Food Preservatives Market
Food Preservatives Market Forecasts to 2028 – Global Analysis By Type(Natural, Propionates), Function (Antimicrobial, Antioxidant), Application (Bakery, Beverages, Canned & Preservative Food) and By Geography

|
Years Covered |
2020-2028 |
|
Estimated Year Value (2021) |
US $3.07 BN |
|
Projected Year Value (2028) |
US $4.32 BN |
|
CAGR (2021 - 2028) |
5.0% |
|
Regions Covered |
North America, Europe, Asia Pacific, South America, and Middle East & Africa |
|
Countries Covered |
US, Canada, Mexico, Germany, UK, Italy, France, Spain, Japan, China, India, Australia, New Zealand, South Korea, Rest of Asia Pacific, South America, Argentina, Brazil, Chile, Middle East & Africa, Saudi Arabia, UAE, Qatar, and South Africa |
|
Largest Market |
North America |
|
Highest Growing Market |
Asia Pacific |
According to Stratistics MRC, the Global Food Preservatives Market is accounted for $3.07 billion in 2021 and is expected to reach $4.32 billion by 2028 growing at a CAGR of 5.0% during the forecast period. Food preservatives are defined as the specialised chemical ingredients or extracts which are added to the food products during their production processing to restrict the growth of bacteria, microorganisms, and other harmful effects such as oxidisation. The addition of these substances helps in improving the shelf life of the products and retains the freshness making them consumable for a longer period of time.
Market Dynamics:
Driver:
Rise in Demand for Food Products
Increased work hours have altered consumer lifestyles, and consequently, their eating habits. These changes are demanding food products that provide convenient consumption and longer shelf life. Hence, its role of it is becoming increasingly important in the food & beverage industry. The growing demand for foods with extended shelf life has shown a high impact on the food processing industry. Generally, the well-proved storage efficacy, due to preservatives, has improved food delivery methods, competitive pricing, and added value to food products.
Restraint:
Inadequate Obtainability of Natural Preservatives
The preference for natural preservatives over synthetic ones is proving to be a challenge for preservative users in the food & beverage industry. Buyer opinion is that natural foods are healthier than those with artificial preservers. The growth in the U.S. cheese industry is being driven by unprocessed cheese as consumers seek out higher-quality foods. Within the food industry, affluent shoppers are looking for artisanal, handcrafted, and small-batch foods. Within the cheese powder market industry, high-income consumers seek unprocessed cheese that has a richer flavor profile than processed cheese with synthetic preservatives.
Opportunity:
Increasing Demand for Functional Beverages
The booming beverage industry is majorly uplifting the consumption of ingredients including preservatives which is most likely to foster market growth. The growing demand for nutraceutical drinks as well as products owing to the presence of several healthy components, such as vegetables, fruits, and plants, along with the rising demand for dairy-based beverages across the globe foster the demand for global functional beverages. Moreover, with the rise in demand for functional beverages, the market for natural preservatives is gaining momentum. Manufacturers are embracing innovation for gaining a position in the market by incorporating organically sourced preservatives in the product formulation.
Threat:
Health hazards
Due to the consumption of synthetic preservatives. Dried and dehydrated foods often contain sulfites. FDA estimated that more than one million asthmatics are sensitive or allergic to sulfites. Symptoms related to sulfite consumption include difficulty in breathing, hives, stomachache, and anaphylactic shock. The Food and Drug Administration (FDA), in 2013, approved more than 3,000 food additives for use in the U.S. However, while approved for human consumption, food additives may still threaten our health. This is one of the many reasons why people opt for minimally processed and treated foods.
Antimicrobial segment is expected to be the largest during the forecast period
Antimicrobial agents also include compounds such as calcium propionate and sorbic acid, which are used in products such as baked goods, salad dressings, cheeses, margarines, and pickled foods. Antimicrobials are also currently employed as preservatives within the food industry to extend product shelf life, improve product safety, maintain product quality, reduce processing costs, and increase the ability to distribute products globally in complex supply chains. Due to consumer concerns about the use of synthetic additives, the market for synthetic antimicrobials is declining and being replaced with natural antimicrobial.
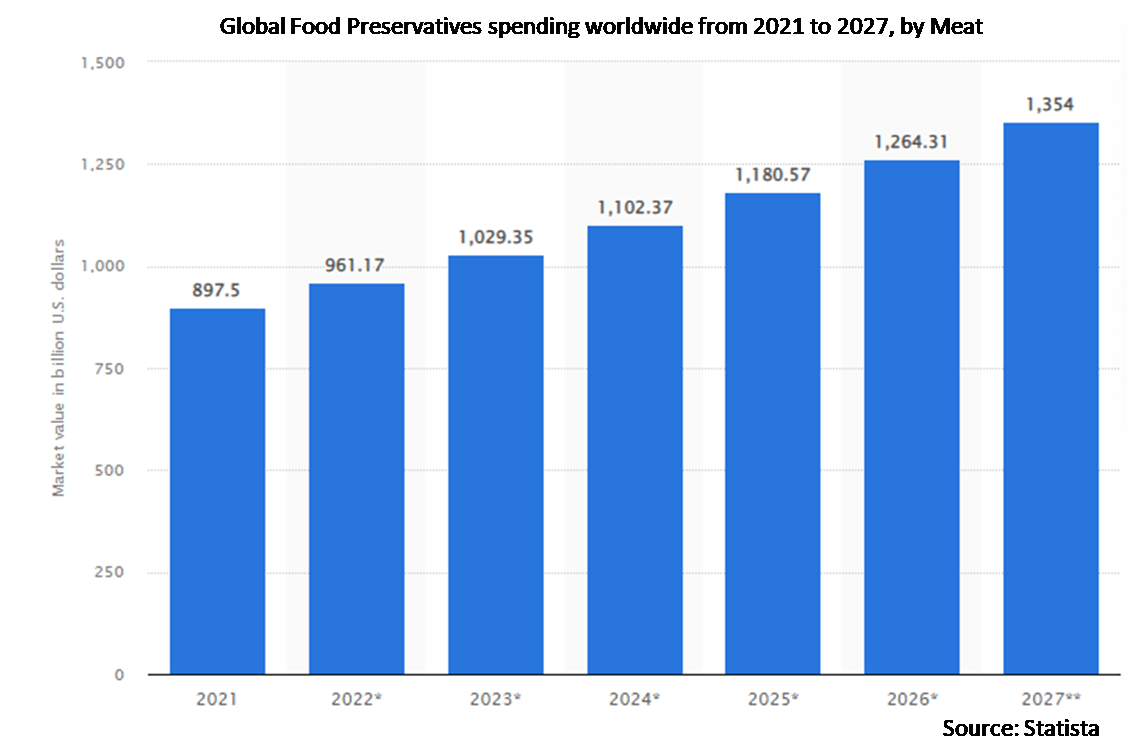
The Meat segment is expected to have the highest CAGR during the forecast period
Decay of the meat sets in as soon as the blood ceases to pulse in the veins, thus making it preservation necessary until its consumption. The nature of preservation must be governed by circumstances such as the kind and quality of the meat to be preserved, period, and climatic conditions, among other factors. While salt, vinegar, and alcohol are largely used as since ancient times, boric acid and borax, and solutions containing salicylic acid and sulfuric acid are experiencing increasing usage. Preservatives for meat are required on a large scale; this is because meat is very commonly consumed across the globe.
Region with highest share:
North America is projected to hold the highest market share. Consumers in U.S. and Canada have well appreciated the processed edibles and ready-to-eat products, as these products have a longer shelf life and are readily available. As it is a major exporter of fruits, thus increasing the demand for the market. The region has highly regulated policies concerning the commercialization of food products and ingredients. Such regulations have offered lucrative growth opportunities for manufacturers to introduce novel preservatives with minimum or no side effects on human health. Advanced technological growth in the field of food processing is driving the growth of the North American food and beverage preservative market.
Region with highest CAGR:
Asia Pacific is projected to have the highest CAGR, owing to growth in the population, development in food & beverage industry, and stable economic growth. Emerging markets, such as China and India, are expected to show the highest increase in demand for food preservatives during the forecast period. Substantial development in the ready-to-eat food products, meat, and poultry application is anticipated to boost the market growth.

Key players in the market:
Some of the key players profiled in the xx Market include BASF SE, C.H. Guenther & Son, Cargill Inc., Celanese Technology, Chr. Hansen Holding A/S, Corbion N.V, Danisco , DuPont, Hawkins Watts Limited , JEYS F.I Inc., Jungbunzlauer Suisse AG, Basel, Kerry Group Plc., Koninklijke DSM N.V, Kraft Food Ingredients, The Archer Daniels Midland Company (ADM.)
Key developments:
In May 2021: Cargill Incorporated announced EpiCor® postbiotic, which is a dried yeast fermentate providing immune system support. The postbiotic is used in popular supplements and enables food and beverage manufacturers to incorporate EpiCor® into a variety of foods and beverages.
In May 2019: Kerry announced the new development and application center tht bring end-to-end food innovation cycles under one roof, reducing the time to market for new product developments and increasing Kerry’s capacity to drive food innovations in the region.
In July 2021: DSM expanded its Dairy Safe cheese biopreservation portfolio, with a selection of new phage-robust culture rotations. With the new cultures, cheese producers can benefit from an even more robust culture rotation system, ensuring reliable and consistent cheese production and optimal phage management.
Types Covered:
• Natural
• Synthetic/Chemical
• Propionates
• Other Types
Functions Covered:
• Antimicrobial
• Antioxidant
• Antifungal
• Chelates
• Enzyme Inhibitors
• Preservatives
• Anti-Enzymatic Food Preservative
Applications Covered:
• Bakery
• Beverages
• Canned & Preservative Food
• Cereal
• Confectionery
• Dairy & Frozen
• Dairy, Milk & Frozen Products
• Desserts
• Dressings & Condiments
• Meat
• Oil & Fat
• Poultry & Seafood
• Sauces & Salad Mixes
• Snacks
• Sweet & Savoury
Regions Covered:
• North America
o US
o Canada
o Mexico
• Europe
o Germany
o UK
o Italy
o France
o Spain
o Rest of Europe
• Asia Pacific
o Japan
o China
o India
o Australia
o New Zealand
o South Korea
o Rest of Asia Pacific
• South America
o Argentina
o Brazil
o Chile
o Rest of South America
• Middle East & Africa
o Saudi Arabia
o UAE
o Qatar
o South Africa
o Rest of Middle East & Africa
What our report offers:
- Market share assessments for the regional and country-level segments
- Strategic recommendations for the new entrants
- Covers Market data for the years 2020, 2021, 2022, 2025 and 2028
- Market Trends (Drivers, Constraints, Opportunities, Threats, Challenges, Investment Opportunities, and recommendations)
- Strategic recommendations in key business segments based on the market estimations
- Competitive landscaping mapping the key common trends
- Company profiling with detailed strategies, financials, and recent developments
- Supply chain trends mapping the latest technological advancements
Free Customization Offerings:
All the customers of this report will be entitled to receive one of the following free customization options:
• Company Profiling
o Comprehensive profiling of additional market players (up to 3)
o SWOT Analysis of key players (up to 3)
• Regional Segmentation
o Market estimations, Forecasts and CAGR of any prominent country as per the client's interest (Note: Depends on feasibility check)
• Competitive Benchmarking
o Benchmarking of key players based on product portfolio, geographical presence, and strategic alliances
Table of Contents
1 Executive Summary
2 Preface
2.1 Abstract
2.2 Stake Holders
2.3 Research Scope
2.4 Research Methodology
2.4.1 Data Mining
2.4.2 Data Analysis
2.4.3 Data Validation
2.4.4 Research Approach
2.5 Research Sources
2.5.1 Primary Research Sources
2.5.2 Secondary Research Sources
2.5.3 Assumptions
3 Market Trend Analysis
3.1 Introduction
3.2 Drivers
3.3 Restraints
3.4 Opportunities
3.5 Threats
3.6 Application Analysis
3.7 Emerging Markets
3.8 Impact of Covid-19
4 Porters Five Force Analysis
4.1 Bargaining power of suppliers
4.2 Bargaining power of buyers
4.3 Threat of substitutes
4.4 Threat of new entrants
4.5 Competitive rivalry
5 Global Food Preservatives Market, By Type
5.1 Introduction
5.2 Natural
5.2.1 Alcohol
5.2.2 Edible Oil
5.2.3 Honey
5.2.4 Natamycin
5.2.5 Nicin
5.2.6 Onion
5.2.7 Rosemary Extracts
5.2.8 Salt
5.2.9 Sugar
5.2.10 Vinegar
5.2.11 Organic Acid
5.2.11.1 Citric Acid
5.2.11.2 Lactic Acid
5.2.12 Tocopherol
5.3 Synthetic/Chemical
5.3.1 Sorbates
5.3.1.1 Potassium Sorbate
5.3.1.2 Sorbic Acid
5.3.2 Benzoates
5.3.2.1 Benzoic Acid
5.3.2.2 Sodium Benzoate
5.4 Propionates
5.4.1 Calcium Propionate
5.4.2 Propionic Acid
5.4.3 Sodium Propionate
5.5 Other Types
5.5.1 Nitrites & Nitrates
5.5.2 Sulphites & Sulphates
5.5.2.1 Acetic Acid
5.5.2.2 Sodium Diacetate
5.5.2.3 Sulphur Dioxide
6 Global Food Preservatives Market, By Function
6.1 Introduction
6.2 Antimicrobial
6.3 Antioxidant
6.3.1 Tertiary Butylhydroquinone
6.3.2 Propyl Gallate
6.3.3 Methylchloroisothiazolinone
6.3.4 Butylated Hydroxyanisole
6.3.5 Butylated Hydroxy Toluene
6.3.6 Ascorbic Acid/Salts
6.4 Antifungal
6.5 Chelates
6.6 Enzyme Inhibitors
6.7 Preservatives
6.8 Anti-Enzymatic Food Preservative
7 Global Food Preservatives Market, By Application
7.1 Introduction
7.2 Bakery
7.3 Beverages
7.4 Canned & Preservative Food
7.5 Cereal
7.6 Confectionery
7.7 Dairy & Frozen
7.8 Dairy, Milk & Frozen Products
7.9 Desserts
7.10 Dressings & Condiments
7.11 Meat
7.12 Oil & Fat
7.13 Poultry & Seafood
7.14 Sauces & Salad Mixes
7.15 Snacks
7.16 Sweet & Savoury
8 Global Food Preservatives Market, By Geography
8.1 Introduction
8.2 North America
8.2.1 US
8.2.2 Canada
8.2.3 Mexico
8.3 Europe
8.3.1 Germany
8.3.2 UK
8.3.3 Italy
8.3.4 France
8.3.5 Spain
8.3.6 Rest of Europe
8.4 Asia Pacific
8.4.1 Japan
8.4.2 China
8.4.3 India
8.4.4 Australia
8.4.5 New Zealand
8.4.6 South Korea
8.4.7 Rest of Asia Pacific
8.5 South America
8.5.1 Argentina
8.5.2 Brazil
8.5.3 Chile
8.5.4 Rest of South America
8.6 Middle East & Africa
8.6.1 Saudi Arabia
8.6.2 UAE
8.6.3 Qatar
8.6.4 South Africa
8.6.5 Rest of Middle East & Africa
9 Key Developments
9.1 Agreements, Partnerships, Collaborations and Joint Ventures
9.2 Acquisitions & Mergers
9.3 New Product Launch
9.4 Expansions
9.5 Other Key Strategies
10 Company Profiling
10.1 BASF SE
10.2 C.H. Guenther & Son
10.3 Cargill Inc.
10.4 Celanese Technology
10.5 Chr. Hansen Holding A/S
10.6 Corbion N.V
10.7 Danisco
10.8 DuPont
10.9 Hawkins Watts Limited
10.10 JEYS F.I Inc.
10.11 Jungbunzlauer Suisse AG, Basel
10.12 Kerry Group Plc.
10.13 Koninklijke DSM N.V
10.14 Kraft Food Ingredients
10.15 The Archer Daniels Midland Company (ADM)
10.15 DSM
List of Tables
1 Global Food Preservatives Market Outlook, By Region (2020-2028) (US $MN)
2 Global Food Preservatives Market Outlook, By Type (2020-2028) (US $MN)
3 Global Food Preservatives Market Outlook, By Natural (2020-2028) (US $MN)
4 Global Food Preservatives Market Outlook, By Alcohol (2020-2028) (US $MN)
5 Global Food Preservatives Market Outlook, By Edible Oil (2020-2028) (US $MN)
6 Global Food Preservatives Market Outlook, By Honey (2020-2028) (US $MN)
7 Global Food Preservatives Market Outlook, By Natamycin (2020-2028) (US $MN)
8 Global Food Preservatives Market Outlook, By Nicin (2020-2028) (US $MN)
9 Global Food Preservatives Market Outlook, By Onion (2020-2028) (US $MN)
10 Global Food Preservatives Market Outlook, By Rosemary Extracts (2020-2028) (US $MN)
11 Global Food Preservatives Market Outlook, By Salt (2020-2028) (US $MN)
12 Global Food Preservatives Market Outlook, By Sugar (2020-2028) (US $MN)
13 Global Food Preservatives Market Outlook, By Vinegar (2020-2028) (US $MN)
14 Global Food Preservatives Market Outlook, By Organic Acid (2020-2028) (US $MN)
15 Global Food Preservatives Market Outlook, By Tocopherol (2020-2028) (US $MN)
16 Global Food Preservatives Market Outlook, By Synthetic/Chemical (2020-2028) (US $MN)
17 Global Food Preservatives Market Outlook, By Sorbates (2020-2028) (US $MN)
18 Global Food Preservatives Market Outlook, By Benzoates (2020-2028) (US $MN)
19 Global Food Preservatives Market Outlook, By Propionates (2020-2028) (US $MN)
20 Global Food Preservatives Market Outlook, By Calcium Propionate (2020-2028) (US $MN)
21 Global Food Preservatives Market Outlook, By Propionic Acid (2020-2028) (US $MN)
22 Global Food Preservatives Market Outlook, By Sodium Propionate (2020-2028) (US $MN)
23 Global Food Preservatives Market Outlook, By Other Types (2020-2028) (US $MN)
24 Global Food Preservatives Market Outlook, By Nitrites & Nitrates (2020-2028) (US $MN)
25 Global Food Preservatives Market Outlook, By Sulphites & Sulphates (2020-2028) (US $MN)
26 Global Food Preservatives Market Outlook, By Function (2020-2028) (US $MN)
27 Global Food Preservatives Market Outlook, By Antimicrobial (2020-2028) (US $MN)
28 Global Food Preservatives Market Outlook, By Antioxidant (2020-2028) (US $MN)
29 Global Food Preservatives Market Outlook, By Tertiary Butylhydroquinone (2020-2028) (US $MN)
30 Global Food Preservatives Market Outlook, By Propyl Gallate (2020-2028) (US $MN)
31 Global Food Preservatives Market Outlook, By Methylchloroisothiazolinone (2020-2028) (US $MN)
32 Global Food Preservatives Market Outlook, By Butylated Hydroxyanisole (2020-2028) (US $MN)
33 Global Food Preservatives Market Outlook, By Butylated Hydroxy Toluene (2020-2028) (US $MN)
34 Global Food Preservatives Market Outlook, By Ascorbic Acid/Salts (2020-2028) (US $MN)
35 Global Food Preservatives Market Outlook, By Antifungal (2020-2028) (US $MN)
36 Global Food Preservatives Market Outlook, By Chelates (2020-2028) (US $MN)
37 Global Food Preservatives Market Outlook, By Enzyme Inhibitors (2020-2028) (US $MN)
38 Global Food Preservatives Market Outlook, By Preservatives (2020-2028) (US $MN)
39 Global Food Preservatives Market Outlook, By Anti-Enzymatic Food Preservative (2020-2028) (US $MN)
40 Global Food Preservatives Market Outlook, By Application (2020-2028) (US $MN)
41 Global Food Preservatives Market Outlook, By Bakery (2020-2028) (US $MN)
42 Global Food Preservatives Market Outlook, By Beverages (2020-2028) (US $MN)
43 Global Food Preservatives Market Outlook, By Canned & Preservative Food (2020-2028) (US $MN)
44 Global Food Preservatives Market Outlook, By Cereal (2020-2028) (US $MN)
45 Global Food Preservatives Market Outlook, By Confectionery (2020-2028) (US $MN)
46 Global Food Preservatives Market Outlook, By Dairy & Frozen (2020-2028) (US $MN)
47 Global Food Preservatives Market Outlook, By Dairy, Milk & Frozen Products (2020-2028) (US $MN)
48 Global Food Preservatives Market Outlook, By Desserts (2020-2028) (US $MN)
49 Global Food Preservatives Market Outlook, By Dressings & Condiments (2020-2028) (US $MN)
50 Global Food Preservatives Market Outlook, By Meat (2020-2028) (US $MN)
51 Global Food Preservatives Market Outlook, By Oil & Fat (2020-2028) (US $MN)
52 Global Food Preservatives Market Outlook, By Poultry & Seafood (2020-2028) (US $MN)
53 Global Food Preservatives Market Outlook, By Sauces & Salad Mixes (2020-2028) (US $MN)
54 Global Food Preservatives Market Outlook, By Snacks (2020-2028) (US $MN)
55 Global Food Preservatives Market Outlook, By Sweet & Savoury (2020-2028) (US $MN)
Note- Tables for North America, Europe, APAC, South America, and Middle East & Africa Regions are also represented in the same manner as above.
List of Figures
RESEARCH METHODOLOGY

We at ‘Stratistics’ opt for an extensive research approach which involves data mining, data validation, and data analysis. The various research sources include in-house repository, secondary research, competitor’s sources, social media research, client internal data, and primary research.
Our team of analysts prefers the most reliable and authenticated data sources in order to perform the comprehensive literature search. With access to most of the authenticated data bases our team highly considers the best mix of information through various sources to obtain extensive and accurate analysis.
Each report takes an average time of a month and a team of 4 industry analysts. The time may vary depending on the scope and data availability of the desired market report. The various parameters used in the market assessment are standardized in order to enhance the data accuracy.
Data Mining
The data is collected from several authenticated, reliable, paid and unpaid sources and is filtered depending on the scope & objective of the research. Our reports repository acts as an added advantage in this procedure. Data gathering from the raw material suppliers, distributors and the manufacturers is performed on a regular basis, this helps in the comprehensive understanding of the products value chain. Apart from the above mentioned sources the data is also collected from the industry consultants to ensure the objective of the study is in the right direction.
Market trends such as technological advancements, regulatory affairs, market dynamics (Drivers, Restraints, Opportunities and Challenges) are obtained from scientific journals, market related national & international associations and organizations.
Data Analysis
From the data that is collected depending on the scope & objective of the research the data is subjected for the analysis. The critical steps that we follow for the data analysis include:
- Product Lifecycle Analysis
- Competitor analysis
- Risk analysis
- Porters Analysis
- PESTEL Analysis
- SWOT Analysis
The data engineering is performed by the core industry experts considering both the Marketing Mix Modeling and the Demand Forecasting. The marketing mix modeling makes use of multiple-regression techniques to predict the optimal mix of marketing variables. Regression factor is based on a number of variables and how they relate to an outcome such as sales or profits.
Data Validation
The data validation is performed by the exhaustive primary research from the expert interviews. This includes telephonic interviews, focus groups, face to face interviews, and questionnaires to validate our research from all aspects. The industry experts we approach come from the leading firms, involved in the supply chain ranging from the suppliers, distributors to the manufacturers and consumers so as to ensure an unbiased analysis.
We are in touch with more than 15,000 industry experts with the right mix of consultants, CEO's, presidents, vice presidents, managers, experts from both supply side and demand side, executives and so on.
The data validation involves the primary research from the industry experts belonging to:
- Leading Companies
- Suppliers & Distributors
- Manufacturers
- Consumers
- Industry/Strategic Consultants
Apart from the data validation the primary research also helps in performing the fill gap research, i.e. providing solutions for the unmet needs of the research which helps in enhancing the reports quality.
For more details about research methodology, kindly write to us at info@strategymrc.com
Frequently Asked Questions
In case of any queries regarding this report, you can contact the customer service by filing the “Inquiry Before Buy” form available on the right hand side. You may also contact us through email: info@strategymrc.com or phone: +1-301-202-5929
Yes, the samples are available for all the published reports. You can request them by filling the “Request Sample” option available in this page.
Yes, you can request a sample with your specific requirements. All the customized samples will be provided as per the requirement with the real data masked.
All our reports are available in Digital PDF format. In case if you require them in any other formats, such as PPT, Excel etc you can submit a request through “Inquiry Before Buy” form available on the right hand side. You may also contact us through email: info@strategymrc.com or phone: +1-301-202-5929
We offer a free 15% customization with every purchase. This requirement can be fulfilled for both pre and post sale. You may send your customization requirements through email at info@strategymrc.com or call us on +1-301-202-5929.
We have 3 different licensing options available in electronic format.
- Single User Licence: Allows one person, typically the buyer, to have access to the ordered product. The ordered product cannot be distributed to anyone else.
- 2-5 User Licence: Allows the ordered product to be shared among a maximum of 5 people within your organisation.
- Corporate License: Allows the product to be shared among all employees of your organisation regardless of their geographical location.
All our reports are typically be emailed to you as an attachment.
To order any available report you need to register on our website. The payment can be made either through CCAvenue or PayPal payments gateways which accept all international cards.
We extend our support to 6 months post sale. A post sale customization is also provided to cover your unmet needs in the report.
Request Customization
We offer complimentary customization of up to 15% with every purchase. To share your customization requirements, feel free to email us at info@strategymrc.com or call us on +1-301-202-5929. .
Please Note: Customization within the 15% threshold is entirely free of charge. If your request exceeds this limit, we will conduct a feasibility assessment. Following that, a detailed quote and timeline will be provided.
WHY CHOOSE US ?

Assured Quality
Best in class reports with high standard of research integrity

24X7 Research Support
Continuous support to ensure the best customer experience.

Free Customization
Adding more values to your product of interest.

Safe & Secure Access
Providing a secured environment for all online transactions.

Trusted by 600+ Brands
Serving the most reputed brands across the world.