
Food Service Equipment Market
Food Service Equipment Market Forecasts to 2028 - Global Analysis By Product (Kitchen Purpose Equipment, Food Holding & Storing Equipment and Other Products), Application (Full-Service Restaurants, Quick Service Restaurants and Other Application), Distribution Channel and By Geography

|
Years Covered |
2020-2028 |
|
Estimated Year Value (2022) |
US $37.38 BN |
|
Projected Year Value (2028) |
US $60.65 BN |
|
CAGR (2022 - 2028) |
8.4% |
|
Regions Covered |
North America, Europe, Asia Pacific, South America, and Middle East & Africa |
|
Countries Covered |
US, Canada, Mexico, Germany, UK, Italy, France, Spain, Japan, China, India, Australia, New Zealand, South Korea, Rest of Asia Pacific, South America, Argentina, Brazil, Chile, Middle East & Africa, Saudi Arabia, UAE, Qatar, and South Africa |
|
Largest Market |
Asia Pacific |
|
Highest Growing Market |
North America |
According to Stratistics MRC, the Global Food Service Equipment Market is accounted for $37.38 billion in 2022 and is expected to reach $60.65 billion by 2028 growing at a CAGR of 8.4% during the forecast period. Food service equipment can be defined as all tools, utensils, crockery and cutlery necessary for the preparation, cooking, holding, serving of food and washing. With the help of Food Service Equipments the bother for the cooks are compact after using these appliances. They do not have to wait for long hours in front of the heat to prepare the food. Preheating the ovens fastens up the cooking time, adding extra flavour and taste to the food being prepared. Increased demand for refrigerated food products and a reference for junk food stimulate the global adoption of food service equipment.
According to the Glanbia Nutritional Survey of Healthy Snacking trends 2022, the five latest trends for healthy snacking include less sugar, high protein, clean snacking, new formats, and functional nutrition.
Market Dynamics:
Driver:
The Growth in Food Service Industry
The development of the food service equipment market is fuelled by the rise in business-related travel and the increase in the number of establishments that dish up foods, such as hotels and restaurants. It is expected that international investments, experiments, innovations in various cuisines, and growth in the travel and tourism industry will provide productive opportunities to enlarge the food service equipment market. In addition, a rise in the proportion of cafes and restaurants, as well as an increase in demand for multi-functional, space- and time-saving equipment are predicted to drive the market growth.
Restraint:
Requirement for High Capital
The high operation cost and integration capabilities necessary for kitchen equipment setup are factors limiting the adoption of food service equipment. The original investment and ongoing maintenance costs are high due to the incorporation of high-quality hardware, effective condensers, and compressors in cooking and refrigeration equipment, thus all the above factors are hindering the market growth.
Opportunity:
Technological Advancements in Restaurants and Catering Industry
Increase in the demand for technologically advancement and innovative products entering the market, is anticipated that these products will support market growth. These products range from the discovering equipment for order to prepare and eating materials, such as stoves, ranges, and electronic fridges, to the convenience of custom foodservice equipment to cook different cuisines. Equipments manufacturers are currently providing their customers with efficacious products due to the ongoing research & development operations, hence providing wide range of opportunities for the growth of the market.
Threat:
Increase in the food safety issues
Growing food safety issues and stick government regulations regarding food safety are hampering the market growth, which also involves the high cost and maintenance of the equipments that are involved in the food service industries. Consumers prefer food that requires less time and effort to prepare while also provides nutrition and quality. The food safety standards should be strictly maintained by food service providers which is time consuming and cost ineffective therefore all the above factors are hindering the market growth.
Covid-19 Impact
The Covid-19 pandemic has a significant effect on the food service equipment manufacturing industry across the world, affecting major food business in all over the regions. The entire food service industry is fighting the crisis, disruption of food supplies, minimized lack of food customs over the outbreak period. Moreover, consumers were concerned that the food service industries would infect the person with infection and there has been a shutdown in the market.
The kitchen purpose equipment segment is expected to be the largest during the forecast period
The kitchen purpose equipment segment is estimated to have a lucrative growth, due to major use of these appliances for cooking, storage and cleaning functions within the kitchen. Electric kitchen appliance the market, yet cooking fuel, renewable energy, and solar energy also play an important role for operating kitchenware appliances. Stove, refrigerator, and dishwasher are some of the major devices used in the kitchen. These appliances also consist of blenders, food processors, and coffee makers, usually designed for countertops. They are less expensive and used for specific cooking purposes. They are gaining popularity among the consumers owing to changes in lifestyles of people due to significant increase in disposable income which is boosting the market growth.
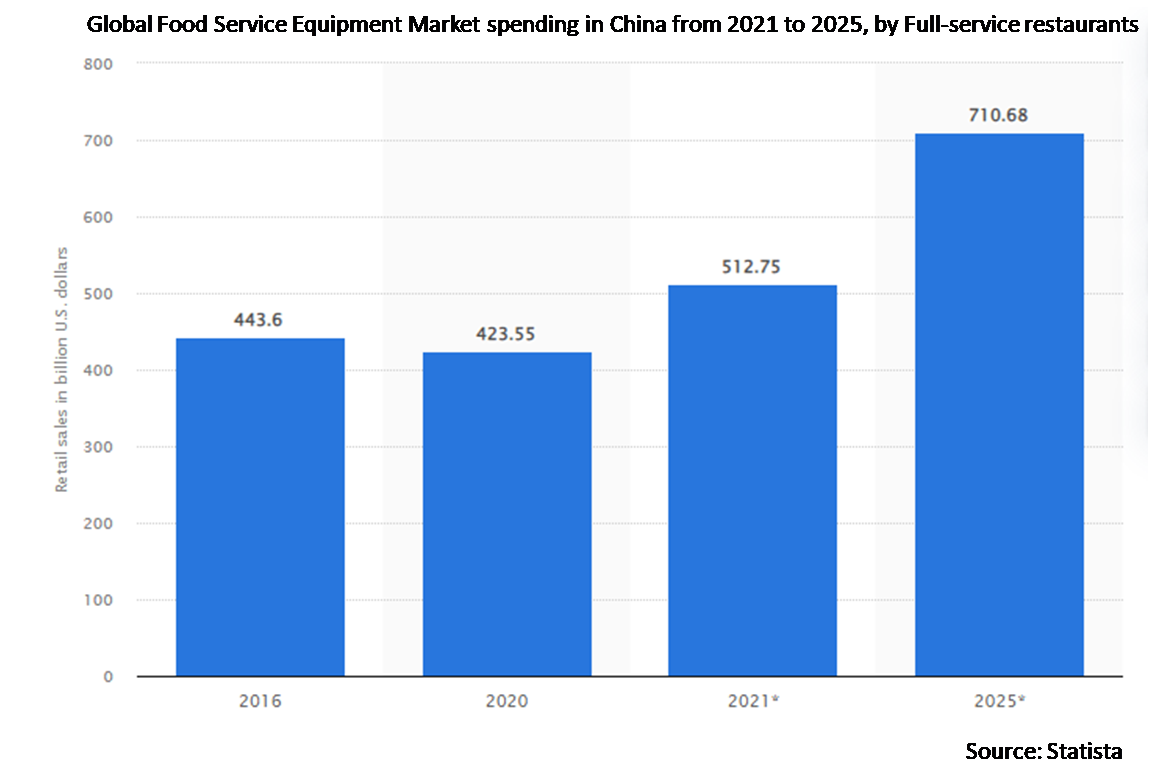
The full-service restaurants segment is expected to have the highest CAGR during the forecast period
The full-service restaurants segment is anticipated to witness the fastest CAGR growth during the forecast period, due to the service that is provided at the restaurants. This industry group consists establishments primarily engaged in providing food services to customers who order and are served while seated and pay after eating, or who order or select items at a counter, food bar or cafeteria line and pay before eating. This industry group includes drinking places that primarily serve food. Now a day’s full service restaurants has been rising at an inclining pace.
Region with highest share:
Asia Pacific is projected to hold the largest market share during the forecast period owing to The quick transformation of dining habits and the extension of tourism, mainly in Singapore, Malaysia, Indonesia, and Australia, have fuelled the growth of food service equipment with in this region. As more people try new meals and like other cuisines, the restaurant's menu has expanded to cover a variety of cuisines.
Region with highest CAGR:
North America is projected to have the highest CAGR over the forecast period, owing to the growing food service industry, escalating saturation of online retail, and growing consumer focus on takeaway due to busier lifestyles. The high saturation of online food delivery services in the region, together with the popularity of quick-service restaurants in countries such as the U.S. and Canada owing to the busy lifestyle of consumers, is propelling the demand for food service in the North American region. An increasing number of quick service restaurants as they can be established in limited spaces are promoting the regional market growth.

Key players in the market
Some of the key players profiled in the Food Service Equipment Market include Ali Group, Alto-Shaam, Inc., Cambro Manufacturing Co. Inc., Castle Stove, Haier Group, SMEG S.p.A., The Middleby Corporation, Electrolux Professional, Illinois Tool Works Inc, Duke Manufacturing Co. Inc., Dover Corporation, Panasonic Corporation
Key Developments:
In July 2022, Ali Group Completes Acquisition of Welbilt one of the largest and most diversified global leaders in the foodservice equipment industry, today announced that it has completed its previously announced acquisition of Welbilt, Inc. With the completion of the transaction, Welbilt’s common stock has ceased trading as of the close of trading on July 28, 2022 and is no longer listed on the New York Stock Exchange.
In December 2021, Unified Brands Inc and related assets were acquired by Electrolux Professional. Electrolux Professional’s presence in the United States will be greatly strengthened as a result of the purchase. On October 12, 2021, the deal was made public. On a cash and debt-free basis, the purchase price is SEK 2,140 million (USD 244 million), plus various tax benefits.
In September 2021, Duke Manufacturing launched Readyflex holding units in the UK market. These units are designed to offer operators many advantages and make their working lives easier. Moreover, these units seamlessly interact with the third-party cloud and on-site solutions.
Products Covered:
• Kitchen Purpose Equipment
• Food Holding & Storing Equipment
• Ware Washing Equipment
• Refrigeration Equipment
• Other Products
Applications Covered:
• Full-Service Restaurants
• Quick Service Restaurants
• Commercial Canteen
• Other Applications
Distribution Channels Covered:
• Online
• Offline
• Other Distribution Channels
Regions Covered:
• North America
o US
o Canada
o Mexico
• Europe
o Germany
o UK
o Italy
o France
o Spain
o Rest of Europe
• Asia Pacific
o Japan
o China
o India
o Australia
o New Zealand
o South Korea
o Rest of Asia Pacific
• South America
o Argentina
o Brazil
o Chile
o Rest of South America
• Middle East & Africa
o Saudi Arabia
o UAE
o Qatar
o South Africa
o Rest of Middle East & Africa
What our report offers:
- Market share assessments for the regional and country-level segments
- Strategic recommendations for the new entrants
- Covers Market data for the years 2020, 2021, 2022, 2025, and 2028
- Market Trends (Drivers, Constraints, Opportunities, Threats, Challenges, Investment Opportunities, and recommendations)
- Strategic recommendations in key business segments based on the market estimations
- Competitive landscaping mapping the key common trends
- Company profiling with detailed strategies, financials, and recent developments
- Supply chain trends mapping the latest technological advancements
Free Customization Offerings:
All the customers of this report will be entitled to receive one of the following free customization options:
• Company Profiling
o Comprehensive profiling of additional market players (up to 3)
o SWOT Analysis of key players (up to 3)
• Regional Segmentation
o Market estimations, Forecasts and CAGR of any prominent country as per the client's interest (Note: Depends on feasibility check)
• Competitive Benchmarking
o Benchmarking of key players based on product portfolio, geographical presence, and strategic alliances
Table of Contents
1 Executive Summary
2 Preface
2.1 Abstract
2.2 Stake Holders
2.3 Research Scope
2.4 Research Methodology
2.4.1 Data Mining
2.4.2 Data Analysis
2.4.3 Data Validation
2.4.4 Research Approach
2.5 Research Sources
2.5.1 Primary Research Sources
2.5.2 Secondary Research Sources
2.5.3 Assumptions
3 Market Trend Analysis
3.1 Introduction
3.2 Drivers
3.3 Restraints
3.4 Opportunities
3.5 Threats
3.6 Product Analysis
3.7 Application Analysis
3.8 Emerging Markets
3.9 Impact of Covid-19
4 Porters Five Force Analysis
4.1 Bargaining power of suppliers
4.2 Bargaining power of buyers
4.3 Threat of substitutes
4.4 Threat of new entrants
4.5 Competitive rivalry
5 Global Food Service Equipment Market, By Product
5.1 Introduction
5.2 Kitchen Purpose Equipment
5.2.1 Cooking Equipment
5.2.2 Food & Beverage Preparation Equipment
5.3 Food Holding & Storing Equipment
5.4 Ware Washing Equipment
5.5 Refrigeration Equipment
5.6 Other Products
6 Global Food Service Equipment Market, By Application
6.1 Introduction
6.2 Full-Service Restaurants
6.3 Quick Service Restaurants
6.4 Commercial Canteen
6.5 Other Applications
7 Global Food Service Equipment Market, By Distribution Channel
7.1 Introduction
7.2 Online
7.3 Offline
7.4 Other Distribution Channels
8 Global Food Service Equipment Market, By Geography
8.1 Introduction
8.2 North America
8.2.1 US
8.2.2 Canada
8.2.3 Mexico
8.3 Europe
8.3.1 Germany
8.3.2 UK
8.3.3 Italy
8.3.4 France
8.3.5 Spain
8.3.6 Rest of Europe
8.4 Asia Pacific
8.4.1 Japan
8.4.2 China
8.4.3 India
8.4.4 Australia
8.4.5 New Zealand
8.4.6 South Korea
8.4.7 Rest of Asia Pacific
8.5 South America
8.5.1 Argentina
8.5.2 Brazil
8.5.3 Chile
8.5.4 Rest of South America
8.6 Middle East & Africa
8.6.1 Saudi Arabia
8.6.2 UAE
8.6.3 Qatar
8.6.4 South Africa
8.6.5 Rest of Middle East & Africa
9 Key Developments
9.1 Agreements, Partnerships, Collaborations and Joint Ventures
9.2 Acquisitions & Mergers
9.3 New Product Launch
9.4 Expansions
9.5 Other Key Strategies
10 Company Profiling
10.1 Ali Group
10.2 Alto-Shaam, Inc.
10.3 Cambro Manufacturing Co. Inc.
10.4 Castle Stove
10.5 Haier Group
10.6 SMEG S.p.A.
10.7 The Middleby Corporation
10.8 Electrolux Professional
10.9 Illinois Tool Works Inc.
10.10 Duke Manufacturing Co. Inc.
10.11 Dover Corporation
10.12 Panasonic Corporation
List of Tables
Table 1 Global Food Service Equipment Market Outlook, By Region (2020-2028) ($MN)
Table 2 Global Food Service Equipment Market Outlook, By Product (2020-2028) ($MN)
Table 3 Global Food Service Equipment Market Outlook, By Kitchen Purpose Equipment (2020-2028) ($MN)
Table 4 Global Food Service Equipment Market Outlook, By Cooking Equipment (2020-2028) ($MN)
Table 5 Global Food Service Equipment Market Outlook, By Food & Beverage Preparation Equipment (2020-2028) ($MN)
Table 6 Global Food Service Equipment Market Outlook, By Food Holding & Storing Equipment (2020-2028) ($MN)
Table 7 Global Food Service Equipment Market Outlook, By Ware Washing Equipment (2020-2028) ($MN)
Table 8 Global Food Service Equipment Market Outlook, By Refrigeration Equipment (2020-2028) ($MN)
Table 9 Global Food Service Equipment Market Outlook, By Other Products (2020-2028) ($MN)
Table 10 Global Food Service Equipment Market Outlook, By Application (2020-2028) ($MN)
Table 11 Global Food Service Equipment Market Outlook, By Full-Service Restaurants (2020-2028) ($MN)
Table 12 Global Food Service Equipment Market Outlook, By Quick Service Restaurants (2020-2028) ($MN)
Table 13 Global Food Service Equipment Market Outlook, By Commercial Canteen (2020-2028) ($MN)
Table 14 Global Food Service Equipment Market Outlook, By Other Applications (2020-2028) ($MN)
Table 15 Global Food Service Equipment Market Outlook, By Distribution Channel (2020-2028) ($MN)
Table 16 Global Food Service Equipment Market Outlook, By Online (2020-2028) ($MN)
Table 17 Global Food Service Equipment Market Outlook, By Offline (2020-2028) ($MN)
Table 18 Global Food Service Equipment Market Outlook, By Other Distribution Channels (2020-2028) ($MN)
Table 19 North America Food Service Equipment Market Outlook, By Country (2020-2028) ($MN)
Table 20 North America Food Service Equipment Market Outlook, By Product (2020-2028) ($MN)
Table 21 North America Food Service Equipment Market Outlook, By Kitchen Purpose Equipment (2020-2028) ($MN)
Table 22 North America Food Service Equipment Market Outlook, By Cooking Equipment (2020-2028) ($MN)
Table 23 North America Food Service Equipment Market Outlook, By Food & Beverage Preparation Equipment (2020-2028) ($MN)
Table 24 North America Food Service Equipment Market Outlook, By Food Holding & Storing Equipment (2020-2028) ($MN)
Table 25 North America Food Service Equipment Market Outlook, By Ware Washing Equipment (2020-2028) ($MN)
Table 26 North America Food Service Equipment Market Outlook, By Refrigeration Equipment (2020-2028) ($MN)
Table 27 North America Food Service Equipment Market Outlook, By Other Products (2020-2028) ($MN)
Table 28 North America Food Service Equipment Market Outlook, By Application (2020-2028) ($MN)
Table 29 North America Food Service Equipment Market Outlook, By Full-Service Restaurants (2020-2028) ($MN)
Table 30 North America Food Service Equipment Market Outlook, By Quick Service Restaurants (2020-2028) ($MN)
Table 31 North America Food Service Equipment Market Outlook, By Commercial Canteen (2020-2028) ($MN)
Table 32 North America Food Service Equipment Market Outlook, By Other Applications (2020-2028) ($MN)
Table 33 North America Food Service Equipment Market Outlook, By Distribution Channel (2020-2028) ($MN)
Table 34 North America Food Service Equipment Market Outlook, By Online (2020-2028) ($MN)
Table 35 North America Food Service Equipment Market Outlook, By Offline (2020-2028) ($MN)
Table 36 North America Food Service Equipment Market Outlook, By Other Distribution Channels (2020-2028) ($MN)
Table 37 Europe Food Service Equipment Market Outlook, By Country (2020-2028) ($MN)
Table 38 Europe Food Service Equipment Market Outlook, By Product (2020-2028) ($MN)
Table 39 Europe Food Service Equipment Market Outlook, By Kitchen Purpose Equipment (2020-2028) ($MN)
Table 40 Europe Food Service Equipment Market Outlook, By Cooking Equipment (2020-2028) ($MN)
Table 41 Europe Food Service Equipment Market Outlook, By Food & Beverage Preparation Equipment (2020-2028) ($MN)
Table 42 Europe Food Service Equipment Market Outlook, By Food Holding & Storing Equipment (2020-2028) ($MN)
Table 43 Europe Food Service Equipment Market Outlook, By Ware Washing Equipment (2020-2028) ($MN)
Table 44 Europe Food Service Equipment Market Outlook, By Refrigeration Equipment (2020-2028) ($MN)
Table 45 Europe Food Service Equipment Market Outlook, By Other Products (2020-2028) ($MN)
Table 46 Europe Food Service Equipment Market Outlook, By Application (2020-2028) ($MN)
Table 47 Europe Food Service Equipment Market Outlook, By Full-Service Restaurants (2020-2028) ($MN)
Table 48 Europe Food Service Equipment Market Outlook, By Quick Service Restaurants (2020-2028) ($MN)
Table 49 Europe Food Service Equipment Market Outlook, By Commercial Canteen (2020-2028) ($MN)
Table 50 Europe Food Service Equipment Market Outlook, By Other Applications (2020-2028) ($MN)
Table 51 Europe Food Service Equipment Market Outlook, By Distribution Channel (2020-2028) ($MN)
Table 52 Europe Food Service Equipment Market Outlook, By Online (2020-2028) ($MN)
Table 53 Europe Food Service Equipment Market Outlook, By Offline (2020-2028) ($MN)
Table 54 Europe Food Service Equipment Market Outlook, By Other Distribution Channels (2020-2028) ($MN)
Table 55 Asia Pacific Food Service Equipment Market Outlook, By Country (2020-2028) ($MN)
Table 56 Asia Pacific Food Service Equipment Market Outlook, By Product (2020-2028) ($MN)
Table 57 Asia Pacific Food Service Equipment Market Outlook, By Kitchen Purpose Equipment (2020-2028) ($MN)
Table 58 Asia Pacific Food Service Equipment Market Outlook, By Cooking Equipment (2020-2028) ($MN)
Table 59 Asia Pacific Food Service Equipment Market Outlook, By Food & Beverage Preparation Equipment (2020-2028) ($MN)
Table 60 Asia Pacific Food Service Equipment Market Outlook, By Food Holding & Storing Equipment (2020-2028) ($MN)
Table 61 Asia Pacific Food Service Equipment Market Outlook, By Ware Washing Equipment (2020-2028) ($MN)
Table 62 Asia Pacific Food Service Equipment Market Outlook, By Refrigeration Equipment (2020-2028) ($MN)
Table 63 Asia Pacific Food Service Equipment Market Outlook, By Other Products (2020-2028) ($MN)
Table 64 Asia Pacific Food Service Equipment Market Outlook, By Application (2020-2028) ($MN)
Table 65 Asia Pacific Food Service Equipment Market Outlook, By Full-Service Restaurants (2020-2028) ($MN)
Table 66 Asia Pacific Food Service Equipment Market Outlook, By Quick Service Restaurants (2020-2028) ($MN)
Table 67 Asia Pacific Food Service Equipment Market Outlook, By Commercial Canteen (2020-2028) ($MN)
Table 68 Asia Pacific Food Service Equipment Market Outlook, By Other Applications (2020-2028) ($MN)
Table 69 Asia Pacific Food Service Equipment Market Outlook, By Distribution Channel (2020-2028) ($MN)
Table 70 Asia Pacific Food Service Equipment Market Outlook, By Online (2020-2028) ($MN)
Table 71 Asia Pacific Food Service Equipment Market Outlook, By Offline (2020-2028) ($MN)
Table 72 Asia Pacific Food Service Equipment Market Outlook, By Other Distribution Channels (2020-2028) ($MN)
Table 73 South America Food Service Equipment Market Outlook, By Country (2020-2028) ($MN)
Table 74 South America Food Service Equipment Market Outlook, By Product (2020-2028) ($MN)
Table 75 South America Food Service Equipment Market Outlook, By Kitchen Purpose Equipment (2020-2028) ($MN)
Table 76 South America Food Service Equipment Market Outlook, By Cooking Equipment (2020-2028) ($MN)
Table 77 South America Food Service Equipment Market Outlook, By Food & Beverage Preparation Equipment (2020-2028) ($MN)
Table 78 South America Food Service Equipment Market Outlook, By Food Holding & Storing Equipment (2020-2028) ($MN)
Table 79 South America Food Service Equipment Market Outlook, By Ware Washing Equipment (2020-2028) ($MN)
Table 80 South America Food Service Equipment Market Outlook, By Refrigeration Equipment (2020-2028) ($MN)
Table 81 South America Food Service Equipment Market Outlook, By Other Products (2020-2028) ($MN)
Table 82 South America Food Service Equipment Market Outlook, By Application (2020-2028) ($MN)
Table 83 South America Food Service Equipment Market Outlook, By Full-Service Restaurants (2020-2028) ($MN)
Table 84 South America Food Service Equipment Market Outlook, By Quick Service Restaurants (2020-2028) ($MN)
Table 85 South America Food Service Equipment Market Outlook, By Commercial Canteen (2020-2028) ($MN)
Table 86 South America Food Service Equipment Market Outlook, By Other Applications (2020-2028) ($MN)
Table 87 South America Food Service Equipment Market Outlook, By Distribution Channel (2020-2028) ($MN)
Table 88 South America Food Service Equipment Market Outlook, By Online (2020-2028) ($MN)
Table 89 South America Food Service Equipment Market Outlook, By Offline (2020-2028) ($MN)
Table 90 South America Food Service Equipment Market Outlook, By Other Distribution Channels (2020-2028) ($MN)
Table 91 Middle East & Africa Food Service Equipment Market Outlook, By Country (2020-2028) ($MN)
Table 92 Middle East & Africa Food Service Equipment Market Outlook, By Product (2020-2028) ($MN)
Table 93 Middle East & Africa Food Service Equipment Market Outlook, By Kitchen Purpose Equipment (2020-2028) ($MN)
Table 94 Middle East & Africa Food Service Equipment Market Outlook, By Cooking Equipment (2020-2028) ($MN)
Table 95 Middle East & Africa Food Service Equipment Market Outlook, By Food & Beverage Preparation Equipment (2020-2028) ($MN)
Table 96 Middle East & Africa Food Service Equipment Market Outlook, By Food Holding & Storing Equipment (2020-2028) ($MN)
Table 97 Middle East & Africa Food Service Equipment Market Outlook, By Ware Washing Equipment (2020-2028) ($MN)
Table 98 Middle East & Africa Food Service Equipment Market Outlook, By Refrigeration Equipment (2020-2028) ($MN)
Table 99 Middle East & Africa Food Service Equipment Market Outlook, By Other Products (2020-2028) ($MN)
Table 100 Middle East & Africa Food Service Equipment Market Outlook, By Application (2020-2028) ($MN)
Table 101 Middle East & Africa Food Service Equipment Market Outlook, By Full-Service Restaurants (2020-2028) ($MN)
Table 102 Middle East & Africa Food Service Equipment Market Outlook, By Quick Service Restaurants (2020-2028) ($MN)
Table 103 Middle East & Africa Food Service Equipment Market Outlook, By Commercial Canteen (2020-2028) ($MN)
Table 104 Middle East & Africa Food Service Equipment Market Outlook, By Other Applications (2020-2028) ($MN)
Table 105 Middle East & Africa Food Service Equipment Market Outlook, By Distribution Channel (2020-2028) ($MN)
Table 106 Middle East & Africa Food Service Equipment Market Outlook, By Online (2020-2028) ($MN)
Table 107 Middle East & Africa Food Service Equipment Market Outlook, By Offline (2020-2028) ($MN)
Table 108 Middle East & Africa Food Service Equipment Market Outlook, By Other Distribution Channels (2020-2028) ($MN)
List of Figures
RESEARCH METHODOLOGY

We at ‘Stratistics’ opt for an extensive research approach which involves data mining, data validation, and data analysis. The various research sources include in-house repository, secondary research, competitor’s sources, social media research, client internal data, and primary research.
Our team of analysts prefers the most reliable and authenticated data sources in order to perform the comprehensive literature search. With access to most of the authenticated data bases our team highly considers the best mix of information through various sources to obtain extensive and accurate analysis.
Each report takes an average time of a month and a team of 4 industry analysts. The time may vary depending on the scope and data availability of the desired market report. The various parameters used in the market assessment are standardized in order to enhance the data accuracy.
Data Mining
The data is collected from several authenticated, reliable, paid and unpaid sources and is filtered depending on the scope & objective of the research. Our reports repository acts as an added advantage in this procedure. Data gathering from the raw material suppliers, distributors and the manufacturers is performed on a regular basis, this helps in the comprehensive understanding of the products value chain. Apart from the above mentioned sources the data is also collected from the industry consultants to ensure the objective of the study is in the right direction.
Market trends such as technological advancements, regulatory affairs, market dynamics (Drivers, Restraints, Opportunities and Challenges) are obtained from scientific journals, market related national & international associations and organizations.
Data Analysis
From the data that is collected depending on the scope & objective of the research the data is subjected for the analysis. The critical steps that we follow for the data analysis include:
- Product Lifecycle Analysis
- Competitor analysis
- Risk analysis
- Porters Analysis
- PESTEL Analysis
- SWOT Analysis
The data engineering is performed by the core industry experts considering both the Marketing Mix Modeling and the Demand Forecasting. The marketing mix modeling makes use of multiple-regression techniques to predict the optimal mix of marketing variables. Regression factor is based on a number of variables and how they relate to an outcome such as sales or profits.
Data Validation
The data validation is performed by the exhaustive primary research from the expert interviews. This includes telephonic interviews, focus groups, face to face interviews, and questionnaires to validate our research from all aspects. The industry experts we approach come from the leading firms, involved in the supply chain ranging from the suppliers, distributors to the manufacturers and consumers so as to ensure an unbiased analysis.
We are in touch with more than 15,000 industry experts with the right mix of consultants, CEO's, presidents, vice presidents, managers, experts from both supply side and demand side, executives and so on.
The data validation involves the primary research from the industry experts belonging to:
- Leading Companies
- Suppliers & Distributors
- Manufacturers
- Consumers
- Industry/Strategic Consultants
Apart from the data validation the primary research also helps in performing the fill gap research, i.e. providing solutions for the unmet needs of the research which helps in enhancing the reports quality.
For more details about research methodology, kindly write to us at info@strategymrc.com
Frequently Asked Questions
In case of any queries regarding this report, you can contact the customer service by filing the “Inquiry Before Buy” form available on the right hand side. You may also contact us through email: info@strategymrc.com or phone: +1-301-202-5929
Yes, the samples are available for all the published reports. You can request them by filling the “Request Sample” option available in this page.
Yes, you can request a sample with your specific requirements. All the customized samples will be provided as per the requirement with the real data masked.
All our reports are available in Digital PDF format. In case if you require them in any other formats, such as PPT, Excel etc you can submit a request through “Inquiry Before Buy” form available on the right hand side. You may also contact us through email: info@strategymrc.com or phone: +1-301-202-5929
We offer a free 15% customization with every purchase. This requirement can be fulfilled for both pre and post sale. You may send your customization requirements through email at info@strategymrc.com or call us on +1-301-202-5929.
We have 3 different licensing options available in electronic format.
- Single User Licence: Allows one person, typically the buyer, to have access to the ordered product. The ordered product cannot be distributed to anyone else.
- 2-5 User Licence: Allows the ordered product to be shared among a maximum of 5 people within your organisation.
- Corporate License: Allows the product to be shared among all employees of your organisation regardless of their geographical location.
All our reports are typically be emailed to you as an attachment.
To order any available report you need to register on our website. The payment can be made either through CCAvenue or PayPal payments gateways which accept all international cards.
We extend our support to 6 months post sale. A post sale customization is also provided to cover your unmet needs in the report.
Request Customization
We offer complimentary customization of up to 15% with every purchase. To share your customization requirements, feel free to email us at info@strategymrc.com or call us on +1-301-202-5929. .
Please Note: Customization within the 15% threshold is entirely free of charge. If your request exceeds this limit, we will conduct a feasibility assessment. Following that, a detailed quote and timeline will be provided.
WHY CHOOSE US ?

Assured Quality
Best in class reports with high standard of research integrity

24X7 Research Support
Continuous support to ensure the best customer experience.

Free Customization
Adding more values to your product of interest.

Safe & Secure Access
Providing a secured environment for all online transactions.

Trusted by 600+ Brands
Serving the most reputed brands across the world.