
Food Service Market
Food Service Market Forecasts to 2028 - Global Analysis By Type (Quick Service Restaurants, Full Service Restaurants and other Types), Service Type (Commercial, Institutional and Other Service Type), System (Conventional Foodservice System, Centralized Foodservice System and Other Systems) and Geography

|
Years Covered |
2020-2028 |
|
Estimated Year Value (2022) |
US $2880.1 BN |
|
Projected Year Value (2028) |
US $4039.4 BN |
|
CAGR (2022 - 2028) |
5.8% |
|
Regions Covered |
North America, Europe, Asia Pacific, South America, and Middle East & Africa |
|
Countries Covered |
US, Canada, Mexico, Germany, UK, Italy, France, Spain, Japan, China, India, Australia, New Zealand, South Korea, Rest of Asia Pacific, South America, Argentina, Brazil, Chile, Middle East & Africa, Saudi Arabia, UAE, Qatar, and South Africa |
|
Largest Market |
Europe |
|
Fastest Growing Market |
North America |
According to Stratistics MRC, the Global Food Service Market is accounted for $2880.1 billion in 2022 and is expected to reach $4039.4 billion by 2028 growing at a CAGR of 5.8% during the forecast period. The sale of prepared meals and drinks for immediate consumption, takeout, and home delivery is referred to as foodservice. Commercial establishments, which include fast-food restaurants, catering, nightclubs, and recreational outlets, are divided into two sectors that provide foodservice. Non-commercial establishments, such as restaurants operating inside of institutions like hospitals, schools, and military bases.
The food service industry can be divided into conventional and nonconventional systems based on how the components are put together, cooked, and served. The manufacture of food is centralised under this method, and it is subsequently delivered to the kitchens at various places. Both ready prepared systems where the food is made on site and kept cold or frozen until needed and assembly-serve systems where pre-made meals are bought, stored, put together, and supplied to the customer.
According to the National Restaurant Association of India (NRAI), 25% of restaurants closed shop completely in FY21, resulting in over 2.3 million jobs lost.
Market Dynamics:
Driver:
Increased presence of the food services institutions
The rise in the trend of eating out has led to changes in the food service industry. The use of cutting-edge methods and tools has also aided food service providers in raising production and streamlining operations to improve overall effectiveness. The rapid urbanisation and migration have exposed consumers to a wide variety of cuisines. Additionally, this industry has expanded as a result of the rise in ethnic cuisine ads and consumer interest in other cuisines. The creation of new business types that cater to the food needs of institutions including corporate offices, nursing homes, orphanages, and hospitals is further aided by the emergence of these businesses.
Restraint:
Negative impacts of online food delivery
Customers are reluctant to adopt online food ordering because of some of its drawbacks. There are some hiccups with meal delivery in addition to all the other advantages. One issue, for instance, is that when ordering meals online, the quality of the food that is delivered is frequently poorer than the quality of the meal in a restaurant. Home delivery apps also struggle when there is a lot of network load. Additionally, food from delivery services is sometimes bundled in plastic, which is typically less appetising than the food that is properly arranged on your plate in a restaurant.
Opportunity:
Increased expenditure on dining out
The increase in dual-income households and rising restaurant spending has contributed to the expansion of the global market. Additionally, both developing and developed regions have become more popular with the quick spread of diverse food service establishments. The millennial generation's increased propensity for fast food consumption habits has led to an increase in their spending at quick service restaurants, including franchises. Along with rising domestic consumer spending, tourists' expenditures on lodging and dining also help to fuel the expansion of numerous regional economies. In order to draw tourists from particular nations, hotels and restaurants are introducing a variety of new cuisine varieties in local marketplaces as the tourism sector has grown over the past few years.
Threat:
Change in customer taste and high cost of ingredients
The challenge for businesses in this area is adapting to changing consumer preferences. People's preferences alter over time, so it's critical for businesses to monitor what's trending and modify their menus as necessary. It can be challenging to maintain reasonable costs while maintaining the quality of the items; this calls for careful negotiation and balancing between vendors or suppliers. The price of ingredients and supplies is another issue because they have the power to make or break a company. To continue to be profitable, businesses must carefully manage their resources and keep abreast of market developments. The labour costs involved in operating a food service company are another expense that can be challenging to handle without adequate preparation.
Covid-19 Impact
The COVID-19 outbreak posed exceptional difficulties for the entire food service supply chain. The COVID-19 had an impact on consumer demand as well as farm production, food processing, food service, transportation, and logistics. The availability of seasonal employees for planting and harvesting in the fruit and vegetable industry has been limited in several countries due to limits on people's mobility. Quarantine regulations and backlogs in border inspections have an impact on the fruits and vegetable industry as well. As a result, the preparation of meals in restaurants, catering services, and hotel services was impacted by the paucity of raw ingredients.
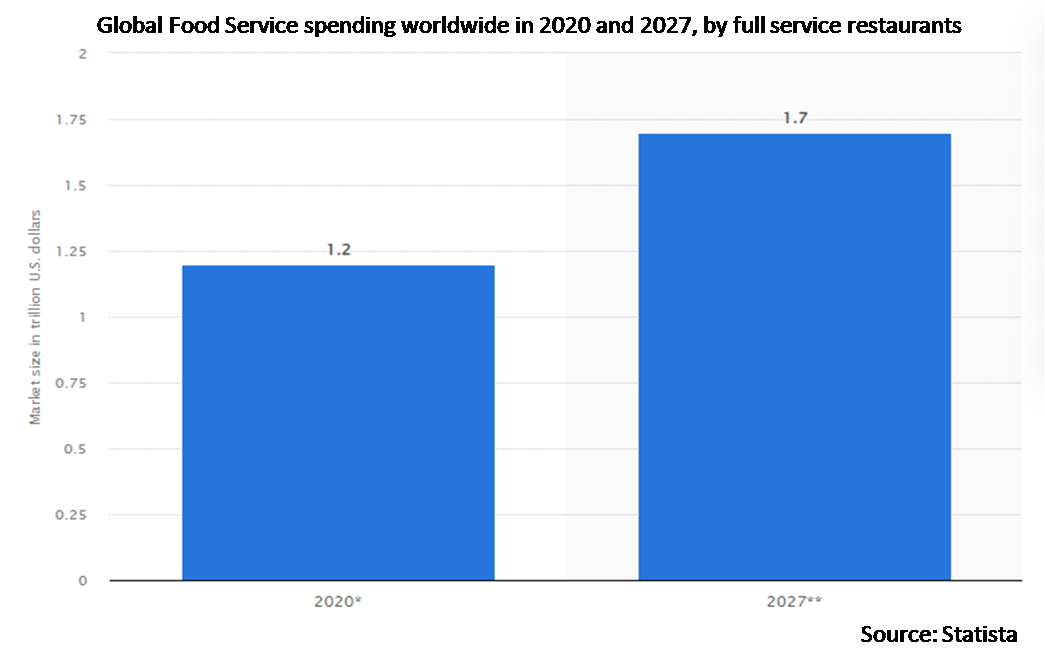
The full service restaurants segment is expected to be the largest during the forecast period
The full service restaurants segment is estimated to have a lucrative growth. The term "full service restaurants" refers to sit-down venues that offer a full meal menu and provide table service to guests. Breakfast, lunch, and dinner may all be options on their menus, which come in various selection categories. The two types of restaurants that contribute most to this segment are fine dining establishments and casual dining eateries.
The commercial segment is expected to have the highest CAGR during the forecast period
The commercial segment is anticipated to witness the fastest CAGR growth during the forecast period. The eating out/takeaway edible service systems, quick service restaurants, and full service restaurants are all included in the commercial section. Examples of commercial edible services include eateries, cafes, fast food chains, food trucks, and online food ordering. The commercial food service sector has existed from the beginning of the industry. Families are having more discretionary income, thus customers are spending more money at hotels, restaurants, cafes, and other establishments.
Region with highest share:
Europe is projected to hold the largest market share during the forecast period. Europe is a major player in the worldwide market, and the hospitality sector is quite important there. Additionally, there are many career opportunities in the hotel sector for visitors to Europe. The expanding trend of eating out and a busier lifestyle, which boosts demand for prepared food items, are contributing factors to the expansion of the European food service business.
Region with highest CAGR:
North America is projected to have the highest CAGR over the forecast period, owing to the rising operating costs of food service businesses. The profit margins of the companies are under a lot of pressure due to the increase in labour costs and the cost of raw materials. As a result, there is a strong push for automation and digitization in the industrial and service sectors. One of the top self-driving delivery start-ups, Nuro, collaborated with Domino's to build an autonomous pizza delivery system in Houston. Prepaid orders from customers are accepted, and Nuro R2 Robots then deliver the goods to the recipients.

Key players in the market
Some of the key players profiled in the Food Service Market include Starbucks, Yum! Brands, Inc., Restaurant Brands International Inc., McDonald's, The Wendy’s Company, Bloomin’ Brands, Inc., Domino's, Chipotle Mexican Grill, Inc., Papa John's International, Inc., Darden Restaurants, Inc., Aramark Corporation, Compass Group, Seven & I Holdings Co. Ltd. and Sodexo.
Key Developments:
In May 2022, Outback Steakhouse restaurants planned to launch new restaurants with a modernized look on its dining space. The company launched three new restaurants in Fort Worth, Steele Creek, and Polaris, respectively.
In May 2022, Domino's launched a new product offering named paratha pizza for consumers in India. This fusion dish is available in three flavors, cheese paratha pizza, paneer paratha pizza, and chicken keema paratha pizza.
In March 2022, Starbucks Corporation partnered with one of the leading companies in South East Asia, Grab. It aimed to improve its consumer service through this partnership by serving consumers in the Philippines, Thailand, Singapore, Malaysia, Indonesia, and Vietnam.
In August 2021, Quick service restaurant, Pizza Hut partnered with Hindustan Unilever to add the FMCG firm's Kwality Wall's ice cream and desserts to its dine-in and delivery and takeaway menu in India. With this partnership, Pizza Hut expects to increase its average order value by 10% for orders that have Kwality Wall's ice cream and desserts
In April 2020, In the wake of COVID-19, Domino's Pizza partnered with ITC Foods and launched Domino's Essentials. This service was made available for consumers first in Bengaluru and then in Noida, Mumbai, Kolkata, Chennai, and Hyderabad. This partnership between a QSR and an FMCG company aimed to serve the community by ensuring an uninterrupted supply of essential items without them having to step outside the safety of their homes.
Types Covered:
• Quick Service Restaurants
• Full Service Restaurants
• Street food
• Cafés and bars
• Limited Service Restaurants
• Special Food Services Restaurants
• Institutes
• Other Types
Service Types Covered:
• Commercial
• Institutional
• Other Service Types
Systems Covered:
• Conventional Foodservice System
• Centralized Foodservice System
• Ready Prepared Foodservice System
• Assembly-Serve Foodservice System
• Other Systems
Regions Covered:
• North America
o US
o Canada
o Mexico
• Europe
o Germany
o UK
o Italy
o France
o Spain
o Rest of Europe
• Asia Pacific
o Japan
o China
o India
o Australia
o New Zealand
o South Korea
o Rest of Asia Pacific
• South America
o Argentina
o Brazil
o Chile
o Rest of South America
• Middle East & Africa
o Saudi Arabia
o UAE
o Qatar
o South Africa
o Rest of Middle East & Africa
What our report offers:
- Market share assessments for the regional and country-level segments
- Strategic recommendations for the new entrants
- Covers Market data for the years 2020, 2021, 2022, 2025, and 2028
- Market Trends (Drivers, Constraints, Opportunities, Threats, Challenges, Investment Opportunities, and recommendations)
- Strategic recommendations in key business segments based on the market estimations
- Competitive landscaping mapping the key common trends
- Company profiling with detailed strategies, financials, and recent developments
- Supply chain trends mapping the latest technological advancements
Free Customization Offerings:
All the customers of this report will be entitled to receive one of the following free customization options:
• Company Profiling
o Comprehensive profiling of additional market players (up to 3)
o SWOT Analysis of key players (up to 3)
• Regional Segmentation
o Market estimations, Forecasts and CAGR of any prominent country as per the client's interest (Note: Depends on feasibility check)
• Competitive Benchmarking
o Benchmarking of key players based on product portfolio, geographical presence, and strategic alliances
Table of Contents
1 Executive Summary
2 Preface
2.1 Abstract
2.2 Stake Holders
2.3 Research Scope
2.4 Research Methodology
2.4.1 Data Mining
2.4.2 Data Analysis
2.4.3 Data Validation
2.4.4 Research Approach
2.5 Research Sources
2.5.1 Primary Research Sources
2.5.2 Secondary Research Sources
2.5.3 Assumptions
3 Market Trend Analysis
3.1 Introduction
3.2 Drivers
3.3 Restraints
3.4 Opportunities
3.5 Threats
3.6 Emerging Markets
3.7 Impact of Covid-19
4 Porters Five Force Analysis
4.1 Bargaining power of suppliers
4.2 Bargaining power of buyers
4.3 Threat of substitutes
4.4 Threat of new entrants
4.5 Competitive rivalry
5 Global Food Service Market, By Type
5.1 Introduction
5.2 Quick Service Restaurants
5.3 Full Service Restaurants
5.4 Street food
5.5 Cafés and bars
5.6 Limited Service Restaurants
5.7 Special Food Services Restaurants
5.8 Institutes
5.9 Other Types
6 Global Food Service Market, By Service Type
6.1 Introduction
6.2 Commercial
6.3 Institutional
6.4 Other Service Types
7 Global Food Service Market, By System
7.1 Introduction
7.2 Conventional Foodservice System
7.3 Centralized Foodservice System
7.4 Ready Prepared Foodservice System
7.5 Assembly-Serve Foodservice System
7.6 Other Systems
8 Global Food Service Market, By Geography
8.1 Introduction
8.2 North America
8.2.1 US
8.2.2 Canada
8.2.3 Mexico
8.3 Europe
8.3.1 Germany
8.3.2 UK
8.3.3 Italy
8.3.4 France
8.3.5 Spain
8.3.6 Rest of Europe
8.4 Asia Pacific
8.4.1 Japan
8.4.2 China
8.4.3 India
8.4.4 Australia
8.4.5 New Zealand
8.4.6 South Korea
8.4.7 Rest of Asia Pacific
8.5 South America
8.5.1 Argentina
8.5.2 Brazil
8.5.3 Chile
8.5.4 Rest of South America
8.6 Middle East & Africa
8.6.1 Saudi Arabia
8.6.2 UAE
8.6.3 Qatar
8.6.4 South Africa
8.6.5 Rest of Middle East & Africa
9 Key Developments
9.1 Agreements, Partnerships, Collaborations and Joint Ventures
9.2 Acquisitions & Mergers
9.3 New Product Launch
9.4 Expansions
9.5 Other Key Strategies
10 Company Profiling
10.1 Starbucks
10.2 Yum! Brands, Inc.
10.3 Restaurant Brands International Inc.
10.4 McDonald's
10.5 The Wendy’s Company
10.6 Bloomin’ Brands, Inc.
10.7 Domino's
10.8 Chipotle Mexican Grill, Inc.
10.9 Papa John's International, Inc.
10.10 Darden Restaurants, Inc.
10.11 Aramark Corporation
10.12 Compass Group
10.13 Seven & I Holdings Co. Ltd.
10.14 Sodexo
List of Tables
1 Global Food Service Market Outlook, By Region (2020-2028) ($MN)
2 Global Food Service Market Outlook, By Type (2020-2028) ($MN)
3 Global Food Service Market Outlook, By Quick Service Restaurants (2020-2028) ($MN)
4 Global Food Service Market Outlook, By Full Service Restaurants (2020-2028) ($MN)
5 Global Food Service Market Outlook, By Street food (2020-2028) ($MN)
6 Global Food Service Market Outlook, By Cafés and bars (2020-2028) ($MN)
7 Global Food Service Market Outlook, By Limited Service Restaurants (2020-2028) ($MN)
8 Global Food Service Market Outlook, By Special Food Services Restaurants (2020-2028) ($MN)
9 Global Food Service Market Outlook, By Institutes (2020-2028) ($MN)
10 Global Food Service Market Outlook, By Other Types (2020-2028) ($MN)
11 Global Food Service Market Outlook, By Service Type (2020-2028) ($MN)
12 Global Food Service Market Outlook, By Commercial (2020-2028) ($MN)
13 Global Food Service Market Outlook, By Institutional (2020-2028) ($MN)
14 Global Food Service Market Outlook, By Other Service Types (2020-2028) ($MN)
15 Global Food Service Market Outlook, By System (2020-2028) ($MN)
16 Global Food Service Market Outlook, By Conventional Foodservice System (2020-2028) ($MN)
17 Global Food Service Market Outlook, By Centralized Foodservice System (2020-2028) ($MN)
18 Global Food Service Market Outlook, By Ready Prepared Foodservice System (2020-2028) ($MN)
19 Global Food Service Market Outlook, By Assembly-Serve Foodservice System (2020-2028) ($MN)
20 Global Food Service Market Outlook, By Other Systems (2020-2028) ($MN)
21 North America Food Service Market Outlook, By Country (2020-2028) ($MN)
22 North America Food Service Market Outlook, By Type (2020-2028) ($MN)
23 North America Food Service Market Outlook, By Quick Service Restaurants (2020-2028) ($MN)
24 North America Food Service Market Outlook, By Full Service Restaurants (2020-2028) ($MN)
25 North America Food Service Market Outlook, By Street food (2020-2028) ($MN)
26 North America Food Service Market Outlook, By Cafés and bars (2020-2028) ($MN)
27 North America Food Service Market Outlook, By Limited Service Restaurants (2020-2028) ($MN)
28 North America Food Service Market Outlook, By Special Food Services Restaurants (2020-2028) ($MN)
29 North America Food Service Market Outlook, By Institutes (2020-2028) ($MN)
30 North America Food Service Market Outlook, By Other Types (2020-2028) ($MN)
31 North America Food Service Market Outlook, By Service Type (2020-2028) ($MN)
32 North America Food Service Market Outlook, By Commercial (2020-2028) ($MN)
33 North America Food Service Market Outlook, By Institutional (2020-2028) ($MN)
34 North America Food Service Market Outlook, By Other Service Types (2020-2028) ($MN)
35 North America Food Service Market Outlook, By System (2020-2028) ($MN)
36 North America Food Service Market Outlook, By Conventional Foodservice System (2020-2028) ($MN)
37 North America Food Service Market Outlook, By Centralized Foodservice System (2020-2028) ($MN)
38 North America Food Service Market Outlook, By Ready Prepared Foodservice System (2020-2028) ($MN)
39 North America Food Service Market Outlook, By Assembly-Serve Foodservice System (2020-2028) ($MN)
40 North America Food Service Market Outlook, By Other Systems (2020-2028) ($MN)
41 Europe Food Service Market Outlook, By Country (2020-2028) ($MN)
42 Europe Food Service Market Outlook, By Type (2020-2028) ($MN)
43 Europe Food Service Market Outlook, By Quick Service Restaurants (2020-2028) ($MN)
44 Europe Food Service Market Outlook, By Full Service Restaurants (2020-2028) ($MN)
45 Europe Food Service Market Outlook, By Street food (2020-2028) ($MN)
46 Europe Food Service Market Outlook, By Cafés and bars (2020-2028) ($MN)
47 Europe Food Service Market Outlook, By Limited Service Restaurants (2020-2028) ($MN)
48 Europe Food Service Market Outlook, By Special Food Services Restaurants (2020-2028) ($MN)
49 Europe Food Service Market Outlook, By Institutes (2020-2028) ($MN)
50 Europe Food Service Market Outlook, By Other Types (2020-2028) ($MN)
51 Europe Food Service Market Outlook, By Service Type (2020-2028) ($MN)
52 Europe Food Service Market Outlook, By Commercial (2020-2028) ($MN)
53 Europe Food Service Market Outlook, By Institutional (2020-2028) ($MN)
54 Europe Food Service Market Outlook, By Other Service Types (2020-2028) ($MN)
55 Europe Food Service Market Outlook, By System (2020-2028) ($MN)
56 Europe Food Service Market Outlook, By Conventional Foodservice System (2020-2028) ($MN)
57 Europe Food Service Market Outlook, By Centralized Foodservice System (2020-2028) ($MN)
58 Europe Food Service Market Outlook, By Ready Prepared Foodservice System (2020-2028) ($MN)
59 Europe Food Service Market Outlook, By Assembly-Serve Foodservice System (2020-2028) ($MN)
60 Europe Food Service Market Outlook, By Other Systems (2020-2028) ($MN)
61 Asia Pacific Food Service Market Outlook, By Country (2020-2028) ($MN)
62 Asia Pacific Food Service Market Outlook, By Type (2020-2028) ($MN)
63 Asia Pacific Food Service Market Outlook, By Quick Service Restaurants (2020-2028) ($MN)
64 Asia Pacific Food Service Market Outlook, By Full Service Restaurants (2020-2028) ($MN)
65 Asia Pacific Food Service Market Outlook, By Street food (2020-2028) ($MN)
66 Asia Pacific Food Service Market Outlook, By Cafés and bars (2020-2028) ($MN)
67 Asia Pacific Food Service Market Outlook, By Limited Service Restaurants (2020-2028) ($MN)
68 Asia Pacific Food Service Market Outlook, By Special Food Services Restaurants (2020-2028) ($MN)
69 Asia Pacific Food Service Market Outlook, By Institutes (2020-2028) ($MN)
70 Asia Pacific Food Service Market Outlook, By Other Types (2020-2028) ($MN)
71 Asia Pacific Food Service Market Outlook, By Service Type (2020-2028) ($MN)
72 Asia Pacific Food Service Market Outlook, By Commercial (2020-2028) ($MN)
73 Asia Pacific Food Service Market Outlook, By Institutional (2020-2028) ($MN)
74 Asia Pacific Food Service Market Outlook, By Other Service Types (2020-2028) ($MN)
75 Asia Pacific Food Service Market Outlook, By System (2020-2028) ($MN)
76 Asia Pacific Food Service Market Outlook, By Conventional Foodservice System (2020-2028) ($MN)
77 Asia Pacific Food Service Market Outlook, By Centralized Foodservice System (2020-2028) ($MN)
78 Asia Pacific Food Service Market Outlook, By Ready Prepared Foodservice System (2020-2028) ($MN)
79 Asia Pacific Food Service Market Outlook, By Assembly-Serve Foodservice System (2020-2028) ($MN)
80 Asia Pacific Food Service Market Outlook, By Other Systems (2020-2028) ($MN)
81 South America Food Service Market Outlook, By Country (2020-2028) ($MN)
82 South America Food Service Market Outlook, By Type (2020-2028) ($MN)
83 South America Food Service Market Outlook, By Quick Service Restaurants (2020-2028) ($MN)
84 South America Food Service Market Outlook, By Full Service Restaurants (2020-2028) ($MN)
85 South America Food Service Market Outlook, By Street food (2020-2028) ($MN)
86 South America Food Service Market Outlook, By Cafés and bars (2020-2028) ($MN)
87 South America Food Service Market Outlook, By Limited Service Restaurants (2020-2028) ($MN)
88 South America Food Service Market Outlook, By Special Food Services Restaurants (2020-2028) ($MN)
89 South America Food Service Market Outlook, By Institutes (2020-2028) ($MN)
90 South America Food Service Market Outlook, By Other Types (2020-2028) ($MN)
91 South America Food Service Market Outlook, By Service Type (2020-2028) ($MN)
92 South America Food Service Market Outlook, By Commercial (2020-2028) ($MN)
93 South America Food Service Market Outlook, By Institutional (2020-2028) ($MN)
94 South America Food Service Market Outlook, By Other Service Types (2020-2028) ($MN)
95 South America Food Service Market Outlook, By System (2020-2028) ($MN)
96 South America Food Service Market Outlook, By Conventional Foodservice System (2020-2028) ($MN)
97 South America Food Service Market Outlook, By Centralized Foodservice System (2020-2028) ($MN)
98 South America Food Service Market Outlook, By Ready Prepared Foodservice System (2020-2028) ($MN)
99 South America Food Service Market Outlook, By Assembly-Serve Foodservice System (2020-2028) ($MN)
100 South America Food Service Market Outlook, By Other Systems (2020-2028) ($MN)
101 Middle East & Africa Food Service Market Outlook, By Country (2020-2028) ($MN)
102 Middle East & Africa Food Service Market Outlook, By Type (2020-2028) ($MN)
103 Middle East & Africa Food Service Market Outlook, By Quick Service Restaurants (2020-2028) ($MN)
104 Middle East & Africa Food Service Market Outlook, By Full Service Restaurants (2020-2028) ($MN)
105 Middle East & Africa Food Service Market Outlook, By Street food (2020-2028) ($MN)
106 Middle East & Africa Food Service Market Outlook, By Cafés and bars (2020-2028) ($MN)
107 Middle East & Africa Food Service Market Outlook, By Limited Service Restaurants (2020-2028) ($MN)
108 Middle East & Africa Food Service Market Outlook, By Special Food Services Restaurants (2020-2028) ($MN)
109 Middle East & Africa Food Service Market Outlook, By Institutes (2020-2028) ($MN)
110 Middle East & Africa Food Service Market Outlook, By Other Types (2020-2028) ($MN)
111 Middle East & Africa Food Service Market Outlook, By Service Type (2020-2028) ($MN)
112 Middle East & Africa Food Service Market Outlook, By Commercial (2020-2028) ($MN)
113 Middle East & Africa Food Service Market Outlook, By Institutional (2020-2028) ($MN)
114 Middle East & Africa Food Service Market Outlook, By Other Service Types (2020-2028) ($MN)
115 Middle East & Africa Food Service Market Outlook, By System (2020-2028) ($MN)
116 Middle East & Africa Food Service Market Outlook, By Conventional Foodservice System (2020-2028) ($MN)
117 Middle East & Africa Food Service Market Outlook, By Centralized Foodservice System (2020-2028) ($MN)
118 Middle East & Africa Food Service Market Outlook, By Ready Prepared Foodservice System (2020-2028) ($MN)
119 Middle East & Africa Food Service Market Outlook, By Assembly-Serve Foodservice System (2020-2028) ($MN)
120 Middle East & Africa Food Service Market Outlook, By Other Systems (2020-2028) ($MN)
List of Figures
RESEARCH METHODOLOGY

We at ‘Stratistics’ opt for an extensive research approach which involves data mining, data validation, and data analysis. The various research sources include in-house repository, secondary research, competitor’s sources, social media research, client internal data, and primary research.
Our team of analysts prefers the most reliable and authenticated data sources in order to perform the comprehensive literature search. With access to most of the authenticated data bases our team highly considers the best mix of information through various sources to obtain extensive and accurate analysis.
Each report takes an average time of a month and a team of 4 industry analysts. The time may vary depending on the scope and data availability of the desired market report. The various parameters used in the market assessment are standardized in order to enhance the data accuracy.
Data Mining
The data is collected from several authenticated, reliable, paid and unpaid sources and is filtered depending on the scope & objective of the research. Our reports repository acts as an added advantage in this procedure. Data gathering from the raw material suppliers, distributors and the manufacturers is performed on a regular basis, this helps in the comprehensive understanding of the products value chain. Apart from the above mentioned sources the data is also collected from the industry consultants to ensure the objective of the study is in the right direction.
Market trends such as technological advancements, regulatory affairs, market dynamics (Drivers, Restraints, Opportunities and Challenges) are obtained from scientific journals, market related national & international associations and organizations.
Data Analysis
From the data that is collected depending on the scope & objective of the research the data is subjected for the analysis. The critical steps that we follow for the data analysis include:
- Product Lifecycle Analysis
- Competitor analysis
- Risk analysis
- Porters Analysis
- PESTEL Analysis
- SWOT Analysis
The data engineering is performed by the core industry experts considering both the Marketing Mix Modeling and the Demand Forecasting. The marketing mix modeling makes use of multiple-regression techniques to predict the optimal mix of marketing variables. Regression factor is based on a number of variables and how they relate to an outcome such as sales or profits.
Data Validation
The data validation is performed by the exhaustive primary research from the expert interviews. This includes telephonic interviews, focus groups, face to face interviews, and questionnaires to validate our research from all aspects. The industry experts we approach come from the leading firms, involved in the supply chain ranging from the suppliers, distributors to the manufacturers and consumers so as to ensure an unbiased analysis.
We are in touch with more than 15,000 industry experts with the right mix of consultants, CEO's, presidents, vice presidents, managers, experts from both supply side and demand side, executives and so on.
The data validation involves the primary research from the industry experts belonging to:
- Leading Companies
- Suppliers & Distributors
- Manufacturers
- Consumers
- Industry/Strategic Consultants
Apart from the data validation the primary research also helps in performing the fill gap research, i.e. providing solutions for the unmet needs of the research which helps in enhancing the reports quality.
For more details about research methodology, kindly write to us at info@strategymrc.com
Frequently Asked Questions
In case of any queries regarding this report, you can contact the customer service by filing the “Inquiry Before Buy” form available on the right hand side. You may also contact us through email: info@strategymrc.com or phone: +1-301-202-5929
Yes, the samples are available for all the published reports. You can request them by filling the “Request Sample” option available in this page.
Yes, you can request a sample with your specific requirements. All the customized samples will be provided as per the requirement with the real data masked.
All our reports are available in Digital PDF format. In case if you require them in any other formats, such as PPT, Excel etc you can submit a request through “Inquiry Before Buy” form available on the right hand side. You may also contact us through email: info@strategymrc.com or phone: +1-301-202-5929
We offer a free 15% customization with every purchase. This requirement can be fulfilled for both pre and post sale. You may send your customization requirements through email at info@strategymrc.com or call us on +1-301-202-5929.
We have 3 different licensing options available in electronic format.
- Single User Licence: Allows one person, typically the buyer, to have access to the ordered product. The ordered product cannot be distributed to anyone else.
- 2-5 User Licence: Allows the ordered product to be shared among a maximum of 5 people within your organisation.
- Corporate License: Allows the product to be shared among all employees of your organisation regardless of their geographical location.
All our reports are typically be emailed to you as an attachment.
To order any available report you need to register on our website. The payment can be made either through CCAvenue or PayPal payments gateways which accept all international cards.
We extend our support to 6 months post sale. A post sale customization is also provided to cover your unmet needs in the report.
Request Customization
We offer complimentary customization of up to 15% with every purchase. To share your customization requirements, feel free to email us at info@strategymrc.com or call us on +1-301-202-5929. .
Please Note: Customization within the 15% threshold is entirely free of charge. If your request exceeds this limit, we will conduct a feasibility assessment. Following that, a detailed quote and timeline will be provided.
WHY CHOOSE US ?

Assured Quality
Best in class reports with high standard of research integrity

24X7 Research Support
Continuous support to ensure the best customer experience.

Free Customization
Adding more values to your product of interest.

Safe & Secure Access
Providing a secured environment for all online transactions.

Trusted by 600+ Brands
Serving the most reputed brands across the world.