
Industrial Air Compressor Market
Industrial Air Compressor Market Forecasts to 2028 – Global Analysis By Driver (Electric, Natural Gas), Design (Stationary, Portable), Pressure Up To 20 Bar, 21–100 Bar, Above 100 Bar,) and By Geography

|
Years Covered |
2020-2028 |
|
Estimated Year Value (2021) |
US $33.95 BN |
|
Projected Year Value (2028) |
US $56.69 BN |
|
CAGR (2021 - 2028) |
7.6% |
|
Regions Covered |
North America, Europe, Asia Pacific, South America, and Middle East & Africa |
|
Countries Covered |
US, Canada, Mexico, Germany, UK, Italy, France, Spain, Japan, China, India, Australia, New Zealand, South Korea, Rest of Asia Pacific, South America, Argentina, Brazil, Chile, Middle East & Africa, Saudi Arabia, UAE, Qatar, and South Africa |
|
Largest Market |
Asia Pacific |
|
Fastest Growing Market |
North America |
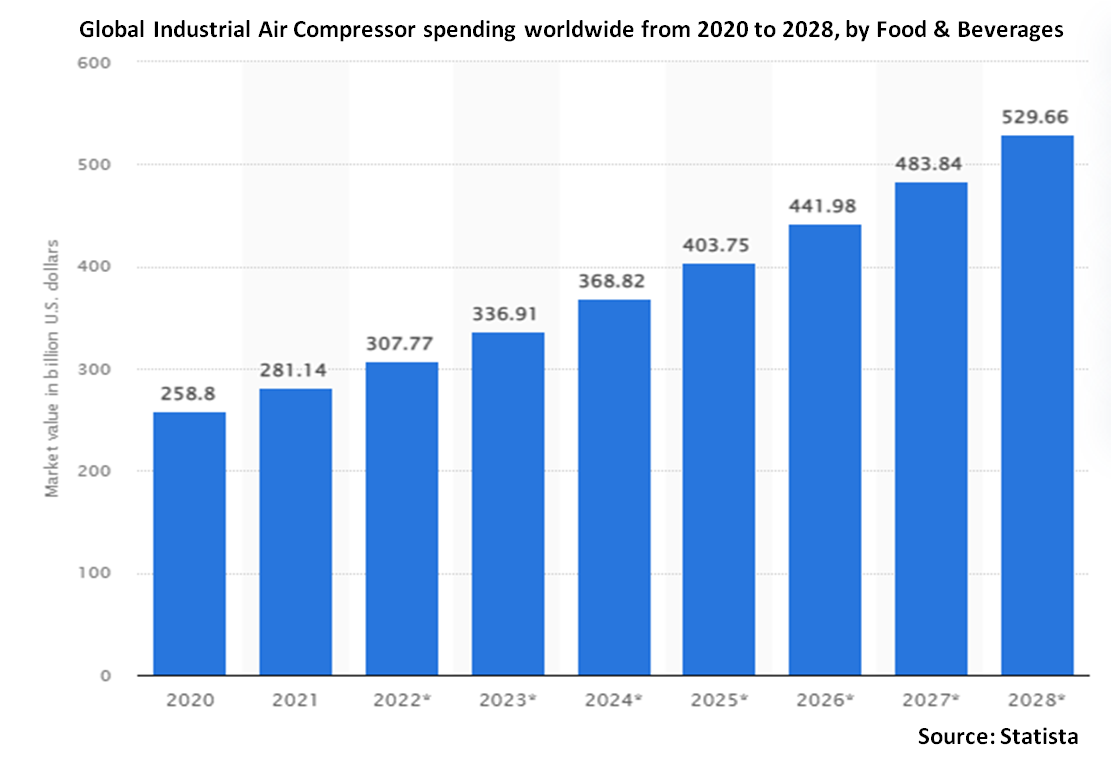
According to Stratistics MRC, the Global Industrial Air Compressor Market is accounted for $33.95 billion in 2021 and is expected to reach $56.69 billion by 2028 growing at a CAGR of 7.6% during the forecast period. An industrial air compressor uses either an electric motor or diesel or gasoline to convert power to potential energy stored in pressurized air. Industrial air compressors have been used in several applications such as for spraying crops, ventilating silos in agricultural facilities, running pneumatic machinery in manufacturing operations, and operating laundry pressers in dry cleaners.
Market Dynamics:
Driver:
Technological Modernizations and High Demand for Portable Air Compressor
As there are developments in technology, more industries are harnessing the potential of compressed air as an energy alternative and users of air compressors trade up their equipment for newer models. Replacement of equipment with new and improved technology air compressors leads to boosted efficiency, greater ease of use, and overall savings in operating costs. These qualities have been compelling users of air compressors to replace their machines regularly, thereby driving the market growth. The increasing popularity of air compressors is the innovation that goes into newer models in the air compressors market. As manufacturers in India have been announcing new types of reciprocating and rotary screw air compressors, the machines become more robust, easier to operate, and better equipped for some of the most demanding applications across a wide range of industrial uses.
Restraint:
High Cost & Maintenance
The air compressors are extremely susceptible to over-heating. Compressed air can generate lots of heat and all that hot air has to be removed before it reaches the warning temperature as it can cause damage to the system. The cost of it ranges from $100-$600 depending on the application. Other hidden costs such as installation and operational costs associated with it restrain the market growth. High temperature may cause damage to the air compressor over some time, so identifying a temperature problem early is critical. Therefore, high cost and maintenance problems have been hampering the growth of the market.
Opportunity:
Growing Demand for Energy-Efficient Air Compressors
With a growing focus on energy costs and rising greenhouse gas emissions, attention has shifted toward the use of energy-efficient compressed air solutions. A compressed air system is one of the key industry equipment that has to follow energy policy. Meanwhile, easy and safe generation of compressed air is increasing the use of air compressors in various industrial applications. According to the US DOE, 50% of industrial plant air systems harbor opportunities for large energy savings with relatively low project costs. To achieve energy savings, compressed air systems require proper maintenance and high-level monitoring. This results in an enhanced life cycle of pneumatic devices and ensures higher reliability of compressed air systems. Modern compressors can achieve long-term savings and ensure a cleaner environment. Environment-friendly compressors need less fuel and make less noise. Also, the modern generation air compressor systems have a heat recovery feature, which helps recover up to 94% of the heat generated by the compressors. This recovered energy can be used for pre-heating of the feed water or air. This is a major advancement for power generation industries. The modern air system also recommends using IE4 compliant motors as they help reduce electricity consumption.
Threat:
Adherence to Rigorous Quality Standards
The countries have introduced new emission standards for compressors to improve air quality by decreasing the discharge of contaminants. The criteria are often rationalized time-to-time, which may need the manufacturer to make radical adjustments in the design and performance of the industrial air compressors. Also, contagion of compressed air is a severe issue for several industries such as food & beverages, healthcare, pharmaceuticals, and chemicals. A safer compressed air supply is required to uphold an efficient and cost-effective production. The majority of the industrialized nations have imposed stringent rules and regulations, which must be adhered to during the use of compressors, to limit the emission of contaminants by air compressors and prevent health hazards due to contaminated compressed air. Additionally, in the compressed air industry, standards may also be produced by trade associations such as PNEUROP (European Association of Manufacturers of Compressors, Vacuum Pumps, Pneumatic Tools, and Air & Condensate Treatment Equipment) and CAGI (United States Compressed Air and Gas Institute).
Oil-Flooded segment is expected to be the largest during the forecast period
Oil-flooded segment is expected to have largest share, due to the advancement of food grade oils and increasing usage as they are more economical and generally complete the compression process in a single stage. These compressors are generally used in industries such as plastics, oil & gas, rubber, textiles, metals, and mining, among others, where cleaner compressed air requirement is optional. Oil-flooded compressors use oil to lubricate the air compression chamber, lubricate parts, and seal in the air.
The rotary segment is expected to have the highest CAGR during the forecast period
The rotary segment is expected to have the highest CAGR, due to the high adoption of rotary air compressors in large industrial applications. These compressors are further bifurcated into scroll, screw, and a few other technologies such as lobe & vane. Rotary air compressors have been replacing the reciprocating industrial compressors since the past few years and are likely to continue in the upcoming years. They require minimum maintenance, offer better efficiency, and possess comparatively lower preliminary costs.
Region with highest share:
The Asia Pacific is projected to hold the highest market share, owing to the growth of industries such as chemicals and petrochemicals, manufacturing, power generation, pharmaceuticals, and food and beverages. It is driven by increasing industrialization and development activities in the emerging economies of the region. China leads the vehicle production by a distinguished margin. These factors along with the electronic sector progress in India, China, South Korea, and Japan will indicate the regional industrial air compressors demand.
Region with highest CAGR:
North America is projected to have the highest CAGR, owing to the growth potential from varied industries, high adoption due to availability of energy-efficient products, demand for technologically advanced & low-cost products, and others. However, each factor has its definite impact on the market. Increasing application of oil-free compressors in healthcare industries due to stringent regulation has been proliferating the market growth. Additionally, the growing adoption of portable air compressors and replacement of older equipment with new models have been creating opportunities for the market across this region.

Key players in the market:
Some of the key players profiled in the Industrial Air Compressor Market include Atlas Copco, Baker Hughes Company, Bauer Kompressoren GmbH, Burckhardt, Elgi Equipments, General Electric Company, Hitachi Industrial Equipment Systems Co., Howden Group, IHI Corporation, Ingersoll Rand, Kaeser Kompressoren, Kaishan Compressor Co. Ltd, Kobelco Compressors, MAN SE, Mitsubishi Heavy Industries, Ltd, Quincy Compressor, Siemens Energy AG, Sullair LLC.
Key developments:
In February 2020: Atlas Copco acquired Dr. Gustav Gail Drucklufttechnik GmbH, a German distributor of industrial compressors and services. The company will be part of the service division within the compressor technique business area of Atlas Copco
In December 2019: ELGi had launched electric and diesel portable air compressor which is of energy efficient at an international exhibition Centre, EXCON 2019. Adoption of this type of air compressors in various industries for energy efficiency set to increase the Indian air compressor market share.
In March 2021: Hitachi Global Life Solutions, a subsidiary of Hitachi, signed an agreement to transfer all outstanding shares of Hitachi Compressor (Thailand), Ltd., a wholly owned subsidiary in Thailand that manufactures compressors for refrigerators, to Midea Electric Trading (Singapore) Co. Pte, Ltd., a subsidiary of China's Midea Group and a trading company for home appliances sales.
Drivers Covered:
• Electric
• Natural Gas
• Fuel Driven
Designs Covered:
• Stationary
• Portable
Pressures Covered:
• Up To 20 Bar
• 21–100 Bar
• Above 100 Bar
Output Powers Covered:
• Up To 50 kW
• 51–250 kW
• 251–500 kW
• Above 500 kW
Seal Types Covered:
• Oil-Flooded
• Oil-Free
Coolant Types Covered:
• Air-Cooled
• Water-Cooled
Products Covered:
• Positive Displacement
• Dynamic Displacement
Compression Stages Covered:
• Single Stage
• Double Stage
• Multistage
End Users Covered:
• Chemicals & Petrochemicals
• Food & Beverages
• Oil & Gas
• Pharmaceuticals
• Construction
• Automotive & Transportation
• Packaging (Includes PET Blowing)
• Power Generation
• Healthcare
• Metals & Mining
• Manufacturing
• Other End User
Regions Covered:
• North America
o US
o Canada
o Mexico
• Europe
o Germany
o UK
o Italy
o France
o Spain
o Rest of Europe
• Asia Pacific
o Japan
o China
o India
o Australia
o New Zealand
o South Korea
o Rest of Asia Pacific
• South America
o Argentina
o Brazil
o Chile
o Rest of South America
• Middle East & Africa
o Saudi Arabia
o UAE
o Qatar
o South Africa
o Rest of Middle East & Africa
What our report offers:
- Market share assessments for the regional and country-level segments
- Strategic recommendations for the new entrants
- Covers Market data for the years 2020, 2021, 2022, 2025 and 2028
- Market Trends (Drivers, Constraints, Opportunities, Threats, Challenges, Investment Opportunities, and recommendations)
- Strategic recommendations in key business segments based on the market estimations
- Competitive landscaping mapping the key common trends
- Company profiling with detailed strategies, financials, and recent developments
- Supply chain trends mapping the latest technological advancements
Free Customization Offerings:
All the customers of this report will be entitled to receive one of the following free customization options:
• Company Profiling
o Comprehensive profiling of additional market players (up to 3)
o SWOT Analysis of key players (up to 3)
• Regional Segmentation
o Market estimations, Forecasts and CAGR of any prominent country as per the client's interest (Note: Depends on feasibility check)
• Competitive Benchmarking
o Benchmarking of key players based on product portfolio, geographical presence, and strategic alliances
Table of Contents
1 Executive Summary
2 Preface
2.1 Abstract
2.2 Stake Holders
2.3 Research Scope
2.4 Research Methodology
2.4.1 Data Mining
2.4.2 Data Analysis
2.4.3 Data Validation
2.4.4 Research Approach
2.5 Research Sources
2.5.1 Primary Research Sources
2.5.2 Secondary Research Sources
2.5.3 Assumptions
3 Market Trend Analysis
3.1 Introduction
3.2 Drivers
3.3 Restraints
3.4 Opportunities
3.5 Threats
3.6 Product Analysis
3.7 End User Analysis
3.8 Emerging Markets
3.9 Impact of Covid-19
4 Porters Five Force Analysis
4.1 Bargaining power of suppliers
4.2 Bargaining power of buyers
4.3 Threat of substitutes
4.4 Threat of new entrants
4.5 Competitive rivalry
5 Global Industrial Air Compressor Market, By Driver
5.1 Introduction
5.2 Electric
5.3 Natural Gas
5.4 Fuel Driven
6 Global Industrial Air Compressor Market, By Design
6.1 Introduction
6.2 Stationary
6.3 Portable
7 Global Industrial Air Compressor Market, By Pressure
7.1 Introduction
7.2 Up To 20 Bar
7.3 21–100 Bar
7.4 Above 100 Bar
8 Global Industrial Air Compressor Market, By Output Power
8.1 Introduction
8.2 Up To 50 kW
8.3 51–250 kW
8.4 251–500 kW
8.5 Above 500 kW
9 Global Industrial Air Compressor Market, By Seal Type
9.1 Introduction
9.2 Oil-Flooded
9.3 Oil-Free
10 Global Industrial Air Compressor Market, By Coolant Type
10.1 Introduction
10.2 Air-Cooled
10.3 Water-Cooled
11 Global Industrial Air Compressor Market, By Product
11.1 Introduction
11.2 Positive Displacement
11.2.1 Reciprocating
11.2.2 Rotary
11.2.2.1 Screw
11.2.2.2 Scroll
11.2.2.3 Others
11.2.2.3.1 Vane
11.2.2.3.2 Lobe industrial air compressors
11.3 Dynamic Displacement
11.3.1 Centrifugal
11.3.2 Axial
12 Global Industrial Air Compressor Market, By Compression Stage
12.1 Introduction
12.2 Single Stage
12.3 Double Stage
12.4 Multistage
13 Global Industrial Air Compressor Market, By End User
13.1 Introduction
13.2 Chemicals & Petrochemicals
13.3 Food & Beverages
13.4 Oil & Gas
13.5 Pharmaceuticals
13.6 Construction
13.7 Automotive & Transportation
13.8 Packaging (Includes PET Blowing)
13.9 Power Generation
13.10 Healthcare
13.11 Metals & Mining
13.12 Manufacturing
13.13 Other End User
13.13.1 Textiles
13.13.2 Paper & Pulp
13.13.3 Rubber & Plastics
13.13.4 Agriculture
13.13.5 Water & Wastewater Treatment
13.13.6 Aerospace & Defense
14 Global Industrial Air Compressor Market, By Geography
14.1 Introduction
14.2 North America
14.2.1 US
14.2.2 Canada
14.2.3 Mexico
14.3 Europe
14.3.1 Germany
14.3.2 UK
14.3.3 Italy
14.3.4 France
14.3.5 Spain
14.3.6 Rest of Europe
14.4 Asia Pacific
14.4.1 Japan
14.4.2 China
14.4.3 India
14.4.4 Australia
14.4.5 New Zealand
14.4.6 South Korea
14.4.7 Rest of Asia Pacific
14.5 South America
14.5.1 Argentina
14.5.2 Brazil
14.5.3 Chile
14.5.4 Rest of South America
14.6 Middle East & Africa
14.6.1 Saudi Arabia
14.6.2 UAE
14.6.3 Qatar
14.6.4 South Africa
14.6.5 Rest of Middle East & Africa
15 Key Developments
15.1 Agreements, Partnerships, Collaborations and Joint Ventures
15.2 Acquisitions & Mergers
15.3 New Product Launch
15.4 Expansions
15.5 Other Key Strategies
16 Company Profiling
16.1 Atlas Copco
16.2 Baker Hughes Company
16.3 Bauer Kompressoren GmbH
16.4 Burckhardt
16.5 Elgi Equipments
16.6 General Electric Company
16.7 Hitachi Industrial Equipment Systems Co.
16.8 Howden Group
16.9 IHI Corporation
16.10 Ingersoll Rand
16.11 Kaeser Kompressoren
16.12 Kaishan Compressor Co. Ltd
16.13 Kobelco Compressors
16.14 MAN SE
16.15 MITSUBISHI HEAVY INDUSTRIES, LTD
16.16 Quincy Compressor
16.17 Siemens Energy AG
16.18 Sullair LLC
List of Tables
1 Global Industrial Air Compressor Market Outlook, By Region (2020-2028) (US $MN)
2 Global Industrial Air Compressor Market Outlook, By Driver (2020-2028) (US $MN)
3 Global Industrial Air Compressor Market Outlook, By Electric (2020-2028) (US $MN)
4 Global Industrial Air Compressor Market Outlook, By Natural Gas (2020-2028) (US $MN)
5 Global Industrial Air Compressor Market Outlook, By Fuel Driven (2020-2028) (US $MN)
6 Global Industrial Air Compressor Market Outlook, By Design (2020-2028) (US $MN)
7 Global Industrial Air Compressor Market Outlook, By Stationary (2020-2028) (US $MN)
8 Global Industrial Air Compressor Market Outlook, By Portable (2020-2028) (US $MN)
9 Global Industrial Air Compressor Market Outlook, By Pressure (2020-2028) (US $MN)
10 Global Industrial Air Compressor Market Outlook, By Up To 20 Bar (2020-2028) (US $MN)
11 Global Industrial Air Compressor Market Outlook, By 21–100 Bar (2020-2028) (US $MN)
12 Global Industrial Air Compressor Market Outlook, By Above 100 Bar (2020-2028) (US $MN)
13 Global Industrial Air Compressor Market Outlook, By Output Power (2020-2028) (US $MN)
14 Global Industrial Air Compressor Market Outlook, By Up To 50 kW (2020-2028) (US $MN)
15 Global Industrial Air Compressor Market Outlook, By 51–250 kW (2020-2028) (US $MN)
16 Global Industrial Air Compressor Market Outlook, By 251–500 kW (2020-2028) (US $MN)
17 Global Industrial Air Compressor Market Outlook, By Above 500 kW (2020-2028) (US $MN)
18 Global Industrial Air Compressor Market Outlook, By Seal Type (2020-2028) (US $MN)
19 Global Industrial Air Compressor Market Outlook, By Oil-Flooded (2020-2028) (US $MN)
20 Global Industrial Air Compressor Market Outlook, By Oil-Free (2020-2028) (US $MN)
21 Global Industrial Air Compressor Market Outlook, By Coolant Type (2020-2028) (US $MN)
22 Global Industrial Air Compressor Market Outlook, By Air-Cooled (2020-2028) (US $MN)
23 Global Industrial Air Compressor Market Outlook, By Water-Cooled (2020-2028) (US $MN)
24 Global Industrial Air Compressor Market Outlook, By Product (2020-2028) (US $MN)
25 Global Industrial Air Compressor Market Outlook, By Positive Displacement (2020-2028) (US $MN)
26 Global Industrial Air Compressor Market Outlook, By Reciprocating (2020-2028) (US $MN)
27 Global Industrial Air Compressor Market Outlook, By Rotary (2020-2028) (US $MN)
28 Global Industrial Air Compressor Market Outlook, By Dynamic Displacement (2020-2028) (US $MN)
29 Global Industrial Air Compressor Market Outlook, By Centrifugal (2020-2028) (US $MN)
30 Global Industrial Air Compressor Market Outlook, By Axial (2020-2028) (US $MN)
31 Global Industrial Air Compressor Market Outlook, By Compression Stage (2020-2028) (US $MN)
32 Global Industrial Air Compressor Market Outlook, By Single Stage (2020-2028) (US $MN)
33 Global Industrial Air Compressor Market Outlook, By Double Stage (2020-2028) (US $MN)
34 Global Industrial Air Compressor Market Outlook, By Multistage (2020-2028) (US $MN)
35 Global Industrial Air Compressor Market Outlook, By End User (2020-2028) (US $MN)
36 Global Industrial Air Compressor Market Outlook, By Chemicals & Petrochemicals (2020-2028) (US $MN)
37 Global Industrial Air Compressor Market Outlook, By Food & Beverages (2020-2028) (US $MN)
38 Global Industrial Air Compressor Market Outlook, By Oil & Gas (2020-2028) (US $MN)
39 Global Industrial Air Compressor Market Outlook, By Pharmaceuticals (2020-2028) (US $MN)
40 Global Industrial Air Compressor Market Outlook, By Construction (2020-2028) (US $MN)
41 Global Industrial Air Compressor Market Outlook, By Automotive & Transportation (2020-2028) (US $MN)
42 Global Industrial Air Compressor Market Outlook, By Packaging (Includes PET Blowing) (2020-2028) (US $MN)
43 Global Industrial Air Compressor Market Outlook, By Power Generation (2020-2028) (US $MN)
44 Global Industrial Air Compressor Market Outlook, By Healthcare (2020-2028) (US $MN)
45 Global Industrial Air Compressor Market Outlook, By Metals & Mining (2020-2028) (US $MN)
46 Global Industrial Air Compressor Market Outlook, By Manufacturing (2020-2028) (US $MN)
47 Global Industrial Air Compressor Market Outlook, By Other End User (2020-2028) (US $MN)
48 Global Industrial Air Compressor Market Outlook, By Textiles (2020-2028) (US $MN)
49 Global Industrial Air Compressor Market Outlook, By Paper & Pulp (2020-2028) (US $MN)
50 Global Industrial Air Compressor Market Outlook, By Rubber & Plastics (2020-2028) (US $MN)
51 Global Industrial Air Compressor Market Outlook, By Agriculture (2020-2028) (US $MN)
52 Global Industrial Air Compressor Market Outlook, By Water & Wastewater Treatment (2020-2028) (US $MN)
53 Global Industrial Air Compressor Market Outlook, By Aerospace & Defense (2020-2028) (US $MN)
Note- Tables for North America, Europe, APAC, South America, and Middle East & Africa Regions are also represented in the same manner as above.
List of Figures
RESEARCH METHODOLOGY

We at ‘Stratistics’ opt for an extensive research approach which involves data mining, data validation, and data analysis. The various research sources include in-house repository, secondary research, competitor’s sources, social media research, client internal data, and primary research.
Our team of analysts prefers the most reliable and authenticated data sources in order to perform the comprehensive literature search. With access to most of the authenticated data bases our team highly considers the best mix of information through various sources to obtain extensive and accurate analysis.
Each report takes an average time of a month and a team of 4 industry analysts. The time may vary depending on the scope and data availability of the desired market report. The various parameters used in the market assessment are standardized in order to enhance the data accuracy.
Data Mining
The data is collected from several authenticated, reliable, paid and unpaid sources and is filtered depending on the scope & objective of the research. Our reports repository acts as an added advantage in this procedure. Data gathering from the raw material suppliers, distributors and the manufacturers is performed on a regular basis, this helps in the comprehensive understanding of the products value chain. Apart from the above mentioned sources the data is also collected from the industry consultants to ensure the objective of the study is in the right direction.
Market trends such as technological advancements, regulatory affairs, market dynamics (Drivers, Restraints, Opportunities and Challenges) are obtained from scientific journals, market related national & international associations and organizations.
Data Analysis
From the data that is collected depending on the scope & objective of the research the data is subjected for the analysis. The critical steps that we follow for the data analysis include:
- Product Lifecycle Analysis
- Competitor analysis
- Risk analysis
- Porters Analysis
- PESTEL Analysis
- SWOT Analysis
The data engineering is performed by the core industry experts considering both the Marketing Mix Modeling and the Demand Forecasting. The marketing mix modeling makes use of multiple-regression techniques to predict the optimal mix of marketing variables. Regression factor is based on a number of variables and how they relate to an outcome such as sales or profits.
Data Validation
The data validation is performed by the exhaustive primary research from the expert interviews. This includes telephonic interviews, focus groups, face to face interviews, and questionnaires to validate our research from all aspects. The industry experts we approach come from the leading firms, involved in the supply chain ranging from the suppliers, distributors to the manufacturers and consumers so as to ensure an unbiased analysis.
We are in touch with more than 15,000 industry experts with the right mix of consultants, CEO's, presidents, vice presidents, managers, experts from both supply side and demand side, executives and so on.
The data validation involves the primary research from the industry experts belonging to:
- Leading Companies
- Suppliers & Distributors
- Manufacturers
- Consumers
- Industry/Strategic Consultants
Apart from the data validation the primary research also helps in performing the fill gap research, i.e. providing solutions for the unmet needs of the research which helps in enhancing the reports quality.
For more details about research methodology, kindly write to us at info@strategymrc.com
Frequently Asked Questions
In case of any queries regarding this report, you can contact the customer service by filing the “Inquiry Before Buy” form available on the right hand side. You may also contact us through email: info@strategymrc.com or phone: +1-301-202-5929
Yes, the samples are available for all the published reports. You can request them by filling the “Request Sample” option available in this page.
Yes, you can request a sample with your specific requirements. All the customized samples will be provided as per the requirement with the real data masked.
All our reports are available in Digital PDF format. In case if you require them in any other formats, such as PPT, Excel etc you can submit a request through “Inquiry Before Buy” form available on the right hand side. You may also contact us through email: info@strategymrc.com or phone: +1-301-202-5929
We offer a free 15% customization with every purchase. This requirement can be fulfilled for both pre and post sale. You may send your customization requirements through email at info@strategymrc.com or call us on +1-301-202-5929.
We have 3 different licensing options available in electronic format.
- Single User Licence: Allows one person, typically the buyer, to have access to the ordered product. The ordered product cannot be distributed to anyone else.
- 2-5 User Licence: Allows the ordered product to be shared among a maximum of 5 people within your organisation.
- Corporate License: Allows the product to be shared among all employees of your organisation regardless of their geographical location.
All our reports are typically be emailed to you as an attachment.
To order any available report you need to register on our website. The payment can be made either through CCAvenue or PayPal payments gateways which accept all international cards.
We extend our support to 6 months post sale. A post sale customization is also provided to cover your unmet needs in the report.
Request Customization
We offer complimentary customization of up to 15% with every purchase. To share your customization requirements, feel free to email us at info@strategymrc.com or call us on +1-301-202-5929. .
Please Note: Customization within the 15% threshold is entirely free of charge. If your request exceeds this limit, we will conduct a feasibility assessment. Following that, a detailed quote and timeline will be provided.
WHY CHOOSE US ?

Assured Quality
Best in class reports with high standard of research integrity

24X7 Research Support
Continuous support to ensure the best customer experience.

Free Customization
Adding more values to your product of interest.

Safe & Secure Access
Providing a secured environment for all online transactions.

Trusted by 600+ Brands
Serving the most reputed brands across the world.