
Manuka Honey Market
Manuka Honey Market Forecasts to 2028 - Global Analysis By Product Type (Processed Manuka Honey, Raw Manuka Honey and Other Product Types), Nature (Conventional, Organic and Other Natures), Form (UMF 20+, UMF 15+, UMF 10+, UMF 5+ and Other Forms), Distribution Channel, End User and By Geography

|
Years Covered |
2020-2028 |
|
Estimated Year Value (2022) |
US $931.6 MN |
|
Projected Year Value (2028) |
US $1,470.1MN |
|
CAGR (2022 - 2028) |
7.8% |
|
Regions Covered |
North America, Europe, Asia Pacific, South America, and Middle East & Africa |
|
Countries Covered |
US, Canada, Mexico, Germany, UK, Italy, France, Spain, Japan, China, India, Australia, New Zealand, South Korea, Rest of Asia Pacific, South America, Argentina, Brazil, Chile, Middle East & Africa, Saudi Arabia, UAE, Qatar, and South Africa |
|
Largest Market |
Asia Pacific |
|
Highest Growing Market |
Europe |
According to Stratistics MRC, the Global Manuka Honey Market is accounted for $931.6 million in 2022 and is expected to reach $1,470.1 million by 2028 growing at a CAGR of 7.8% during the forecast period. Manuka honey is dark honey that offers a pool of biological properties owing to its antimicrobial and antioxidant capacities. The antimicrobial activity of this honey is measured through the Unique Manuka Factor (UMF). The antibacterial properties of honey set it apart from traditional honey. The sweet and strong flavor of honey makes it a potential sweetener and a replacement for table sugar.
According to The Diabetes Council, manuka honey is considered as the healthiest substitute for the people with diabetes. According to the Australian food shop, manuka honey is extremely nutrient rich and supports the immune system, means manuka honey can certainly help your body to have a naturally high resistance and increased recovery from any virus including Covid.
Market Dynamics:
Driver:
Health benefits associated with Manuka Honey
Manuka honey is highly valued for its antibacterial properties, as has been substantiated by scientific research. It helps in wound healing, improves metabolism, treats sore throat, and is also good for the skin. Increasing awareness about weight and heart-related diseases, especially among young individuals and teenagers, has inclined the focus of customers toward healthy food products and consumers prefer the food products which can provide them with nutrition as well as health benefits. Hence, these are the factors boosting the growth of the market.
Restraint:
High cost of honey
As the demand for the product increases, it further eliminates regional boundaries for the production of high-quality products. Organic honey is extremely expensive as compared to the fake ones, which makes it less affordable to the population. Artificial honey may not cause much damage in the short term, but it is a real challenge to the survival of real honey in the long run. Thus, these aspects are restraining the market growth.
Opportunity:
Increasing consumer preference for organic honey
The consumers in developed economies are increasingly concerned about the impact of agricultural activities on the environment and are looking for products with less environmental impact. Consumer awareness is rising regarding the environmental and health impact of chemicals during food cultivation. Consumers are shifting toward organically procured honey due to the increasing awareness regarding the negative impact of chemicals on human health. Therefore, these factors are anticipated to enhance the growth of the market.
Threat:
Rising availability of duplicate honey
Another major challenge is posed by duplicate honey that is hindering the market. It is believed that honey is the third most faked food in the world after milk and olive oil. This fake honey is usually a highly processed form of a mixture of small quantity of real honey with low-cost sugary syrup derived from corn, rice, and sugarcane, among others. It offers none of the health benefits of real honey but all the disadvantages that can be associated with sugar.
Covid-19 Impact
Since the COVID-19 pandemic drove millions of people to stay at home, food and beverage sales have soared globally. Consumers in the area have a high demand for the honey. Due to increased health awareness, customers are spending more money on honey with therapeutic benefits, such as manuka honey, than regular honey. However, the outbreak has negatively impacted the global market for honey by forcing supermarkets and hypermarkets to close in many regions and nations. During the early stages of COVID-19, the sourcing and delivery of honey were severely hampered by import-export restrictions imposed by various nations and transportation constraints.
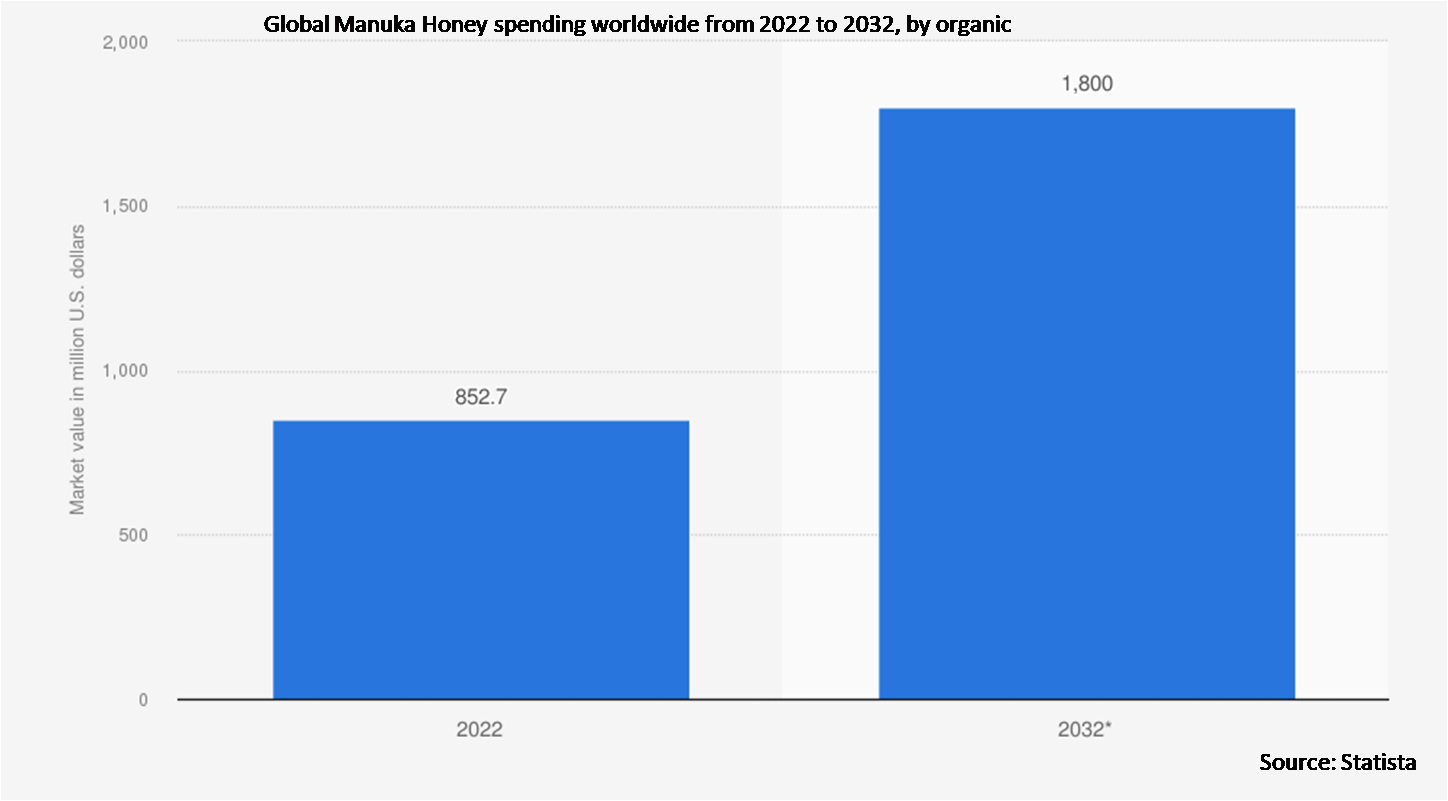
The organic segment is expected to be the largest during the forecast period
The organic segment is estimated to have a lucrative growth, due to the increasing demand for organic and natural manuka honey in various industries. Increased awareness about health benefits and nutritional content of this honey is driving the growth of organic segment coupled with a rise in demand for natural food products along with good taste. Rising demand for the natural and herbal ingredients has created a potential opportunity for the market.
The online stores segment is expected to have the highest CAGR during the forecast period
The online stores segment is anticipated to witness the fastest CAGR growth during the forecast period, due to the change in their purchasing patterns and a considerable shift in lifestyles. Online platforms offer high levels of convenience, increased product visibility, and at-home delivery features, which is promoting the segment growth. A majority of the consumers rely on virtual stores to help them navigate through the multitude of products available and at times, return and exchange options available to them if not satisfied with the delivered products.
Region with highest share:
Asia Pacific is projected to hold the largest market share during the forecast period owing to increased health awareness among consumers. Furthermore, the consumption of this honey has increased due to the rising disposable income and the availability of honey in the different forms on online and offline retail shops. An expansion in the purchasing power coupled with the increased spending by millennials on nutrition rich food drives the growth of the manuka honey market in the region.
Region with highest CAGR:
Europe is projected to have the highest CAGR over the forecast period, owing to the increase in consumer focus for maintaining fitness and regulating the body weight. The region has well-developed food, beverage and cosmetic industries, where the demand for plant based, healthy and nutritious products is increasing. Thus, the increased usage of manuka honey in variety of applications is driving the growth of the market in the region.

Key players in the market
Some of the key players profiled in the Manuka Honey Market include Capilano Honey Ltd., OHA Honey, Arataki Honey, Manuka Health, COMVITA, Streamland Biological Technology Limited, Midland Holdings, KirksBees Honey, Watson And Sons, Pure Honey New Zealand, Happy Valley Honey, Barnes Natural, Nature's Gold, Simply Honey, Haddrell's, Steens Honey, Apihealth NZ Ltd., Berringa, Egmont Honey and Cammells Honey.
Key Developments:
In March 2021, COMVITA announced its new UMF25+ Manuka Honey. The company announced it to be rare, as well as precious.
In January 2021, Manuka Health partnered up with Oritain and Trust Codes for the purpose of protecting Manuka Honey all the way from beekeepers to jars.
Product Types Covered:
• Processed Manuka Honey
• Raw Manuka Honey
• Other Product Types
Natures Covered:
• Conventional
• Organic
• Other Natures
Forms Covered:
• UMF 20+
• UMF 15+
• UMF 10+
• UMF 5+
• Other Forms
Distribution Channels Covered:
• Convenience Stores
• Online Stores
• Hypermarkets & Supermarkets
• Other Distribution Channels
End Users Covered:
• Bakery & Confectionery
• Pharmaceuticals
• Food & Beverages
• Cosmetics & Personal Care
• Dairy Products
• Other End Users
Regions Covered:
• North America
o US
o Canada
o Mexico
• Europe
o Germany
o UK
o Italy
o France
o Spain
o Rest of Europe
• Asia Pacific
o Japan
o China
o India
o Australia
o New Zealand
o South Korea
o Rest of Asia Pacific
• South America
o Argentina
o Brazil
o Chile
o Rest of South America
• Middle East & Africa
o Saudi Arabia
o UAE
o Qatar
o South Africa
o Rest of Middle East & Africa
What our report offers:
- Market share assessments for the regional and country-level segments
- Strategic recommendations for the new entrants
- Covers Market data for the years 2020, 2021, 2022, 2025, and 2028
- Market Trends (Drivers, Constraints, Opportunities, Threats, Challenges, Investment Opportunities, and recommendations)
- Strategic recommendations in key business segments based on the market estimations
- Competitive landscaping mapping the key common trends
- Company profiling with detailed strategies, financials, and recent developments
- Supply chain trends mapping the latest technological advancements
Free Customization Offerings:
All the customers of this report will be entitled to receive one of the following free customization options:
• Company Profiling
o Comprehensive profiling of additional market players (up to 3)
o SWOT Analysis of key players (up to 3)
• Regional Segmentation
o Market estimations, Forecasts and CAGR of any prominent country as per the client's interest (Note: Depends on feasibility check)
• Competitive Benchmarking
o Benchmarking of key players based on product portfolio, geographical presence, and strategic alliances
Table of Contents
1 Executive Summary
2 Preface
2.1 Abstract
2.2 Stake Holders
2.3 Research Scope
2.4 Research Methodology
2.4.1 Data Mining
2.4.2 Data Analysis
2.4.3 Data Validation
2.4.4 Research Approach
2.5 Research Sources
2.5.1 Primary Research Sources
2.5.2 Secondary Research Sources
2.5.3 Assumptions
3 Market Trend Analysis
3.1 Introduction
3.2 Drivers
3.3 Restraints
3.4 Opportunities
3.5 Threats
3.6 Product Analysis
3.7 End User Analysis
3.8 Emerging Markets
3.9 Impact of Covid-19
4 Porters Five Force Analysis
4.1 Bargaining power of suppliers
4.2 Bargaining power of buyers
4.3 Threat of substitutes
4.4 Threat of new entrants
4.5 Competitive rivalry
5 Global Manuka Honey Market, By Product Type
5.1 Introduction
5.2 Processed Manuka Honey
5.3 Raw Manuka Honey
5.4 Other Product Types
6 Global Manuka Honey Market, By Nature
6.1 Introduction
6.2 Conventional
6.3 Organic
6.4 Other Natures
7 Global Manuka Honey Market, By Form
7.1 Introduction
7.2 UMF 20+
7.3 UMF 15+
7.4 UMF 10+
7.5 UMF 5+
7.6 Other Forms
8 Global Manuka Honey Market, By Distribution Channel
8.1 Introduction
8.2 Convenience Stores
8.3 Online Stores
8.4 Hypermarkets & Supermarkets
8.5 Other Distribution Channels
9 Global Manuka Honey Market, By End User
9.1 Introduction
9.2 Bakery & Confectionery
9.3 Pharmaceuticals
9.4 Food & Beverages
9.5 Cosmetics & Personal Care
9.6 Dairy Products
9.7 Other End Users
10 Global Manuka Honey Market, By Geography
10.1 Introduction
10.2 North America
10.2.1 US
10.2.2 Canada
10.2.3 Mexico
10.3 Europe
10.3.1 Germany
10.3.2 UK
10.3.3 Italy
10.3.4 France
10.3.5 Spain
10.3.6 Rest of Europe
10.4 Asia Pacific
10.4.1 Japan
10.4.2 China
10.4.3 India
10.4.4 Australia
10.4.5 New Zealand
10.4.6 South Korea
10.4.7 Rest of Asia Pacific
10.5 South America
10.5.1 Argentina
10.5.2 Brazil
10.5.3 Chile
10.5.4 Rest of South America
10.6 Middle East & Africa
10.6.1 Saudi Arabia
10.6.2 UAE
10.6.3 Qatar
10.6.4 South Africa
10.6.5 Rest of Middle East & Africa
11 Key Developments
11.1 Agreements, Partnerships, Collaborations and Joint Ventures
11.2 Acquisitions & Mergers
11.3 New Product Launch
11.4 Expansions
11.5 Other Key Strategies
12 Company Profiling
12.1 Capilano Honey Ltd.
12.2 OHA Honey
12.3 Arataki Honey
12.4 Manuka Health
12.5 COMVITA
12.6 Streamland Biological Technology Limited
12.7 Midland Holdings
12.8 KirksBees Honey
12.9 Watson And Sons
12.10 Pure Honey New Zealand
12.11 Happy Valley Honey
12.12 Barnes Natural
12.13 Nature's Gold
12.14 Simply Honey
12.15 Haddrell's
12.16 Steens Honey
12.17 Apihealth NZ Ltd.
12.18 Berringa
12.19 Egmont Honey
12.20 Cammells Honey
List of Tables
1 Global Manuka Honey Market Outlook, By Region (2020-2028) ($MN)
2 Global Manuka Honey Market Outlook, By Product Type (2020-2028) ($MN)
3 Global Manuka Honey Market Outlook, By Processed Manuka Honey (2020-2028) ($MN)
4 Global Manuka Honey Market Outlook, By Raw Manuka Honey (2020-2028) ($MN)
5 Global Manuka Honey Market Outlook, By Other Product Types (2020-2028) ($MN)
6 Global Manuka Honey Market Outlook, By Nature (2020-2028) ($MN)
7 Global Manuka Honey Market Outlook, By Conventional (2020-2028) ($MN)
8 Global Manuka Honey Market Outlook, By Organic (2020-2028) ($MN)
9 Global Manuka Honey Market Outlook, By Other Natures (2020-2028) ($MN)
10 Global Manuka Honey Market Outlook, By Form (2020-2028) ($MN)
11 Global Manuka Honey Market Outlook, By UMF 20+ (2020-2028) ($MN)
12 Global Manuka Honey Market Outlook, By UMF 15+ (2020-2028) ($MN)
13 Global Manuka Honey Market Outlook, By UMF 10+ (2020-2028) ($MN)
14 Global Manuka Honey Market Outlook, By UMF 5+ (2020-2028) ($MN)
15 Global Manuka Honey Market Outlook, By Other Forms (2020-2028) ($MN)
16 Global Manuka Honey Market Outlook, By Distribution Channel (2020-2028) ($MN)
17 Global Manuka Honey Market Outlook, By Convenience Stores (2020-2028) ($MN)
18 Global Manuka Honey Market Outlook, By Online Stores (2020-2028) ($MN)
19 Global Manuka Honey Market Outlook, By Hypermarkets & Supermarkets (2020-2028) ($MN)
20 Global Manuka Honey Market Outlook, By Other Distribution Channels (2020-2028) ($MN)
21 Global Manuka Honey Market Outlook, By End User (2020-2028) ($MN)
22 Global Manuka Honey Market Outlook, By Bakery & Confectionery (2020-2028) ($MN)
23 Global Manuka Honey Market Outlook, By Pharmaceuticals (2020-2028) ($MN)
24 Global Manuka Honey Market Outlook, By Food & Beverages (2020-2028) ($MN)
25 Global Manuka Honey Market Outlook, By Cosmetics & Personal Care (2020-2028) ($MN)
26 Global Manuka Honey Market Outlook, By Dairy Products (2020-2028) ($MN)
27 Global Manuka Honey Market Outlook, By Other End Users (2020-2028) ($MN)
28 North America Manuka Honey Market Outlook, By Country (2020-2028) ($MN)
29 North America Manuka Honey Market Outlook, By Product Type (2020-2028) ($MN)
30 North America Manuka Honey Market Outlook, By Processed Manuka Honey (2020-2028) ($MN)
31 North America Manuka Honey Market Outlook, By Raw Manuka Honey (2020-2028) ($MN)
32 North America Manuka Honey Market Outlook, By Other Product Types (2020-2028) ($MN)
33 North America Manuka Honey Market Outlook, By Nature (2020-2028) ($MN)
34 North America Manuka Honey Market Outlook, By Conventional (2020-2028) ($MN)
35 North America Manuka Honey Market Outlook, By Organic (2020-2028) ($MN)
36 North America Manuka Honey Market Outlook, By Other Natures (2020-2028) ($MN)
37 North America Manuka Honey Market Outlook, By Form (2020-2028) ($MN)
38 North America Manuka Honey Market Outlook, By UMF 20+ (2020-2028) ($MN)
39 North America Manuka Honey Market Outlook, By UMF 15+ (2020-2028) ($MN)
40 North America Manuka Honey Market Outlook, By UMF 10+ (2020-2028) ($MN)
41 North America Manuka Honey Market Outlook, By UMF 5+ (2020-2028) ($MN)
42 North America Manuka Honey Market Outlook, By Other Forms (2020-2028) ($MN)
43 North America Manuka Honey Market Outlook, By Distribution Channel (2020-2028) ($MN)
44 North America Manuka Honey Market Outlook, By Convenience Stores (2020-2028) ($MN)
45 North America Manuka Honey Market Outlook, By Online Stores (2020-2028) ($MN)
46 North America Manuka Honey Market Outlook, By Hypermarkets & Supermarkets (2020-2028) ($MN)
47 North America Manuka Honey Market Outlook, By Other Distribution Channels (2020-2028) ($MN)
48 North America Manuka Honey Market Outlook, By End User (2020-2028) ($MN)
49 North America Manuka Honey Market Outlook, By Bakery & Confectionery (2020-2028) ($MN)
50 North America Manuka Honey Market Outlook, By Pharmaceuticals (2020-2028) ($MN)
51 North America Manuka Honey Market Outlook, By Food & Beverages (2020-2028) ($MN)
52 North America Manuka Honey Market Outlook, By Cosmetics & Personal Care (2020-2028) ($MN)
53 North America Manuka Honey Market Outlook, By Dairy Products (2020-2028) ($MN)
54 North America Manuka Honey Market Outlook, By Other End Users (2020-2028) ($MN)
55 Europe Manuka Honey Market Outlook, By Country (2020-2028) ($MN)
56 Europe Manuka Honey Market Outlook, By Product Type (2020-2028) ($MN)
57 Europe Manuka Honey Market Outlook, By Processed Manuka Honey (2020-2028) ($MN)
58 Europe Manuka Honey Market Outlook, By Raw Manuka Honey (2020-2028) ($MN)
59 Europe Manuka Honey Market Outlook, By Other Product Types (2020-2028) ($MN)
60 Europe Manuka Honey Market Outlook, By Nature (2020-2028) ($MN)
61 Europe Manuka Honey Market Outlook, By Conventional (2020-2028) ($MN)
62 Europe Manuka Honey Market Outlook, By Organic (2020-2028) ($MN)
63 Europe Manuka Honey Market Outlook, By Other Natures (2020-2028) ($MN)
64 Europe Manuka Honey Market Outlook, By Form (2020-2028) ($MN)
65 Europe Manuka Honey Market Outlook, By UMF 20+ (2020-2028) ($MN)
66 Europe Manuka Honey Market Outlook, By UMF 15+ (2020-2028) ($MN)
67 Europe Manuka Honey Market Outlook, By UMF 10+ (2020-2028) ($MN)
68 Europe Manuka Honey Market Outlook, By UMF 5+ (2020-2028) ($MN)
69 Europe Manuka Honey Market Outlook, By Other Forms (2020-2028) ($MN)
70 Europe Manuka Honey Market Outlook, By Distribution Channel (2020-2028) ($MN)
71 Europe Manuka Honey Market Outlook, By Convenience Stores (2020-2028) ($MN)
72 Europe Manuka Honey Market Outlook, By Online Stores (2020-2028) ($MN)
73 Europe Manuka Honey Market Outlook, By Hypermarkets & Supermarkets (2020-2028) ($MN)
74 Europe Manuka Honey Market Outlook, By Other Distribution Channels (2020-2028) ($MN)
75 Europe Manuka Honey Market Outlook, By End User (2020-2028) ($MN)
76 Europe Manuka Honey Market Outlook, By Bakery & Confectionery (2020-2028) ($MN)
77 Europe Manuka Honey Market Outlook, By Pharmaceuticals (2020-2028) ($MN)
78 Europe Manuka Honey Market Outlook, By Food & Beverages (2020-2028) ($MN)
79 Europe Manuka Honey Market Outlook, By Cosmetics & Personal Care (2020-2028) ($MN)
80 Europe Manuka Honey Market Outlook, By Dairy Products (2020-2028) ($MN)
81 Europe Manuka Honey Market Outlook, By Other End Users (2020-2028) ($MN)
82 Asia Pacific Manuka Honey Market Outlook, By Country (2020-2028) ($MN)
83 Asia Pacific Manuka Honey Market Outlook, By Product Type (2020-2028) ($MN)
84 Asia Pacific Manuka Honey Market Outlook, By Processed Manuka Honey (2020-2028) ($MN)
85 Asia Pacific Manuka Honey Market Outlook, By Raw Manuka Honey (2020-2028) ($MN)
86 Asia Pacific Manuka Honey Market Outlook, By Other Product Types (2020-2028) ($MN)
87 Asia Pacific Manuka Honey Market Outlook, By Nature (2020-2028) ($MN)
88 Asia Pacific Manuka Honey Market Outlook, By Conventional (2020-2028) ($MN)
89 Asia Pacific Manuka Honey Market Outlook, By Organic (2020-2028) ($MN)
90 Asia Pacific Manuka Honey Market Outlook, By Other Natures (2020-2028) ($MN)
91 Asia Pacific Manuka Honey Market Outlook, By Form (2020-2028) ($MN)
92 Asia Pacific Manuka Honey Market Outlook, By UMF 20+ (2020-2028) ($MN)
93 Asia Pacific Manuka Honey Market Outlook, By UMF 15+ (2020-2028) ($MN)
94 Asia Pacific Manuka Honey Market Outlook, By UMF 10+ (2020-2028) ($MN)
95 Asia Pacific Manuka Honey Market Outlook, By UMF 5+ (2020-2028) ($MN)
96 Asia Pacific Manuka Honey Market Outlook, By Other Forms (2020-2028) ($MN)
97 Asia Pacific Manuka Honey Market Outlook, By Distribution Channel (2020-2028) ($MN)
98 Asia Pacific Manuka Honey Market Outlook, By Convenience Stores (2020-2028) ($MN)
99 Asia Pacific Manuka Honey Market Outlook, By Online Stores (2020-2028) ($MN)
100 Asia Pacific Manuka Honey Market Outlook, By Hypermarkets & Supermarkets (2020-2028) ($MN)
101 Asia Pacific Manuka Honey Market Outlook, By Other Distribution Channels (2020-2028) ($MN)
102 Asia Pacific Manuka Honey Market Outlook, By End User (2020-2028) ($MN)
103 Asia Pacific Manuka Honey Market Outlook, By Bakery & Confectionery (2020-2028) ($MN)
104 Asia Pacific Manuka Honey Market Outlook, By Pharmaceuticals (2020-2028) ($MN)
105 Asia Pacific Manuka Honey Market Outlook, By Food & Beverages (2020-2028) ($MN)
106 Asia Pacific Manuka Honey Market Outlook, By Cosmetics & Personal Care (2020-2028) ($MN)
107 Asia Pacific Manuka Honey Market Outlook, By Dairy Products (2020-2028) ($MN)
108 Asia Pacific Manuka Honey Market Outlook, By Other End Users (2020-2028) ($MN)
109 South America Manuka Honey Market Outlook, By Country (2020-2028) ($MN)
110 South America Manuka Honey Market Outlook, By Product Type (2020-2028) ($MN)
111 South America Manuka Honey Market Outlook, By Processed Manuka Honey (2020-2028) ($MN)
112 South America Manuka Honey Market Outlook, By Raw Manuka Honey (2020-2028) ($MN)
113 South America Manuka Honey Market Outlook, By Other Product Types (2020-2028) ($MN)
114 South America Manuka Honey Market Outlook, By Nature (2020-2028) ($MN)
115 South America Manuka Honey Market Outlook, By Conventional (2020-2028) ($MN)
116 South America Manuka Honey Market Outlook, By Organic (2020-2028) ($MN)
117 South America Manuka Honey Market Outlook, By Other Natures (2020-2028) ($MN)
118 South America Manuka Honey Market Outlook, By Form (2020-2028) ($MN)
119 South America Manuka Honey Market Outlook, By UMF 20+ (2020-2028) ($MN)
120 South America Manuka Honey Market Outlook, By UMF 15+ (2020-2028) ($MN)
121 South America Manuka Honey Market Outlook, By UMF 10+ (2020-2028) ($MN)
122 South America Manuka Honey Market Outlook, By UMF 5+ (2020-2028) ($MN)
123 South America Manuka Honey Market Outlook, By Other Forms (2020-2028) ($MN)
124 South America Manuka Honey Market Outlook, By Distribution Channel (2020-2028) ($MN)
125 South America Manuka Honey Market Outlook, By Convenience Stores (2020-2028) ($MN)
126 South America Manuka Honey Market Outlook, By Online Stores (2020-2028) ($MN)
127 South America Manuka Honey Market Outlook, By Hypermarkets & Supermarkets (2020-2028) ($MN)
128 South America Manuka Honey Market Outlook, By Other Distribution Channels (2020-2028) ($MN)
129 South America Manuka Honey Market Outlook, By End User (2020-2028) ($MN)
130 South America Manuka Honey Market Outlook, By Bakery & Confectionery (2020-2028) ($MN)
131 South America Manuka Honey Market Outlook, By Pharmaceuticals (2020-2028) ($MN)
132 South America Manuka Honey Market Outlook, By Food & Beverages (2020-2028) ($MN)
133 South America Manuka Honey Market Outlook, By Cosmetics & Personal Care (2020-2028) ($MN)
134 South America Manuka Honey Market Outlook, By Dairy Products (2020-2028) ($MN)
135 South America Manuka Honey Market Outlook, By Other End Users (2020-2028) ($MN)
136 Middle East & Africa Manuka Honey Market Outlook, By Country (2020-2028) ($MN)
137 Middle East & Africa Manuka Honey Market Outlook, By Product Type (2020-2028) ($MN)
138 Middle East & Africa Manuka Honey Market Outlook, By Processed Manuka Honey (2020-2028) ($MN)
139 Middle East & Africa Manuka Honey Market Outlook, By Raw Manuka Honey (2020-2028) ($MN)
140 Middle East & Africa Manuka Honey Market Outlook, By Other Product Types (2020-2028) ($MN)
141 Middle East & Africa Manuka Honey Market Outlook, By Nature (2020-2028) ($MN)
142 Middle East & Africa Manuka Honey Market Outlook, By Conventional (2020-2028) ($MN)
143 Middle East & Africa Manuka Honey Market Outlook, By Organic (2020-2028) ($MN)
144 Middle East & Africa Manuka Honey Market Outlook, By Other Natures (2020-2028) ($MN)
145 Middle East & Africa Manuka Honey Market Outlook, By Form (2020-2028) ($MN)
146 Middle East & Africa Manuka Honey Market Outlook, By UMF 20+ (2020-2028) ($MN)
147 Middle East & Africa Manuka Honey Market Outlook, By UMF 15+ (2020-2028) ($MN)
148 Middle East & Africa Manuka Honey Market Outlook, By UMF 10+ (2020-2028) ($MN)
149 Middle East & Africa Manuka Honey Market Outlook, By UMF 5+ (2020-2028) ($MN)
150 Middle East & Africa Manuka Honey Market Outlook, By Other Forms (2020-2028) ($MN)
151 Middle East & Africa Manuka Honey Market Outlook, By Distribution Channel (2020-2028) ($MN)
152 Middle East & Africa Manuka Honey Market Outlook, By Convenience Stores (2020-2028) ($MN)
153 Middle East & Africa Manuka Honey Market Outlook, By Online Stores (2020-2028) ($MN)
154 Middle East & Africa Manuka Honey Market Outlook, By Hypermarkets & Supermarkets (2020-2028) ($MN)
155 Middle East & Africa Manuka Honey Market Outlook, By Other Distribution Channels (2020-2028) ($MN)
156 Middle East & Africa Manuka Honey Market Outlook, By End User (2020-2028) ($MN)
157 Middle East & Africa Manuka Honey Market Outlook, By Bakery & Confectionery (2020-2028) ($MN)
158 Middle East & Africa Manuka Honey Market Outlook, By Pharmaceuticals (2020-2028) ($MN)
159 Middle East & Africa Manuka Honey Market Outlook, By Food & Beverages (2020-2028) ($MN)
160 Middle East & Africa Manuka Honey Market Outlook, By Cosmetics & Personal Care (2020-2028) ($MN)
161 Middle East & Africa Manuka Honey Market Outlook, By Dairy Products (2020-2028) ($MN)
162 Middle East & Africa Manuka Honey Market Outlook, By Other End Users (2020-2028) ($MN)
List of Figures
RESEARCH METHODOLOGY

We at ‘Stratistics’ opt for an extensive research approach which involves data mining, data validation, and data analysis. The various research sources include in-house repository, secondary research, competitor’s sources, social media research, client internal data, and primary research.
Our team of analysts prefers the most reliable and authenticated data sources in order to perform the comprehensive literature search. With access to most of the authenticated data bases our team highly considers the best mix of information through various sources to obtain extensive and accurate analysis.
Each report takes an average time of a month and a team of 4 industry analysts. The time may vary depending on the scope and data availability of the desired market report. The various parameters used in the market assessment are standardized in order to enhance the data accuracy.
Data Mining
The data is collected from several authenticated, reliable, paid and unpaid sources and is filtered depending on the scope & objective of the research. Our reports repository acts as an added advantage in this procedure. Data gathering from the raw material suppliers, distributors and the manufacturers is performed on a regular basis, this helps in the comprehensive understanding of the products value chain. Apart from the above mentioned sources the data is also collected from the industry consultants to ensure the objective of the study is in the right direction.
Market trends such as technological advancements, regulatory affairs, market dynamics (Drivers, Restraints, Opportunities and Challenges) are obtained from scientific journals, market related national & international associations and organizations.
Data Analysis
From the data that is collected depending on the scope & objective of the research the data is subjected for the analysis. The critical steps that we follow for the data analysis include:
- Product Lifecycle Analysis
- Competitor analysis
- Risk analysis
- Porters Analysis
- PESTEL Analysis
- SWOT Analysis
The data engineering is performed by the core industry experts considering both the Marketing Mix Modeling and the Demand Forecasting. The marketing mix modeling makes use of multiple-regression techniques to predict the optimal mix of marketing variables. Regression factor is based on a number of variables and how they relate to an outcome such as sales or profits.
Data Validation
The data validation is performed by the exhaustive primary research from the expert interviews. This includes telephonic interviews, focus groups, face to face interviews, and questionnaires to validate our research from all aspects. The industry experts we approach come from the leading firms, involved in the supply chain ranging from the suppliers, distributors to the manufacturers and consumers so as to ensure an unbiased analysis.
We are in touch with more than 15,000 industry experts with the right mix of consultants, CEO's, presidents, vice presidents, managers, experts from both supply side and demand side, executives and so on.
The data validation involves the primary research from the industry experts belonging to:
- Leading Companies
- Suppliers & Distributors
- Manufacturers
- Consumers
- Industry/Strategic Consultants
Apart from the data validation the primary research also helps in performing the fill gap research, i.e. providing solutions for the unmet needs of the research which helps in enhancing the reports quality.
For more details about research methodology, kindly write to us at info@strategymrc.com
Frequently Asked Questions
In case of any queries regarding this report, you can contact the customer service by filing the “Inquiry Before Buy” form available on the right hand side. You may also contact us through email: info@strategymrc.com or phone: +1-301-202-5929
Yes, the samples are available for all the published reports. You can request them by filling the “Request Sample” option available in this page.
Yes, you can request a sample with your specific requirements. All the customized samples will be provided as per the requirement with the real data masked.
All our reports are available in Digital PDF format. In case if you require them in any other formats, such as PPT, Excel etc you can submit a request through “Inquiry Before Buy” form available on the right hand side. You may also contact us through email: info@strategymrc.com or phone: +1-301-202-5929
We offer a free 15% customization with every purchase. This requirement can be fulfilled for both pre and post sale. You may send your customization requirements through email at info@strategymrc.com or call us on +1-301-202-5929.
We have 3 different licensing options available in electronic format.
- Single User Licence: Allows one person, typically the buyer, to have access to the ordered product. The ordered product cannot be distributed to anyone else.
- 2-5 User Licence: Allows the ordered product to be shared among a maximum of 5 people within your organisation.
- Corporate License: Allows the product to be shared among all employees of your organisation regardless of their geographical location.
All our reports are typically be emailed to you as an attachment.
To order any available report you need to register on our website. The payment can be made either through CCAvenue or PayPal payments gateways which accept all international cards.
We extend our support to 6 months post sale. A post sale customization is also provided to cover your unmet needs in the report.
Request Customization
We offer complimentary customization of up to 15% with every purchase. To share your customization requirements, feel free to email us at info@strategymrc.com or call us on +1-301-202-5929. .
Please Note: Customization within the 15% threshold is entirely free of charge. If your request exceeds this limit, we will conduct a feasibility assessment. Following that, a detailed quote and timeline will be provided.
WHY CHOOSE US ?

Assured Quality
Best in class reports with high standard of research integrity

24X7 Research Support
Continuous support to ensure the best customer experience.

Free Customization
Adding more values to your product of interest.

Safe & Secure Access
Providing a secured environment for all online transactions.

Trusted by 600+ Brands
Serving the most reputed brands across the world.