
Motor Monitoring Market
Motor Monitoring Market Forecasts to 2028 – Global Analysis By Monitoring Process (Oil Analysis, Motor Current Analysis, Ultrasound), Offering (Software, Hardware, Services), Deployment, End User, and By Geography

|
Years Covered |
2020-2028 |
|
Estimated Year Value (2021) |
US $1.96 BN |
|
Projected Year Value (2028) |
US $3.40 BN |
|
CAGR (2021 - 2028) |
8.2% |
|
Regions Covered |
North America, Europe, Asia Pacific, South America, and Middle East & Africa |
|
Countries Covered |
US, Canada, Mexico, Germany, UK, Italy, France, Spain, Japan, China, India, Australia, New Zealand, South Korea, Rest of Asia Pacific, South America, Argentina, Brazil, Chile, Middle East & Africa, Saudi Arabia, UAE, Qatar, and South Africa |
|
Largest Market |
North America |
|
Fastest Growing Market |
Asia Pacific |
According to Stratistics MRC, the Global Motor Monitoring Market is accounted for $1.96 billion in 2021 and is expected to reach $3.40 billion by 2028 growing at a CAGR of 8.2% during the forecast period. Motor monitoring is the collection, sorting, and analyzation of streamed data from components such as sensors, detectors, and others on the device. The data analyzed in then processed through the software using various algorithms and monitoring process. Therefore, motor monitoring is available as the combination of hardware and software.
Market Dynamics:
Driver:
Rising awareness of predictive maintenance and augmenting
Rising awareness of predictive maintenance and augmenting it with analytics drive the market. The importance of electric motor monitoring is connected with the damages deriving from the failure of even a single motor. Further implementing predictive maintenance and training the internal maintenance staff, with the goal of making them autonomous in the shortest possible time, is one of the low-cost solutions. Rule-based predictive maintenance relies on sensors to continuously collect data about assets, and sends alerts according to predefined rules, including when a specified threshold has been reached. With rule-based analytics, product teams work alongside engineering and customer service departments to establish causes or contributing factors to their motor failing.
Restraint:
Lacking customization with the high initial investment
The lacking customization with high initial investment, is restraints the growth of the market. Due to the integration of new technologies, industrial systems are becoming more complex. At the same time, it makes maintenance and monitoring activities more expensive and complicated to get reliable data on time. The more sensors will be integrated into the system; the more data will be generated that should be handled. But processing this growing number of data through database technologies will be challenging.
Opportunity:
Growing adoption of wireless systems
The growing adoption of wireless systems for motor monitoring drives the market. Electrical motors and drives consume about 45% of the power generation. On contrary, if the electrical machines are not maintained properly, it consumes about 5% to 10 % of excess power, which affects productivity and revenue. Wireless monitoring of the motor is capable of capturing the machine parameters more accurately with automatic detection of abnormal conditions and reporting to the server within a few microseconds. The advantage of wireless technology is that it is very reliable and operates even at very slow network speed and handles multiple devices at once. The designed system is easy to install and scale up to large industrial setup as it does not involve a complex mechanism and uses a lightweight MQTT protocol.
Threat:
Lack of skilled professionals
Rising adoption of predictive maintenance and other monitoring solutions is compelling enterprises to appoint a dedicated data analysis team. In addition, motor manufacturing companies do not readily provide the monitoring solutions; thus, to avail monitoring solutions, industries have to look for other companies that have expertise in providing monitoring solutions. To monitor the data points coming from motor monitoring, different skill sets are required, which demands the training of staff as well as setting up a standard procedure for motor monitoring. The lack of skilled professionals at reasonable costs is expected to be the factor threatens the market growth during the forecast period.
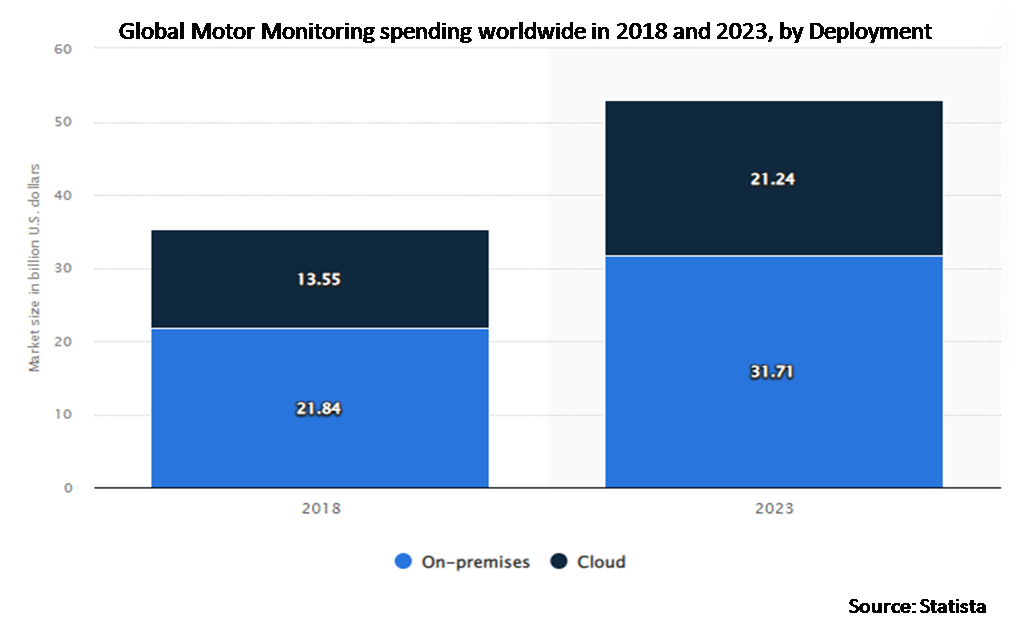
The on-premises segment is expected to be the largest during the forecast period
The on-premises segment is estimated to have a lucrative growth. On-premises solution is installed locally on bearings, shafts, computers, servers, and motors within a company’s premises. Industries get a complete control over the data when they deploy on-premises solutions as the data is physically stored at the premises of the industry. Some of the benefits associated with on-premise deployment include better control over the overall system, as the hardware, data, and software platform is owned and managed by the company, and reduced dependency on external factors such as network and third-party dealers. Hence, the chance of data security is higher in on-premise deployment compared to cloud storage.
The hardware segment is expected to have the highest CAGR during the forecast period
The hardware segment is anticipated to witness the fastest CAGR growth during the forecast period owing to the government initiatives toward implementing energy audits with an increase in mandatory regulations, growing demand for electric vehicles (EVs), and a growing market for Internet of Things (IoT). The hardware segment mainly includes vibration sensors, infrared sensors, ultrasound detectors, spectrum analyzers, and corrosion probes.
Region with highest share:
North America is projected to hold the largest market share during the forecast period. This is due to the presence of major players coupled with quick adoption of advanced technologies and infrastructure networks in the region. Moreover, the regional market will expand further as it is witnessing constant advancements in motor monitoring software, such as improved security measures for cloud users and developments in cloud computing thereby increasing the product demand.
Region with highest CAGR:
Asia Pacific is projected to have the highest CAGR over the forecast period due to the increase in industrial growth in countries such as China and India. China is one for the global hub for manufacturing and has the largest population worldwide, boosting investments in the power as well as in the infrastructure sector. The Chinese government, in the past, announced investments worth USD 78 billion for developing 110 nuclear power plants, which is planned to start operations by 2030. Such initiative developments are expected to widen the scope of the adoption of modern technologies, including vibration monitoring solutions, to assist condition-based monitoring for the motor.

Key players in the market
Some of the key players profiled in the Motor Monitoring Market include ABB, Advantech, Banner Engineering, Dynapar, Eaton, Emerson, General Electric, Honeywell, Mitsubishi Electric, National Instruments, Qualitrol, Rockwell Automation, Schneider Electric, Siemens, and SKF.
Key Developments:
In September 2021, Siemens and Empolis cooperate on digitalizing and structuring organizational knowledge for drive systems. The cooperation of Siemens Large Drives Applications and Empolis targets to further strengthen the foundation for insight generation in SIDRIVE IQ – the digital platform for drive systems & solutions of Siemens. With the power of knowledge graphs at the core of Empolis Intelligent Views Platform ® already existing data in documents, applications or employees’ minds becomes progressively available, easily accessible and automatically reusable.
In March 2021, GE Power Conversion launches Connectix™ Intuitive software applications and expert services to drive operational and business outcomes that matter. The digital expertise and visualization technology embedded in this software suite will allow our customers to increase energy efficiency and asset availability, through easier and faster decision-making, creating more value in their daily operations.
Monitoring Processes Covered:
• Oil Analysis
• Motor Current Analysis
• Ultrasound
• Thermography
• Vibration Analysis
Offerings Covered:
• Software
• Hardware
• Services
Deployments Covered:
• Cloud
• On-premise
End Users Covered:
• Agriculture
• Automotive
• Chemicals
• Electronics & Semiconductors
• Food & Beverages
• Metals & Mining
• Oil & Gas
• Power Generation
• Water & Wastewater Treatment
Regions Covered:
• North America
o US
o Canada
o Mexico
• Europe
o Germany
o UK
o Italy
o France
o Spain
o Rest of Europe
• Asia Pacific
o Japan
o China
o India
o Australia
o New Zealand
o South Korea
o Rest of Asia Pacific
• South America
o Argentina
o Brazil
o Chile
o Rest of South America
• Middle East & Africa
o Saudi Arabia
o UAE
o Qatar
o South Africa
o Rest of Middle East & Africa
What our report offers:
- Market share assessments for the regional and country-level segments
- Strategic recommendations for the new entrants
- Covers Market data for the years 2020, 2021, 2022, 2025, and 2028
- Market Trends (Drivers, Constraints, Opportunities, Threats, Challenges, Investment Opportunities, and recommendations)
- Strategic recommendations in key business segments based on the market estimations
- Competitive landscaping mapping the key common trends
- Company profiling with detailed strategies, financials, and recent developments
- Supply chain trends mapping the latest technological advancements
Free Customization Offerings:
All the customers of this report will be entitled to receive one of the following free customization options:
• Company Profiling
o Comprehensive profiling of additional market players (up to 3)
o SWOT Analysis of key players (up to 3)
• Regional Segmentation
o Market estimations, Forecasts and CAGR of any prominent country as per the client's interest (Note: Depends on feasibility check)
• Competitive Benchmarking
o Benchmarking of key players based on product portfolio, geographical presence, and strategic alliances
Table of Contents
1 Executive Summary
2 Preface
2.1 Abstract
2.2 Stake Holders
2.3 Research Scope
2.4 Research Methodology
2.4.1 Data Mining
2.4.2 Data Analysis
2.4.3 Data Validation
2.4.4 Research Approach
2.5 Research Sources
2.5.1 Primary Research Sources
2.5.2 Secondary Research Sources
2.5.3 Assumptions
3 Market Trend Analysis
3.1 Introduction
3.2 Drivers
3.3 Restraints
3.4 Opportunities
3.5 Threats
3.6 End User Analysis
3.7 Emerging Markets
3.8 Impact of Covid-19
4 Porters Five Force Analysis
4.1 Bargaining power of suppliers
4.2 Bargaining power of buyers
4.3 Threat of substitutes
4.4 Threat of new entrants
4.5 Competitive rivalry
5 Global Motor Monitoring Market, By Monitoring Process
5.1 Introduction
5.2 Oil Analysis
5.3 Motor Current Analysis
5.4 Ultrasound
5.5 Thermography
5.6 Vibration Analysis
6 Global Motor Monitoring Market, By Offering
6.1 Introduction
6.2 Software
6.2.1 Diagnostic Software
6.2.2 Data Integration
6.2.3 Parameter Calculation
6.2.4 Analytics Software
6.3 Hardware
6.3.1 Corrosion Probes
6.3.2 Infrared Sensors
6.3.3 Spectrum Analyzers
6.3.4 Spectrometer
6.3.5 Ultrasound Detectors
6.3.6 Vibration Sensors
6.4 Services
6.4.1 Data Analysis Services
6.4.2 Technical Support & Maintenance Services
6.4.3 Training Services
7 Global Motor Monitoring Market, By Deployment
7.1 Introduction
7.2 Cloud
7.3 On-premise
8 Global Motor Monitoring Market, By End User
8.1 Introduction
8.2 Agriculture
8.3 Automotive
8.4 Chemicals
8.5 Electronics & Semiconductors
8.6 Food & Beverages
8.7 Metals & Mining
8.8 Oil & Gas
8.9 Power Generation
8.10 Water & Wastewater Treatment
9 Global Motor Monitoring Market, By Geography
9.1 Introduction
9.2 North America
9.2.1 US
9.2.2 Canada
9.2.3 Mexico
9.3 Europe
9.3.1 Germany
9.3.2 UK
9.3.3 Italy
9.3.4 France
9.3.5 Spain
9.3.6 Rest of Europe
9.4 Asia Pacific
9.4.1 Japan
9.4.2 China
9.4.3 India
9.4.4 Australia
9.4.5 New Zealand
9.4.6 South Korea
9.4.7 Rest of Asia Pacific
9.5 South America
9.5.1 Argentina
9.5.2 Brazil
9.5.3 Chile
9.5.4 Rest of South America
9.6 Middle East & Africa
9.6.1 Saudi Arabia
9.6.2 UAE
9.6.3 Qatar
9.6.4 South Africa
9.6.5 Rest of Middle East & Africa
10 Key Developments
10.1 Agreements, Partnerships, Collaborations and Joint Ventures
10.2 Acquisitions & Mergers
10.3 New Product Launch
10.4 Expansions
10.5 Other Key Strategies
11 Company Profiling
11.1 ABB
11.2 Advantech
11.3 Banner Engineering
11.4 Dynapar
11.5 Eaton
11.6 Emerson
11.7 General Electric
11.8 Honeywell
11.9 Mitsubishi Electric
11.10 National Instruments
11.11 Qualitrol
11.12 Rockwell Automation
11.13 Schneider Electric
11.14 Siemens
11.15 SKF
List of Tables
1 Global Motor Monitoring Market Outlook, By Region (2020-2028) ($MN)
2 Global Motor Monitoring Market Outlook, By Monitoring Process (2020-2028) ($MN)
3 Global Motor Monitoring Market Outlook, By Oil Analysis (2020-2028) ($MN)
4 Global Motor Monitoring Market Outlook, By Motor Current Analysis (2020-2028) ($MN)
5 Global Motor Monitoring Market Outlook, By Ultrasound (2020-2028) ($MN)
6 Global Motor Monitoring Market Outlook, By Thermography (2020-2028) ($MN)
7 Global Motor Monitoring Market Outlook, By Vibration Analysis (2020-2028) ($MN)
8 Global Motor Monitoring Market Outlook, By Offering (2020-2028) ($MN)
9 Global Motor Monitoring Market Outlook, By Software (2020-2028) ($MN)
10 Global Motor Monitoring Market Outlook, By Diagnostic Software (2020-2028) ($MN)
11 Global Motor Monitoring Market Outlook, By Data Integration (2020-2028) ($MN)
12 Global Motor Monitoring Market Outlook, By Parameter Calculation (2020-2028) ($MN)
13 Global Motor Monitoring Market Outlook, By Analytics Software (2020-2028) ($MN)
14 Global Motor Monitoring Market Outlook, By Hardware (2020-2028) ($MN)
15 Global Motor Monitoring Market Outlook, By Corrosion Probes (2020-2028) ($MN)
16 Global Motor Monitoring Market Outlook, By Infrared Sensors (2020-2028) ($MN)
17 Global Motor Monitoring Market Outlook, By Spectrum Analyzers (2020-2028) ($MN)
18 Global Motor Monitoring Market Outlook, By Spectrometer (2020-2028) ($MN)
19 Global Motor Monitoring Market Outlook, By Ultrasound Detectors (2020-2028) ($MN)
20 Global Motor Monitoring Market Outlook, By Vibration Sensors (2020-2028) ($MN)
21 Global Motor Monitoring Market Outlook, By Services (2020-2028) ($MN)
22 Global Motor Monitoring Market Outlook, By Data Analysis Services (2020-2028) ($MN)
23 Global Motor Monitoring Market Outlook, By Technical Support & Maintenance Services (2020-2028) ($MN)
24 Global Motor Monitoring Market Outlook, By Training Services (2020-2028) ($MN)
25 Global Motor Monitoring Market Outlook, By Deployment (2020-2028) ($MN)
26 Global Motor Monitoring Market Outlook, By Cloud (2020-2028) ($MN)
27 Global Motor Monitoring Market Outlook, By On-premise (2020-2028) ($MN)
28 Global Motor Monitoring Market Outlook, By End User (2020-2028) ($MN)
29 Global Motor Monitoring Market Outlook, By Agriculture (2020-2028) ($MN)
30 Global Motor Monitoring Market Outlook, By Automotive (2020-2028) ($MN)
31 Global Motor Monitoring Market Outlook, By Chemicals (2020-2028) ($MN)
32 Global Motor Monitoring Market Outlook, By Electronics & Semiconductors (2020-2028) ($MN)
33 Global Motor Monitoring Market Outlook, By Food & Beverages (2020-2028) ($MN)
34 Global Motor Monitoring Market Outlook, By Metals & Mining (2020-2028) ($MN)
35 Global Motor Monitoring Market Outlook, By Oil & Gas (2020-2028) ($MN)
36 Global Motor Monitoring Market Outlook, By Power Generation (2020-2028) ($MN)
37 Global Motor Monitoring Market Outlook, By Water & Wastewater Treatment (2020-2028) ($MN)
Note: Tables for North America, Europe, APAC, South America, and Middle East & Africa Regions are also represented in the same manner as above.
List of Figures
RESEARCH METHODOLOGY

We at ‘Stratistics’ opt for an extensive research approach which involves data mining, data validation, and data analysis. The various research sources include in-house repository, secondary research, competitor’s sources, social media research, client internal data, and primary research.
Our team of analysts prefers the most reliable and authenticated data sources in order to perform the comprehensive literature search. With access to most of the authenticated data bases our team highly considers the best mix of information through various sources to obtain extensive and accurate analysis.
Each report takes an average time of a month and a team of 4 industry analysts. The time may vary depending on the scope and data availability of the desired market report. The various parameters used in the market assessment are standardized in order to enhance the data accuracy.
Data Mining
The data is collected from several authenticated, reliable, paid and unpaid sources and is filtered depending on the scope & objective of the research. Our reports repository acts as an added advantage in this procedure. Data gathering from the raw material suppliers, distributors and the manufacturers is performed on a regular basis, this helps in the comprehensive understanding of the products value chain. Apart from the above mentioned sources the data is also collected from the industry consultants to ensure the objective of the study is in the right direction.
Market trends such as technological advancements, regulatory affairs, market dynamics (Drivers, Restraints, Opportunities and Challenges) are obtained from scientific journals, market related national & international associations and organizations.
Data Analysis
From the data that is collected depending on the scope & objective of the research the data is subjected for the analysis. The critical steps that we follow for the data analysis include:
- Product Lifecycle Analysis
- Competitor analysis
- Risk analysis
- Porters Analysis
- PESTEL Analysis
- SWOT Analysis
The data engineering is performed by the core industry experts considering both the Marketing Mix Modeling and the Demand Forecasting. The marketing mix modeling makes use of multiple-regression techniques to predict the optimal mix of marketing variables. Regression factor is based on a number of variables and how they relate to an outcome such as sales or profits.
Data Validation
The data validation is performed by the exhaustive primary research from the expert interviews. This includes telephonic interviews, focus groups, face to face interviews, and questionnaires to validate our research from all aspects. The industry experts we approach come from the leading firms, involved in the supply chain ranging from the suppliers, distributors to the manufacturers and consumers so as to ensure an unbiased analysis.
We are in touch with more than 15,000 industry experts with the right mix of consultants, CEO's, presidents, vice presidents, managers, experts from both supply side and demand side, executives and so on.
The data validation involves the primary research from the industry experts belonging to:
- Leading Companies
- Suppliers & Distributors
- Manufacturers
- Consumers
- Industry/Strategic Consultants
Apart from the data validation the primary research also helps in performing the fill gap research, i.e. providing solutions for the unmet needs of the research which helps in enhancing the reports quality.
For more details about research methodology, kindly write to us at info@strategymrc.com
Frequently Asked Questions
In case of any queries regarding this report, you can contact the customer service by filing the “Inquiry Before Buy” form available on the right hand side. You may also contact us through email: info@strategymrc.com or phone: +1-301-202-5929
Yes, the samples are available for all the published reports. You can request them by filling the “Request Sample” option available in this page.
Yes, you can request a sample with your specific requirements. All the customized samples will be provided as per the requirement with the real data masked.
All our reports are available in Digital PDF format. In case if you require them in any other formats, such as PPT, Excel etc you can submit a request through “Inquiry Before Buy” form available on the right hand side. You may also contact us through email: info@strategymrc.com or phone: +1-301-202-5929
We offer a free 15% customization with every purchase. This requirement can be fulfilled for both pre and post sale. You may send your customization requirements through email at info@strategymrc.com or call us on +1-301-202-5929.
We have 3 different licensing options available in electronic format.
- Single User Licence: Allows one person, typically the buyer, to have access to the ordered product. The ordered product cannot be distributed to anyone else.
- 2-5 User Licence: Allows the ordered product to be shared among a maximum of 5 people within your organisation.
- Corporate License: Allows the product to be shared among all employees of your organisation regardless of their geographical location.
All our reports are typically be emailed to you as an attachment.
To order any available report you need to register on our website. The payment can be made either through CCAvenue or PayPal payments gateways which accept all international cards.
We extend our support to 6 months post sale. A post sale customization is also provided to cover your unmet needs in the report.
Request Customization
We offer complimentary customization of up to 15% with every purchase. To share your customization requirements, feel free to email us at info@strategymrc.com or call us on +1-301-202-5929. .
Please Note: Customization within the 15% threshold is entirely free of charge. If your request exceeds this limit, we will conduct a feasibility assessment. Following that, a detailed quote and timeline will be provided.
WHY CHOOSE US ?

Assured Quality
Best in class reports with high standard of research integrity

24X7 Research Support
Continuous support to ensure the best customer experience.

Free Customization
Adding more values to your product of interest.

Safe & Secure Access
Providing a secured environment for all online transactions.

Trusted by 600+ Brands
Serving the most reputed brands across the world.