
Photonic Design Automation Market
Photonic Design Automation Market Forecasts to 2030 - Global Analysis By Component (Solution and Service), Deployment (On-Premise and Cloud), Organization Size, Application, End User and By Geography

|
Years Covered |
2021-2030 |
|
Estimated Year Value (2023) |
US $1.61 BN |
|
Projected Year Value (2030) |
US $4.49 BN |
|
CAGR (2023 - 2030) |
15.8% |
|
Regions Covered |
North America, Europe, Asia Pacific, South America, and Middle East & Africa |
|
Countries Covered |
US, Canada, Mexico, Germany, UK, Italy, France, Spain, Japan, China, India, Australia, New Zealand, South Korea, Rest of Asia Pacific, South America, Argentina, Brazil, Chile, Middle East & Africa, Saudi Arabia, UAE, Qatar, and South Africa |
|
Largest Market |
Asia Pacific |
|
Highest Growing Market |
North America |
According to Stratistics MRC, the Global Photonic Design Automation Market is accounted for $1.61 billion in 2023 and is expected to reach $4.49 billion by 2030 growing at a CAGR of 15.8% during the forecast period. Photonic Design Automation (PDA) is a computer-aided design (CAD) approach tailored for the intricate design and optimization of photonic devices and systems. It integrates specialized algorithms and simulation tools to model, simulate, and optimize the behavior and performance of optical components like waveguides, lasers, and photo detectors. By providing a comprehensive platform for design exploration and validation, PDA accelerates the development of advanced photonic technologies, enabling innovations in telecommunications, data processing and sensing.
Market Dynamics:
Driver:
Rising demand for faster, more efficient communication systems
As the world becomes increasingly reliant on high-speed data transmission and communication networks, there is a pressing need for photonic components and systems that can facilitate rapid and reliable data transfer. Photonic design automation tools play a crucial role in meeting this demand by enabling the development and optimization of innovative photonic devices and systems. Overall, demand for faster, more efficient communication systems is a significant driver of market growth.
Restraint:
High development costs
Developing photonic devices and systems involves substantial investments in research, development, prototyping, and fabrication. The specialized equipment, materials, and fabrication processes required for photonic technologies contribute to high upfront costs, making it challenging for companies. Additionally, the complexity of photonic designs often requires skilled professionals with expertise in both photonics and electronic design automation (EDA), further increasing development costs that hinder market demand.
Opportunity:
Increasing adoption of photonic technologies
Industries such as healthcare, automotive, aerospace, and consumer electronics are increasingly leveraging photonic technologies for various applications, including medical imaging, LiDAR systems, environmental monitoring, and advanced displays. PDA tools play a crucial role in designing and optimizing photonic components to meet stringent performance requirements and ensure reliable network operation. As the adoption of photonic technologies continues to expand across diverse sectors, the demand for PDA solutions is expected to rise.
Threat:
Complexity of photonic designs
Photonic devices and systems often involve intricate designs and interactions between optical and electrical components, requiring expertise in both photonics and electronic design automation (EDA). Moreover, designing and optimizing photonic components such as waveguides, modulators, and detectors can be challenging due to the complex physical phenomena involved, including light propagation, polarization effects, and nonlinear optics. Therefore, the complexity of photonic designs is a significant factor limiting market expansion.
Covid-19 Impact
The COVID-19 pandemic had a mixed impact on the Photonic Design Automation (PDA) market. Initially, the pandemic disrupted supply chains, slowed down manufacturing processes, and hampered research activities, leading to delays in product development and deployment. However, the pandemic also highlighted the importance of advanced technologies like photonic devices and systems in addressing global challenges. As a result, there has been increased interest and investment in photonic technologies for applications such as telemedicine, remote sensing, and high-speed communications, driving demand for PDA solutions.
The cloud segment is expected to be the largest during the forecast period
The cloud segment is estimated to hold the largest share. By leveraging cloud infrastructure, engineers and researchers can access powerful computational resources on-demand, enabling them to perform complex simulations and optimizations without the need for expensive on-premises hardware. Furthermore, cloud-based PDA solutions offer greater flexibility, enabling collaboration and remote access to design tools and data from anywhere with an internet connection.
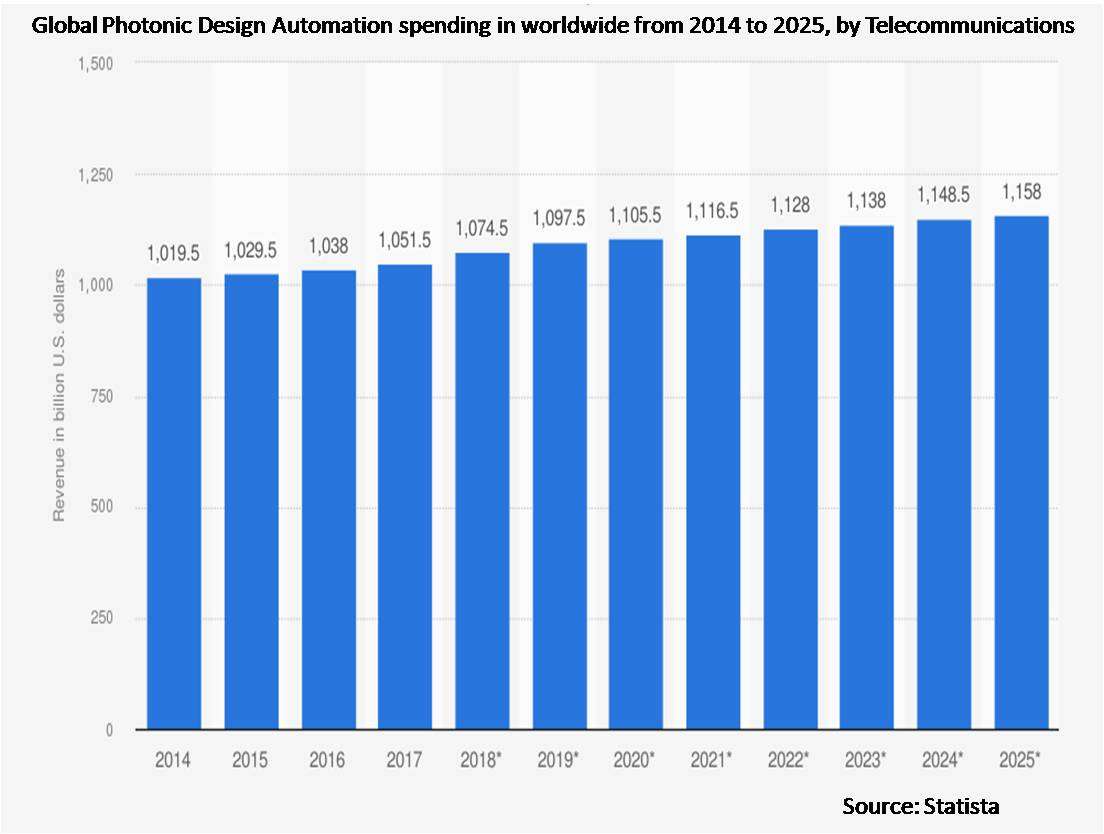
The telecommunications segment is expected to have the highest CAGR during the forecast period
The telecommunications segment is anticipated to have lucrative growth during the forecast period. Photonic components such as optical fibers, lasers, modulators, and photo detectors play critical roles in enabling high-speed data transmission, powering the backbone of modern telecommunications networks. Moreover, PDA solutions are instrumental in the design and optimization of photonic devices tailored for telecommunications applications. Overall, telecommunications represents a key market segment driving growth and innovation in the photonic design automation market.
Region with largest share:
Asia Pacific commanded the largest market share during the extrapolated period owing to the strong manufacturing base, coupled with robust research and development initiatives. As one of the leading regions in technological advancement and innovation, countries like China, South Korea, Taiwan, and Singapore are actively investing in the development and adoption of photonic technologies. Additionally, Japan, renowned for its expertise in optical communication and semiconductor manufacturing, continues to contribute significantly to advancements in photonic design tools and methodologies.
Region with highest CAGR:
North America is expected to witness profitable growth over the projection period, fuelled by a combination of technological innovation, a strong industrial base, and significant research and development activities. The United States and Canada are the primary drivers of growth in this region, hosting a multitude of companies, research institutions, and universities at the forefront of photonics research and development. Moreover, North America benefits from a favourable regulatory environment and substantial investment in advanced technologies, further propelling the growth of the PDA market.

Key players in the market
Some of the key players in the Photonic Design Automation Market include Siemens AG, Ansys Inc, VPlphotonics GmbH, Luceda Photonics, LioniX International BV, Optiwave Systems Inc, Cadence Design Systems Inc, Synopsys Inc, AIM Photonics Inc and SystemLab Inc.
Key Developments:
In October 2023, Synopsys announced it has expanded its collaboration with Arm to provide optimized IP and EDA solutions for the newest Arm® technology, including the Arm Neoverse™ V2 platform and Arm Neoverse Compute Subsystem (CSS).
In October 2022, Siemens and Microsoft announced a partnership to drive cross-industry AI adoption. As a first step, the companies are introducing Siemens Industrial Copilot, an AI-powered jointly developed assistant aimed at improving human-machine collaboration in manufacturing.
In April 2023, Siemens Digital Industries Software and IBM announced they are expanding their long-term partnership by collaborating to develop a combined software solution integrating their respective offerings for systems engineering, service lifecycle management and asset management.
In October 2022, Synopsys, Inc. and SiFive announced their new collaboration to accelerate the design and verification of SiFive RISC-V processor-based SoCs. The collaboration provides mutual customers with Synopsys Fusion QuickStart Implementation Kits (QIKs) that optimize the power, performance and area (PPA) of SiFive’s Intelligence™ X280 and Performance™ P550 processor cores.
Components Covered:
• Solution
• Service
Deployments Covered:
• On-Premise
• Cloud
Organization Sizes Covered:
• Small and Medium Enterprises
• Large Enterprises
Applications Covered:
• Optical Communication
• Data Centers
• Sensing and Measurement
• Other Applications
End Users Covered:
• Healthcare and Life Sciences
• Telecommunications
• Automotive
• Consumer Electronics
• Healthcare
• Other End Users
Regions Covered:
• North America
o US
o Canada
o Mexico
• Europe
o Germany
o UK
o Italy
o France
o Spain
o Rest of Europe
• Asia Pacific
o Japan
o China
o India
o Australia
o New Zealand
o South Korea
o Rest of Asia Pacific
• South America
o Argentina
o Brazil
o Chile
o Rest of South America
• Middle East & Africa
o Saudi Arabia
o UAE
o Qatar
o South Africa
o Rest of Middle East & Africa
What our report offers:
- Market share assessments for the regional and country-level segments
- Strategic recommendations for the new entrants
- Covers Market data for the years 2021, 2022, 2023, 2026, and 2030
- Market Trends (Drivers, Constraints, Opportunities, Threats, Challenges, Investment Opportunities, and recommendations)
- Strategic recommendations in key business segments based on the market estimations
- Competitive landscaping mapping the key common trends
- Company profiling with detailed strategies, financials, and recent developments
- Supply chain trends mapping the latest technological advancements
Free Customization Offerings:
All the customers of this report will be entitled to receive one of the following free customization options:
• Company Profiling
o Comprehensive profiling of additional market players (up to 3)
o SWOT Analysis of key players (up to 3)
• Regional Segmentation
o Market estimations, Forecasts and CAGR of any prominent country as per the client's interest (Note: Depends on feasibility check)
• Competitive Benchmarking
o Benchmarking of key players based on product portfolio, geographical presence, and strategic alliances
Table of Contents
1 Executive Summary
2 Preface
2.1 Abstract
2.2 Stake Holders
2.3 Research Scope
2.4 Research Methodology
2.4.1 Data Mining
2.4.2 Data Analysis
2.4.3 Data Validation
2.4.4 Research Approach
2.5 Research Sources
2.5.1 Primary Research Sources
2.5.2 Secondary Research Sources
2.5.3 Assumptions
3 Market Trend Analysis
3.1 Introduction
3.2 Drivers
3.3 Restraints
3.4 Opportunities
3.5 Threats
3.6 Application Analysis
3.7 End User Analysis
3.8 Emerging Markets
3.9 Impact of Covid-19
4 Porters Five Force Analysis
4.1 Bargaining power of suppliers
4.2 Bargaining power of buyers
4.3 Threat of substitutes
4.4 Threat of new entrants
4.5 Competitive rivalry
5 Global Photonic Design Automation Market, By Component
5.1 Introduction
5.2 Solution
5.3 Service
6 Global Photonic Design Automation Market, By Deployment
6.1 Introduction
6.2 On-Premise
6.3 Cloud
7 Global Photonic Design Automation Market, By Organization Size
7.1 Introduction
7.2 Small and Medium Enterprises
7.3 Large Enterprises
8 Global Photonic Design Automation Market, By Application
8.1 Introduction
8.2 Optical Communication
8.3 Data Centers
8.4 Sensing and Measurement
8.5 Other Applications
9 Global Photonic Design Automation Market, By End User
9.1 Introduction
9.2 Healthcare and Life Sciences
9.3 Telecommunications
9.4 Automotive
9.5 Consumer Electronics
9.6 Healthcare
9.7 Other End Users
10 Global Photonic Design Automation Market, By Geography
10.1 Introduction
10.2 North America
10.2.1 US
10.2.2 Canada
10.2.3 Mexico
10.3 Europe
10.3.1 Germany
10.3.2 UK
10.3.3 Italy
10.3.4 France
10.3.5 Spain
10.3.6 Rest of Europe
10.4 Asia Pacific
10.4.1 Japan
10.4.2 China
10.4.3 India
10.4.4 Australia
10.4.5 New Zealand
10.4.6 South Korea
10.4.7 Rest of Asia Pacific
10.5 South America
10.5.1 Argentina
10.5.2 Brazil
10.5.3 Chile
10.5.4 Rest of South America
10.6 Middle East & Africa
10.6.1 Saudi Arabia
10.6.2 UAE
10.6.3 Qatar
10.6.4 South Africa
10.6.5 Rest of Middle East & Africa
11 Key Developments
11.1 Agreements, Partnerships, Collaborations and Joint Ventures
11.2 Acquisitions & Mergers
11.3 New Product Launch
11.4 Expansions
11.5 Other Key Strategies
12 Company Profiling
12.1 Siemens AG
12.2 Ansys Inc
12.3 VPlphotonics GmbH
12.4 Luceda Photonics
12.5 LioniX International BV
12.6 Optiwave Systems Inc
12.7 Cadence Design Systems Inc
12.8 Synopsys Inc
12.9 AIM Photonics Inc
12.10 SystemLab Inc
List of Tables
1 Global Photonic Design Automation Market Outlook, By Region (2021-2030) ($MN)
2 Global Photonic Design Automation Market Outlook, By Component (2021-2030) ($MN)
3 Global Photonic Design Automation Market Outlook, By Solution (2021-2030) ($MN)
4 Global Photonic Design Automation Market Outlook, By Service (2021-2030) ($MN)
5 Global Photonic Design Automation Market Outlook, By Deployment (2021-2030) ($MN)
6 Global Photonic Design Automation Market Outlook, By On-Premise (2021-2030) ($MN)
7 Global Photonic Design Automation Market Outlook, By Cloud (2021-2030) ($MN)
8 Global Photonic Design Automation Market Outlook, By Organization Size (2021-2030) ($MN)
9 Global Photonic Design Automation Market Outlook, By Small and Medium Enterprises (2021-2030) ($MN)
10 Global Photonic Design Automation Market Outlook, By Large Enterprises (2021-2030) ($MN)
11 Global Photonic Design Automation Market Outlook, By Application (2021-2030) ($MN)
12 Global Photonic Design Automation Market Outlook, By Optical Communication (2021-2030) ($MN)
13 Global Photonic Design Automation Market Outlook, By Data Centers (2021-2030) ($MN)
14 Global Photonic Design Automation Market Outlook, By Sensing and Measurement (2021-2030) ($MN)
15 Global Photonic Design Automation Market Outlook, By Other Applications (2021-2030) ($MN)
16 Global Photonic Design Automation Market Outlook, By End User (2021-2030) ($MN)
17 Global Photonic Design Automation Market Outlook, By Healthcare and Life Sciences (2021-2030) ($MN)
18 Global Photonic Design Automation Market Outlook, By Telecommunications (2021-2030) ($MN)
19 Global Photonic Design Automation Market Outlook, By Automotive (2021-2030) ($MN)
20 Global Photonic Design Automation Market Outlook, By Consumer Electronics (2021-2030) ($MN)
21 Global Photonic Design Automation Market Outlook, By Healthcare (2021-2030) ($MN)
22 Global Photonic Design Automation Market Outlook, By Other End Users (2021-2030) ($MN)
23 North America Photonic Design Automation Market Outlook, By Country (2021-2030) ($MN)
24 North America Photonic Design Automation Market Outlook, By Component (2021-2030) ($MN)
25 North America Photonic Design Automation Market Outlook, By Solution (2021-2030) ($MN)
26 North America Photonic Design Automation Market Outlook, By Service (2021-2030) ($MN)
27 North America Photonic Design Automation Market Outlook, By Deployment (2021-2030) ($MN)
28 North America Photonic Design Automation Market Outlook, By On-Premise (2021-2030) ($MN)
29 North America Photonic Design Automation Market Outlook, By Cloud (2021-2030) ($MN)
30 North America Photonic Design Automation Market Outlook, By Organization Size (2021-2030) ($MN)
31 North America Photonic Design Automation Market Outlook, By Small and Medium Enterprises (2021-2030) ($MN)
32 North America Photonic Design Automation Market Outlook, By Large Enterprises (2021-2030) ($MN)
33 North America Photonic Design Automation Market Outlook, By Application (2021-2030) ($MN)
34 North America Photonic Design Automation Market Outlook, By Optical Communication (2021-2030) ($MN)
35 North America Photonic Design Automation Market Outlook, By Data Centers (2021-2030) ($MN)
36 North America Photonic Design Automation Market Outlook, By Sensing and Measurement (2021-2030) ($MN)
37 North America Photonic Design Automation Market Outlook, By Other Applications (2021-2030) ($MN)
38 North America Photonic Design Automation Market Outlook, By End User (2021-2030) ($MN)
39 North America Photonic Design Automation Market Outlook, By Healthcare and Life Sciences (2021-2030) ($MN)
40 North America Photonic Design Automation Market Outlook, By Telecommunications (2021-2030) ($MN)
41 North America Photonic Design Automation Market Outlook, By Automotive (2021-2030) ($MN)
42 North America Photonic Design Automation Market Outlook, By Consumer Electronics (2021-2030) ($MN)
43 North America Photonic Design Automation Market Outlook, By Healthcare (2021-2030) ($MN)
44 North America Photonic Design Automation Market Outlook, By Other End Users (2021-2030) ($MN)
45 Europe Photonic Design Automation Market Outlook, By Country (2021-2030) ($MN)
46 Europe Photonic Design Automation Market Outlook, By Component (2021-2030) ($MN)
47 Europe Photonic Design Automation Market Outlook, By Solution (2021-2030) ($MN)
48 Europe Photonic Design Automation Market Outlook, By Service (2021-2030) ($MN)
49 Europe Photonic Design Automation Market Outlook, By Deployment (2021-2030) ($MN)
50 Europe Photonic Design Automation Market Outlook, By On-Premise (2021-2030) ($MN)
51 Europe Photonic Design Automation Market Outlook, By Cloud (2021-2030) ($MN)
52 Europe Photonic Design Automation Market Outlook, By Organization Size (2021-2030) ($MN)
53 Europe Photonic Design Automation Market Outlook, By Small and Medium Enterprises (2021-2030) ($MN)
54 Europe Photonic Design Automation Market Outlook, By Large Enterprises (2021-2030) ($MN)
55 Europe Photonic Design Automation Market Outlook, By Application (2021-2030) ($MN)
56 Europe Photonic Design Automation Market Outlook, By Optical Communication (2021-2030) ($MN)
57 Europe Photonic Design Automation Market Outlook, By Data Centers (2021-2030) ($MN)
58 Europe Photonic Design Automation Market Outlook, By Sensing and Measurement (2021-2030) ($MN)
59 Europe Photonic Design Automation Market Outlook, By Other Applications (2021-2030) ($MN)
60 Europe Photonic Design Automation Market Outlook, By End User (2021-2030) ($MN)
61 Europe Photonic Design Automation Market Outlook, By Healthcare and Life Sciences (2021-2030) ($MN)
62 Europe Photonic Design Automation Market Outlook, By Telecommunications (2021-2030) ($MN)
63 Europe Photonic Design Automation Market Outlook, By Automotive (2021-2030) ($MN)
64 Europe Photonic Design Automation Market Outlook, By Consumer Electronics (2021-2030) ($MN)
65 Europe Photonic Design Automation Market Outlook, By Healthcare (2021-2030) ($MN)
66 Europe Photonic Design Automation Market Outlook, By Other End Users (2021-2030) ($MN)
67 Asia Pacific Photonic Design Automation Market Outlook, By Country (2021-2030) ($MN)
68 Asia Pacific Photonic Design Automation Market Outlook, By Component (2021-2030) ($MN)
69 Asia Pacific Photonic Design Automation Market Outlook, By Solution (2021-2030) ($MN)
70 Asia Pacific Photonic Design Automation Market Outlook, By Service (2021-2030) ($MN)
71 Asia Pacific Photonic Design Automation Market Outlook, By Deployment (2021-2030) ($MN)
72 Asia Pacific Photonic Design Automation Market Outlook, By On-Premise (2021-2030) ($MN)
73 Asia Pacific Photonic Design Automation Market Outlook, By Cloud (2021-2030) ($MN)
74 Asia Pacific Photonic Design Automation Market Outlook, By Organization Size (2021-2030) ($MN)
75 Asia Pacific Photonic Design Automation Market Outlook, By Small and Medium Enterprises (2021-2030) ($MN)
76 Asia Pacific Photonic Design Automation Market Outlook, By Large Enterprises (2021-2030) ($MN)
77 Asia Pacific Photonic Design Automation Market Outlook, By Application (2021-2030) ($MN)
78 Asia Pacific Photonic Design Automation Market Outlook, By Optical Communication (2021-2030) ($MN)
79 Asia Pacific Photonic Design Automation Market Outlook, By Data Centers (2021-2030) ($MN)
80 Asia Pacific Photonic Design Automation Market Outlook, By Sensing and Measurement (2021-2030) ($MN)
81 Asia Pacific Photonic Design Automation Market Outlook, By Other Applications (2021-2030) ($MN)
82 Asia Pacific Photonic Design Automation Market Outlook, By End User (2021-2030) ($MN)
83 Asia Pacific Photonic Design Automation Market Outlook, By Healthcare and Life Sciences (2021-2030) ($MN)
84 Asia Pacific Photonic Design Automation Market Outlook, By Telecommunications (2021-2030) ($MN)
85 Asia Pacific Photonic Design Automation Market Outlook, By Automotive (2021-2030) ($MN)
86 Asia Pacific Photonic Design Automation Market Outlook, By Consumer Electronics (2021-2030) ($MN)
87 Asia Pacific Photonic Design Automation Market Outlook, By Healthcare (2021-2030) ($MN)
88 Asia Pacific Photonic Design Automation Market Outlook, By Other End Users (2021-2030) ($MN)
89 South America Photonic Design Automation Market Outlook, By Country (2021-2030) ($MN)
90 South America Photonic Design Automation Market Outlook, By Component (2021-2030) ($MN)
91 South America Photonic Design Automation Market Outlook, By Solution (2021-2030) ($MN)
92 South America Photonic Design Automation Market Outlook, By Service (2021-2030) ($MN)
93 South America Photonic Design Automation Market Outlook, By Deployment (2021-2030) ($MN)
94 South America Photonic Design Automation Market Outlook, By On-Premise (2021-2030) ($MN)
95 South America Photonic Design Automation Market Outlook, By Cloud (2021-2030) ($MN)
96 South America Photonic Design Automation Market Outlook, By Organization Size (2021-2030) ($MN)
97 South America Photonic Design Automation Market Outlook, By Small and Medium Enterprises (2021-2030) ($MN)
98 South America Photonic Design Automation Market Outlook, By Large Enterprises (2021-2030) ($MN)
99 South America Photonic Design Automation Market Outlook, By Application (2021-2030) ($MN)
100 South America Photonic Design Automation Market Outlook, By Optical Communication (2021-2030) ($MN)
101 South America Photonic Design Automation Market Outlook, By Data Centers (2021-2030) ($MN)
102 South America Photonic Design Automation Market Outlook, By Sensing and Measurement (2021-2030) ($MN)
103 South America Photonic Design Automation Market Outlook, By Other Applications (2021-2030) ($MN)
104 South America Photonic Design Automation Market Outlook, By End User (2021-2030) ($MN)
105 South America Photonic Design Automation Market Outlook, By Healthcare and Life Sciences (2021-2030) ($MN)
106 South America Photonic Design Automation Market Outlook, By Telecommunications (2021-2030) ($MN)
107 South America Photonic Design Automation Market Outlook, By Automotive (2021-2030) ($MN)
108 South America Photonic Design Automation Market Outlook, By Consumer Electronics (2021-2030) ($MN)
109 South America Photonic Design Automation Market Outlook, By Healthcare (2021-2030) ($MN)
110 South America Photonic Design Automation Market Outlook, By Other End Users (2021-2030) ($MN)
111 Middle East & Africa Photonic Design Automation Market Outlook, By Country (2021-2030) ($MN)
112 Middle East & Africa Photonic Design Automation Market Outlook, By Component (2021-2030) ($MN)
113 Middle East & Africa Photonic Design Automation Market Outlook, By Solution (2021-2030) ($MN)
114 Middle East & Africa Photonic Design Automation Market Outlook, By Service (2021-2030) ($MN)
115 Middle East & Africa Photonic Design Automation Market Outlook, By Deployment (2021-2030) ($MN)
116 Middle East & Africa Photonic Design Automation Market Outlook, By On-Premise (2021-2030) ($MN)
117 Middle East & Africa Photonic Design Automation Market Outlook, By Cloud (2021-2030) ($MN)
118 Middle East & Africa Photonic Design Automation Market Outlook, By Organization Size (2021-2030) ($MN)
119 Middle East & Africa Photonic Design Automation Market Outlook, By Small and Medium Enterprises (2021-2030) ($MN)
120 Middle East & Africa Photonic Design Automation Market Outlook, By Large Enterprises (2021-2030) ($MN)
121 Middle East & Africa Photonic Design Automation Market Outlook, By Application (2021-2030) ($MN)
122 Middle East & Africa Photonic Design Automation Market Outlook, By Optical Communication (2021-2030) ($MN)
123 Middle East & Africa Photonic Design Automation Market Outlook, By Data Centers (2021-2030) ($MN)
124 Middle East & Africa Photonic Design Automation Market Outlook, By Sensing and Measurement (2021-2030) ($MN)
125 Middle East & Africa Photonic Design Automation Market Outlook, By Other Applications (2021-2030) ($MN)
126 Middle East & Africa Photonic Design Automation Market Outlook, By End User (2021-2030) ($MN)
127 Middle East & Africa Photonic Design Automation Market Outlook, By Healthcare and Life Sciences (2021-2030) ($MN)
128 Middle East & Africa Photonic Design Automation Market Outlook, By Telecommunications (2021-2030) ($MN)
129 Middle East & Africa Photonic Design Automation Market Outlook, By Automotive (2021-2030) ($MN)
130 Middle East & Africa Photonic Design Automation Market Outlook, By Consumer Electronics (2021-2030) ($MN)
131 Middle East & Africa Photonic Design Automation Market Outlook, By Healthcare (2021-2030) ($MN)
132 Middle East & Africa Photonic Design Automation Market Outlook, By Other End Users (2021-2030) ($MN)
List of Figures
RESEARCH METHODOLOGY

We at ‘Stratistics’ opt for an extensive research approach which involves data mining, data validation, and data analysis. The various research sources include in-house repository, secondary research, competitor’s sources, social media research, client internal data, and primary research.
Our team of analysts prefers the most reliable and authenticated data sources in order to perform the comprehensive literature search. With access to most of the authenticated data bases our team highly considers the best mix of information through various sources to obtain extensive and accurate analysis.
Each report takes an average time of a month and a team of 4 industry analysts. The time may vary depending on the scope and data availability of the desired market report. The various parameters used in the market assessment are standardized in order to enhance the data accuracy.
Data Mining
The data is collected from several authenticated, reliable, paid and unpaid sources and is filtered depending on the scope & objective of the research. Our reports repository acts as an added advantage in this procedure. Data gathering from the raw material suppliers, distributors and the manufacturers is performed on a regular basis, this helps in the comprehensive understanding of the products value chain. Apart from the above mentioned sources the data is also collected from the industry consultants to ensure the objective of the study is in the right direction.
Market trends such as technological advancements, regulatory affairs, market dynamics (Drivers, Restraints, Opportunities and Challenges) are obtained from scientific journals, market related national & international associations and organizations.
Data Analysis
From the data that is collected depending on the scope & objective of the research the data is subjected for the analysis. The critical steps that we follow for the data analysis include:
- Product Lifecycle Analysis
- Competitor analysis
- Risk analysis
- Porters Analysis
- PESTEL Analysis
- SWOT Analysis
The data engineering is performed by the core industry experts considering both the Marketing Mix Modeling and the Demand Forecasting. The marketing mix modeling makes use of multiple-regression techniques to predict the optimal mix of marketing variables. Regression factor is based on a number of variables and how they relate to an outcome such as sales or profits.
Data Validation
The data validation is performed by the exhaustive primary research from the expert interviews. This includes telephonic interviews, focus groups, face to face interviews, and questionnaires to validate our research from all aspects. The industry experts we approach come from the leading firms, involved in the supply chain ranging from the suppliers, distributors to the manufacturers and consumers so as to ensure an unbiased analysis.
We are in touch with more than 15,000 industry experts with the right mix of consultants, CEO's, presidents, vice presidents, managers, experts from both supply side and demand side, executives and so on.
The data validation involves the primary research from the industry experts belonging to:
- Leading Companies
- Suppliers & Distributors
- Manufacturers
- Consumers
- Industry/Strategic Consultants
Apart from the data validation the primary research also helps in performing the fill gap research, i.e. providing solutions for the unmet needs of the research which helps in enhancing the reports quality.
For more details about research methodology, kindly write to us at info@strategymrc.com
Frequently Asked Questions
In case of any queries regarding this report, you can contact the customer service by filing the “Inquiry Before Buy” form available on the right hand side. You may also contact us through email: info@strategymrc.com or phone: +1-301-202-5929
Yes, the samples are available for all the published reports. You can request them by filling the “Request Sample” option available in this page.
Yes, you can request a sample with your specific requirements. All the customized samples will be provided as per the requirement with the real data masked.
All our reports are available in Digital PDF format. In case if you require them in any other formats, such as PPT, Excel etc you can submit a request through “Inquiry Before Buy” form available on the right hand side. You may also contact us through email: info@strategymrc.com or phone: +1-301-202-5929
We offer a free 15% customization with every purchase. This requirement can be fulfilled for both pre and post sale. You may send your customization requirements through email at info@strategymrc.com or call us on +1-301-202-5929.
We have 3 different licensing options available in electronic format.
- Single User Licence: Allows one person, typically the buyer, to have access to the ordered product. The ordered product cannot be distributed to anyone else.
- 2-5 User Licence: Allows the ordered product to be shared among a maximum of 5 people within your organisation.
- Corporate License: Allows the product to be shared among all employees of your organisation regardless of their geographical location.
All our reports are typically be emailed to you as an attachment.
To order any available report you need to register on our website. The payment can be made either through CCAvenue or PayPal payments gateways which accept all international cards.
We extend our support to 6 months post sale. A post sale customization is also provided to cover your unmet needs in the report.
Request Customization
We offer complimentary customization of up to 15% with every purchase. To share your customization requirements, feel free to email us at info@strategymrc.com or call us on +1-301-202-5929. .
Please Note: Customization within the 15% threshold is entirely free of charge. If your request exceeds this limit, we will conduct a feasibility assessment. Following that, a detailed quote and timeline will be provided.
WHY CHOOSE US ?

Assured Quality
Best in class reports with high standard of research integrity

24X7 Research Support
Continuous support to ensure the best customer experience.

Free Customization
Adding more values to your product of interest.

Safe & Secure Access
Providing a secured environment for all online transactions.

Trusted by 600+ Brands
Serving the most reputed brands across the world.