
Plastic Tubs And Lids Market
Plastic Tubs and Lids Market Forecasts to 2028 - Global Analysis By Capacity (500 ml, 1 L (Litre)), Material Type (Polyethylene (PE), Polypropylene (PP)), Application (Food, Home and Hygiene) and By Geography

|
Years Covered |
2020-2028 |
|
Estimated Year Value (2022) |
US $1015.08 BN |
|
Projected Year Value (2028) |
US $1,540.52 BN |
|
CAGR (2022 - 2028) |
7.2% |
|
Regions Covered |
North America, Europe, Asia Pacific, South America, and Middle East & Africa |
|
Countries Covered |
US, Canada, Mexico, Germany, UK, Italy, France, Spain, Japan, China, India, Australia, New Zealand, South Korea, Rest of Asia Pacific, South America, Argentina, Brazil, Chile, Middle East & Africa, Saudi Arabia, UAE, Qatar, and South Africa |
|
Largest Market |
North America |
|
Highest Growing Market |
Asia Pacific |
According to Stratistics MRC, the Global Plastic Tubs and Lids Market is accounted for $1015.08 million in 2022 and is expected to reach $1,540.52 million by 2028 growing at a CAGR of 7.2% during the forecast period. Plastic tubs and lids are seamless for maintaining optimum quality of ready-to-eat products such as ice cream, salsa, yogurt, dip, cheese, etc. Due to easy customization, plastic tubs and lids are available in various shapes and sizes. Unlike cardboard boxes, plastic canisters don't get damaged with water or heat.
EPA estimated 14.5 million tons of plastic containers and packaging were generated in 2018, approximately 5.0 percent of MSW generation. (Plastic packaging as a category in this analysis does not include single-service plates and cups, and trash bags, both of which are classified as nondurable goods). EPA also estimated the recycling of plastic products based on data published annually by the American Chemistry Council, as well as additional industry data. The recycling rate of PET bottles and jars was 29.1 percent in 2018 (910,000 tons). It is estimated that recycling of HDPE natural bottles (e.g., milk and water bottles) was 220,000 tons, or 29.3 percent of generation. Overall, the amount of recycled plastic containers and packaging in 2018 was almost 2 million tons or 13.6 percent of plastic containers and packaging generated. Additionally, 16.9 percent of the plastic containers and packaging waste generated was combusted with energy recovery, while the remainder (over 69 percent) was landfilled.
Market Dynamics:
Driver:
Numerous benefits of plastic tubs and lids
The demand for plastic tubs and lids is surging due to their hygiene, lightweight, and convenient nature, which is expected to positively impact the growth of the plastic tubs and lids market. Owing to the features such as printable surface for branding, comfortable surface, leak resistance snap-fit applications, and ease in removing, the plastic tubs and lids market is expected to drive the market during the forecast period.
Restraint:
Increasing concerns over the environment
Due to the usage of plastic there are increasing concerns over the environment and regulations regarding the use of plastic due to which several companies to explore substitutes to attain sustainability in their business operations. This is increasing the use of biopolymers for several packaging applications such as overwraps, lid, frozen food packaging.
Opportunity:
Adoption of new manufacturing techniques
With advancements in technology and general awareness, key players operating in the plastic tubs and lids are strategically planning the integration of new manufacturing techniques and process improvements. Driven by increasing raw material prices and energy costs, various new techniques such as co-extrusion have made their way toward mainstream production of plastic tubs and lids. The use of these new techniques has led to increased heat resistance, improved barrier traits, and other performance enhancements in the plastic tubs and lids. In addition to manufacturing techniques, various new packaging technologies are also being adopted by the industry players. For instance, the new multi-layer packaging technology developed by Milacron delivers high barrier properties with the same cycle times and high-volume production efficiencies as single layer containers without barrier traits.
Threat:
Heavy usage of plastic
Plastic is everywhere. It's in bowls, wraps, and a host of bottles and bags used to store foods and beverages. The certain chemicals in plastic can leach out of the plastic and into the food and beverages that consumers eat. Some of these chemicals have been linked to health problems such as metabolic disorders (including obesity) and reduced fertility. This leaching can occur even faster and to a greater degree when plastic is exposed to heat. This means, it might be getting an even higher dose of potentially harmful chemicals simply by microwaving leftovers in a plastic container which may possess as a threat for usage of plastic lids & tubes.
The 500 ml segment is expected to be the largest during the forecast period
Rectangular 500 ml containers are widely used for food packaging and food delivery to online customers. They are used to pack any types of hot and cold food like vegetable salad, biriyani, omelette, noodles and more. They are mostly useful for extra-wide space, stylish look and more durability for packing and delivering foods. They can survive extreme environments and don't easily degrade in hot and cold temperatures, thus preserving the integrity of the food or beverage inside it. It also protects your products from moisture, oxygen, dust, light and odours.
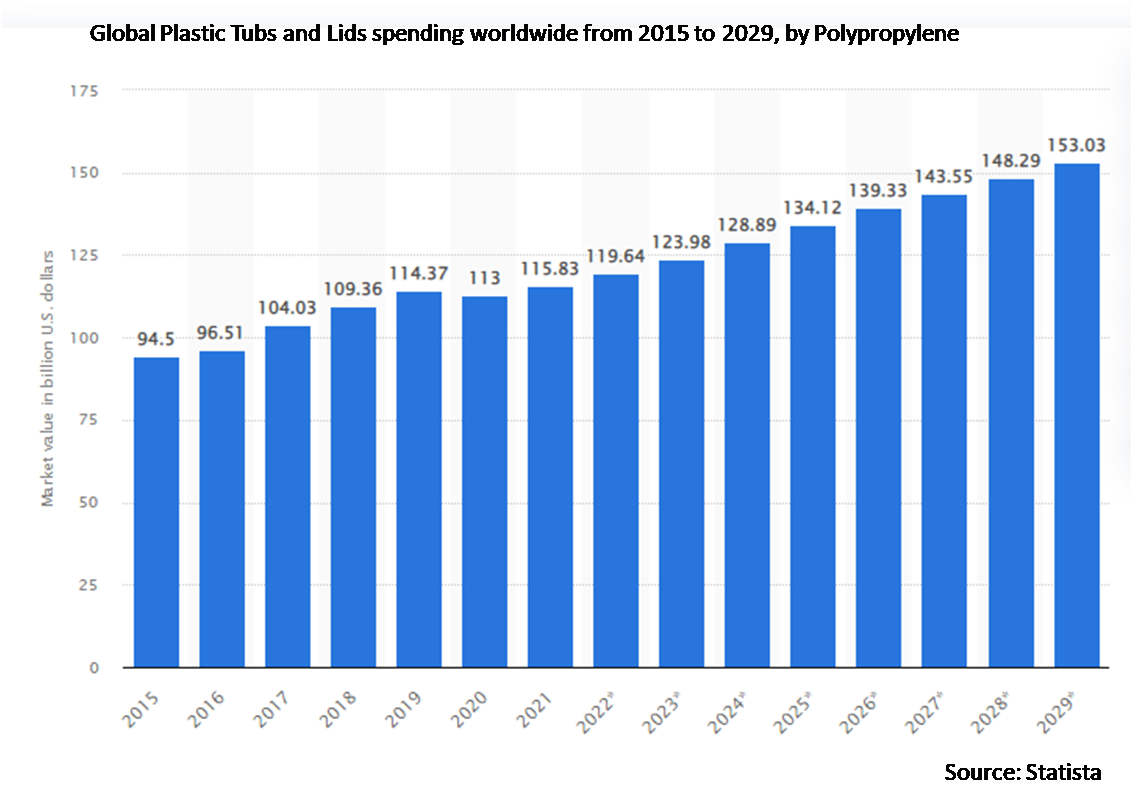
The polypropylene (PP) segment is expected to have the highest CAGR during the forecast period
Polypropylene is an ideal food-safe plastic for production processes that require high heat. It can be found in products ranging from prescription bottles to garden tools and automotive products. While fairly stiff, polypropylene is not as brittle as other common food packaging plastics. Food items that utilize polypropylene for packaging include yogurt, cream cheese/sour cream containers, ready-to-eat meals and VSP containers. Polypropylene has gained popularity for microwavable containers thanks to its high melting point.
Region with largest share:
North America is projected to hold the largest market share owing to consumers shift towards less harmful plastic. Shift in consumer preference for recycled plastic ice cream tubs is creating new sales opportunities in the plastic tubs and lids market in the region. Product manufacturers are collaborating for the manufacture of recycled plastic tubs that are suitable for food and can stand freezing temperatures.
Region with highest CAGR:
Asia Pacific is projected to have the highest CAGR due to the shift in consumer preference for tubs due to cost-saving, value pack, and availability in family pack sizes is leading manufacturers to manufacture plastic tubs in various shapes and sizes. Companies in the Asia Pacific plastic tubs and lids market are making use of low quality mixed plastic waste to develop food grade recycled plastic ice cream tubs. These recycled solutions also have to meet the same technical and safety standards that are applicable for traditional food packaging.

Key players in the market:
Some of the key players profiled in the Plastic Tubs and Lids Market include Sonoco Products Company, Huhtamäki Oyj, Greiner Packaging, Berry Global Company, Pact Group Holdings Ltd., Amcor plc., StanPac Inc., Parkers Packaging, Shalam packaging and InterPak Ltd.
Key developments:
In April 2021: Alpha Packaging, a leading manufacturer and decorator of high-quality plastic bottles and jars, acquired Boxmore Plastics Limited. The acquisition of Boxmore supports Alpha’s strategy of geographic expansion and strengthens the presence of the company in the European market.
In May 2021: Plastipak has announced a major investment in recycling at a manufacturing site in Spain. The new recycling facility will convert PET flake into food-grade recycled PET (rPET) pellets suitable for direct use in new preforms, bottles, and containers.
In July 2019: GM Packaging launched a new product “Love Bio”, a new compostable range of ice cream tubs made from PLA lined coated food grade paper. These ice cream tubs offer the eco-friendly solution in their bio brand packaging.
Capacities Covered:
• 500 ml
• 1 L (Litre)
Material Types Covered:
• Polyethylene (PE)
• Polypropylene (PP)
Applications Covered:
• Food
• Home and Hygiene (Detergent Pods)
Regions Covered:
• North America
o US
o Canada
o Mexico
• Europe
o Germany
o UK
o Italy
o France
o Spain
o Rest of Europe
• Asia Pacific
o Japan
o China
o India
o Australia
o New Zealand
o South Korea
o Rest of Asia Pacific
• South America
o Argentina
o Brazil
o Chile
o Rest of South America
• Middle East & Africa
o Saudi Arabia
o UAE
o Qatar
o South Africa
o Rest of Middle East & Africa
What our report offers:
- Market share assessments for the regional and country-level segments
- Strategic recommendations for the new entrants
- Covers Market data for the years 2020, 2021, 2022, 2025 and 2028
- Market Trends (Drivers, Constraints, Opportunities, Threats, Challenges, Investment Opportunities, and recommendations)
- Strategic recommendations in key business segments based on the market estimations
- Competitive landscaping mapping the key common trends
- Company profiling with detailed strategies, financials, and recent developments
- Supply chain trends mapping the latest technological advancements
Free Customization Offerings:
All the customers of this report will be entitled to receive one of the following free customization options:
• Company Profiling
o Comprehensive profiling of additional market players (up to 3)
o SWOT Analysis of key players (up to 3)
• Regional Segmentation
o Market estimations, Forecasts and CAGR of any prominent country as per the client's interest (Note: Depends on feasibility check)
• Competitive Benchmarking
o Benchmarking of key players based on product portfolio, geographical presence, and strategic alliances
Table of Contents
1 Executive Summary
2 Preface
2.1 Abstract
2.2 Stake Holders
2.3 Research Scope
2.4 Research Methodology
2.4.1 Data Mining
2.4.2 Data Analysis
2.4.3 Data Validation
2.4.4 Research Approach
2.5 Research Sources
2.5.1 Primary Research Sources
2.5.2 Secondary Research Sources
2.5.3 Assumptions
3 Market Trend Analysis
3.1 Introduction
3.2 Drivers
3.3 Restraints
3.4 Opportunities
3.5 Threats
3.6 Application Analysis
3.7 Emerging Markets
3.8 Impact of Covid-19
4 Porters Five Force Analysis
4.1 Bargaining power of suppliers
4.2 Bargaining power of buyers
4.3 Threat of substitutes
4.4 Threat of new entrants
4.5 Competitive rivalry
5 Global Plastic Tubs and Lids Market, By Capacity
5.1 Introduction
5.2 500 ml
5.3 1 L (Litre)
6 Global Plastic Tubs and Lids Market, By Material
6.1 Introduction
6.2 Polyethylene (PE)
6.2.1 High Density Polyethylene (HDPE)
6.2.2 Low Density Polyethylene (LDPE)
6.3 Polypropylene (PP)
7 Global Plastic Tubs and Lids Market, By Application
7.1 Introduction
7.2 Food
7.2.1 Ready to Eat (RTE) Products
7.2.2 Ice Cream
7.2.3 Frozen Food
7.3 Home and Hygiene (Detergent Pods)
8 Global Plastic Tubs and Lids Market, By Geography
8.1 Introduction
8.2 North America
8.2.1 US
8.2.2 Canada
8.2.3 Mexico
8.3 Europe
8.3.1 Germany
8.3.2 UK
8.3.3 Italy
8.3.4 France
8.3.5 Spain
8.3.6 Rest of Europe
8.4 Asia Pacific
8.4.1 Japan
8.4.2 China
8.4.3 India
8.4.4 Australia
8.4.5 New Zealand
8.4.6 South Korea
8.4.7 Rest of Asia Pacific
8.5 South America
8.5.1 Argentina
8.5.2 Brazil
8.5.3 Chile
8.5.4 Rest of South America
8.6 Middle East & Africa
8.6.1 Saudi Arabia
8.6.2 UAE
8.6.3 Qatar
8.6.4 South Africa
8.6.5 Rest of Middle East & Africa
9 Key Developments
9.1 Agreements, Partnerships, Collaborations and Joint Ventures
9.2 Acquisitions & Mergers
9.3 New Product Launch
9.4 Expansions
9.5 Other Key Strategies
10 Company Profiling
10.1 Sonoco Products Company
10.2 Huhtamäki Oyj
10.3 Greiner Packaging
10.4 Berry Global Company
10.5 Pact Group Holdings Ltd.
10.6 Amcor plc.
10.7 StanPac Inc.
10.8 Parkers Packaging
10.9 Shalam packaging
10.10 InterPak Ltd.
List of Tables
1 Global Plastic Tubs and Lids Market Outlook, By Region (2020-2028) ($MN)
2 Global Plastic Tubs and Lids Market Outlook, By Capacity (2020-2028) ($MN)
3 Global Plastic Tubs and Lids Market Outlook, By 500 ml (2020-2028) ($MN)
4 Global Plastic Tubs and Lids Market Outlook, By 1 L (Litre) (2020-2028) ($MN)
5 Global Plastic Tubs and Lids Market Outlook, By Material Type (2020-2028) ($MN)
6 Global Plastic Tubs and Lids Market Outlook, By Polyethylene (PE) (2020-2028) ($MN)
7 Global Plastic Tubs and Lids Market Outlook, By High Density Polyethylene (HDPE) (2020-2028) ($MN)
8 Global Plastic Tubs and Lids Market Outlook, By Low Density Polyethylene (LDPE) (2020-2028) ($MN)
9 Global Plastic Tubs and Lids Market Outlook, By Polypropylene (PP) (2020-2028) ($MN)
10 Global Plastic Tubs and Lids Market Outlook, By Application (2020-2028) ($MN)
11 Global Plastic Tubs and Lids Market Outlook, By Food (2020-2028) ($MN)
12 Global Plastic Tubs and Lids Market Outlook, By Ready to Eat (RTE) Products (2020-2028) ($MN)
13 Global Plastic Tubs and Lids Market Outlook, By Ice Cream (2020-2028) ($MN)
14 Global Plastic Tubs and Lids Market Outlook, By Frozen Food (2020-2028) ($MN)
15 Global Plastic Tubs and Lids Market Outlook, By Home and Hygiene (Detergent Pods) (2020-2028) ($MN)
16 North America Plastic Tubs and Lids Market Outlook, By Country (2020-2028) ($MN)
17 North America Plastic Tubs and Lids Market Outlook, By Capacity (2020-2028) ($MN)
18 North America Plastic Tubs and Lids Market Outlook, By 500 ml (2020-2028) ($MN)
19 North America Plastic Tubs and Lids Market Outlook, By 1 L (Litre) (2020-2028) ($MN)
20 North America Plastic Tubs and Lids Market Outlook, By Material Type (2020-2028) ($MN)
21 North America Plastic Tubs and Lids Market Outlook, By Polyethylene (PE) (2020-2028) ($MN)
22 North America Plastic Tubs and Lids Market Outlook, By High Density Polyethylene (HDPE) (2020-2028) ($MN)
23 North America Plastic Tubs and Lids Market Outlook, By Low Density Polyethylene (LDPE) (2020-2028) ($MN)
24 North America Plastic Tubs and Lids Market Outlook, By Polypropylene (PP) (2020-2028) ($MN)
25 North America Plastic Tubs and Lids Market Outlook, By Application (2020-2028) ($MN)
26 North America Plastic Tubs and Lids Market Outlook, By Food (2020-2028) ($MN)
27 North America Plastic Tubs and Lids Market Outlook, By Ready to Eat (RTE) Products (2020-2028) ($MN)
28 North America Plastic Tubs and Lids Market Outlook, By Ice Cream (2020-2028) ($MN)
29 North America Plastic Tubs and Lids Market Outlook, By Frozen Food (2020-2028) ($MN)
30 North America Plastic Tubs and Lids Market Outlook, By Home and Hygiene (Detergent Pods) (2020-2028) ($MN)
31 Europe Plastic Tubs and Lids Market Outlook, By Country (2020-2028) ($MN)
32 Europe Plastic Tubs and Lids Market Outlook, By Capacity (2020-2028) ($MN)
33 Europe Plastic Tubs and Lids Market Outlook, By 500 ml (2020-2028) ($MN)
34 Europe Plastic Tubs and Lids Market Outlook, By 1 L (Litre) (2020-2028) ($MN)
35 Europe Plastic Tubs and Lids Market Outlook, By Material Type (2020-2028) ($MN)
36 Europe Plastic Tubs and Lids Market Outlook, By Polyethylene (PE) (2020-2028) ($MN)
37 Europe Plastic Tubs and Lids Market Outlook, By High Density Polyethylene (HDPE) (2020-2028) ($MN)
38 Europe Plastic Tubs and Lids Market Outlook, By Low Density Polyethylene (LDPE) (2020-2028) ($MN)
39 Europe Plastic Tubs and Lids Market Outlook, By Polypropylene (PP) (2020-2028) ($MN)
40 Europe Plastic Tubs and Lids Market Outlook, By Application (2020-2028) ($MN)
41 Europe Plastic Tubs and Lids Market Outlook, By Food (2020-2028) ($MN)
42 Europe Plastic Tubs and Lids Market Outlook, By Ready to Eat (RTE) Products (2020-2028) ($MN)
43 Europe Plastic Tubs and Lids Market Outlook, By Ice Cream (2020-2028) ($MN)
44 Europe Plastic Tubs and Lids Market Outlook, By Frozen Food (2020-2028) ($MN)
45 Europe Plastic Tubs and Lids Market Outlook, By Home and Hygiene (Detergent Pods) (2020-2028) ($MN)
46 Asia Pacific Plastic Tubs and Lids Market Outlook, By Country (2020-2028) ($MN)
47 Asia Pacific Plastic Tubs and Lids Market Outlook, By Capacity (2020-2028) ($MN)
48 Asia Pacific Plastic Tubs and Lids Market Outlook, By 500 ml (2020-2028) ($MN)
49 Asia Pacific Plastic Tubs and Lids Market Outlook, By 1 L (Litre) (2020-2028) ($MN)
50 Asia Pacific Plastic Tubs and Lids Market Outlook, By Material Type (2020-2028) ($MN)
51 Asia Pacific Plastic Tubs and Lids Market Outlook, By Polyethylene (PE) (2020-2028) ($MN)
52 Asia Pacific Plastic Tubs and Lids Market Outlook, By High Density Polyethylene (HDPE) (2020-2028) ($MN)
53 Asia Pacific Plastic Tubs and Lids Market Outlook, By Low Density Polyethylene (LDPE) (2020-2028) ($MN)
54 Asia Pacific Plastic Tubs and Lids Market Outlook, By Polypropylene (PP) (2020-2028) ($MN)
55 Asia Pacific Plastic Tubs and Lids Market Outlook, By Application (2020-2028) ($MN)
56 Asia Pacific Plastic Tubs and Lids Market Outlook, By Food (2020-2028) ($MN)
57 Asia Pacific Plastic Tubs and Lids Market Outlook, By Ready to Eat (RTE) Products (2020-2028) ($MN)
58 Asia Pacific Plastic Tubs and Lids Market Outlook, By Ice Cream (2020-2028) ($MN)
59 Asia Pacific Plastic Tubs and Lids Market Outlook, By Frozen Food (2020-2028) ($MN)
60 Asia Pacific Plastic Tubs and Lids Market Outlook, By Home and Hygiene (Detergent Pods) (2020-2028) ($MN)
61 South America Plastic Tubs and Lids Market Outlook, By Country (2020-2028) ($MN)
62 South America Plastic Tubs and Lids Market Outlook, By Capacity (2020-2028) ($MN)
63 South America Plastic Tubs and Lids Market Outlook, By 500 ml (2020-2028) ($MN)
64 South America Plastic Tubs and Lids Market Outlook, By 1 L (Litre) (2020-2028) ($MN)
65 South America Plastic Tubs and Lids Market Outlook, By Material Type (2020-2028) ($MN)
66 South America Plastic Tubs and Lids Market Outlook, By Polyethylene (PE) (2020-2028) ($MN)
67 South America Plastic Tubs and Lids Market Outlook, By High Density Polyethylene (HDPE) (2020-2028) ($MN)
68 South America Plastic Tubs and Lids Market Outlook, By Low Density Polyethylene (LDPE) (2020-2028) ($MN)
69 South America Plastic Tubs and Lids Market Outlook, By Polypropylene (PP) (2020-2028) ($MN)
70 South America Plastic Tubs and Lids Market Outlook, By Application (2020-2028) ($MN)
71 South America Plastic Tubs and Lids Market Outlook, By Food (2020-2028) ($MN)
72 South America Plastic Tubs and Lids Market Outlook, By Ready to Eat (RTE) Products (2020-2028) ($MN)
73 South America Plastic Tubs and Lids Market Outlook, By Ice Cream (2020-2028) ($MN)
74 South America Plastic Tubs and Lids Market Outlook, By Frozen Food (2020-2028) ($MN)
75 South America Plastic Tubs and Lids Market Outlook, By Home and Hygiene (Detergent Pods) (2020-2028) ($MN)
76 Middle East & Africa Plastic Tubs and Lids Market Outlook, By Country (2020-2028) ($MN)
77 Middle East & Africa Plastic Tubs and Lids Market Outlook, By Capacity (2020-2028) ($MN)
78 Middle East & Africa Plastic Tubs and Lids Market Outlook, By 500 ml (2020-2028) ($MN)
79 Middle East & Africa Plastic Tubs and Lids Market Outlook, By 1 L (Litre) (2020-2028) ($MN)
80 Middle East & Africa Plastic Tubs and Lids Market Outlook, By Material Type (2020-2028) ($MN)
81 Middle East & Africa Plastic Tubs and Lids Market Outlook, By Polyethylene (PE) (2020-2028) ($MN)
82 Middle East & Africa Plastic Tubs and Lids Market Outlook, By High Density Polyethylene (HDPE) (2020-2028) ($MN)
83 Middle East & Africa Plastic Tubs and Lids Market Outlook, By Low Density Polyethylene (LDPE) (2020-2028) ($MN)
84 Middle East & Africa Plastic Tubs and Lids Market Outlook, By Polypropylene (PP) (2020-2028) ($MN)
85 Middle East & Africa Plastic Tubs and Lids Market Outlook, By Application (2020-2028) ($MN)
86 Middle East & Africa Plastic Tubs and Lids Market Outlook, By Food (2020-2028) ($MN)
87 Middle East & Africa Plastic Tubs and Lids Market Outlook, By Ready to Eat (RTE) Products (2020-2028) ($MN)
88 Middle East & Africa Plastic Tubs and Lids Market Outlook, By Ice Cream (2020-2028) ($MN)
89 Middle East & Africa Plastic Tubs and Lids Market Outlook, By Frozen Food (2020-2028) ($MN)
90 Middle East & Africa Plastic Tubs and Lids Market Outlook, By Home and Hygiene (Detergent Pods) (2020-2028) ($MN)
List of Figures
RESEARCH METHODOLOGY

We at ‘Stratistics’ opt for an extensive research approach which involves data mining, data validation, and data analysis. The various research sources include in-house repository, secondary research, competitor’s sources, social media research, client internal data, and primary research.
Our team of analysts prefers the most reliable and authenticated data sources in order to perform the comprehensive literature search. With access to most of the authenticated data bases our team highly considers the best mix of information through various sources to obtain extensive and accurate analysis.
Each report takes an average time of a month and a team of 4 industry analysts. The time may vary depending on the scope and data availability of the desired market report. The various parameters used in the market assessment are standardized in order to enhance the data accuracy.
Data Mining
The data is collected from several authenticated, reliable, paid and unpaid sources and is filtered depending on the scope & objective of the research. Our reports repository acts as an added advantage in this procedure. Data gathering from the raw material suppliers, distributors and the manufacturers is performed on a regular basis, this helps in the comprehensive understanding of the products value chain. Apart from the above mentioned sources the data is also collected from the industry consultants to ensure the objective of the study is in the right direction.
Market trends such as technological advancements, regulatory affairs, market dynamics (Drivers, Restraints, Opportunities and Challenges) are obtained from scientific journals, market related national & international associations and organizations.
Data Analysis
From the data that is collected depending on the scope & objective of the research the data is subjected for the analysis. The critical steps that we follow for the data analysis include:
- Product Lifecycle Analysis
- Competitor analysis
- Risk analysis
- Porters Analysis
- PESTEL Analysis
- SWOT Analysis
The data engineering is performed by the core industry experts considering both the Marketing Mix Modeling and the Demand Forecasting. The marketing mix modeling makes use of multiple-regression techniques to predict the optimal mix of marketing variables. Regression factor is based on a number of variables and how they relate to an outcome such as sales or profits.
Data Validation
The data validation is performed by the exhaustive primary research from the expert interviews. This includes telephonic interviews, focus groups, face to face interviews, and questionnaires to validate our research from all aspects. The industry experts we approach come from the leading firms, involved in the supply chain ranging from the suppliers, distributors to the manufacturers and consumers so as to ensure an unbiased analysis.
We are in touch with more than 15,000 industry experts with the right mix of consultants, CEO's, presidents, vice presidents, managers, experts from both supply side and demand side, executives and so on.
The data validation involves the primary research from the industry experts belonging to:
- Leading Companies
- Suppliers & Distributors
- Manufacturers
- Consumers
- Industry/Strategic Consultants
Apart from the data validation the primary research also helps in performing the fill gap research, i.e. providing solutions for the unmet needs of the research which helps in enhancing the reports quality.
For more details about research methodology, kindly write to us at info@strategymrc.com
Frequently Asked Questions
In case of any queries regarding this report, you can contact the customer service by filing the “Inquiry Before Buy” form available on the right hand side. You may also contact us through email: info@strategymrc.com or phone: +1-301-202-5929
Yes, the samples are available for all the published reports. You can request them by filling the “Request Sample” option available in this page.
Yes, you can request a sample with your specific requirements. All the customized samples will be provided as per the requirement with the real data masked.
All our reports are available in Digital PDF format. In case if you require them in any other formats, such as PPT, Excel etc you can submit a request through “Inquiry Before Buy” form available on the right hand side. You may also contact us through email: info@strategymrc.com or phone: +1-301-202-5929
We offer a free 15% customization with every purchase. This requirement can be fulfilled for both pre and post sale. You may send your customization requirements through email at info@strategymrc.com or call us on +1-301-202-5929.
We have 3 different licensing options available in electronic format.
- Single User Licence: Allows one person, typically the buyer, to have access to the ordered product. The ordered product cannot be distributed to anyone else.
- 2-5 User Licence: Allows the ordered product to be shared among a maximum of 5 people within your organisation.
- Corporate License: Allows the product to be shared among all employees of your organisation regardless of their geographical location.
All our reports are typically be emailed to you as an attachment.
To order any available report you need to register on our website. The payment can be made either through CCAvenue or PayPal payments gateways which accept all international cards.
We extend our support to 6 months post sale. A post sale customization is also provided to cover your unmet needs in the report.
Request Customization
We offer complimentary customization of up to 15% with every purchase. To share your customization requirements, feel free to email us at info@strategymrc.com or call us on +1-301-202-5929. .
Please Note: Customization within the 15% threshold is entirely free of charge. If your request exceeds this limit, we will conduct a feasibility assessment. Following that, a detailed quote and timeline will be provided.
WHY CHOOSE US ?

Assured Quality
Best in class reports with high standard of research integrity

24X7 Research Support
Continuous support to ensure the best customer experience.

Free Customization
Adding more values to your product of interest.

Safe & Secure Access
Providing a secured environment for all online transactions.

Trusted by 600+ Brands
Serving the most reputed brands across the world.