
Polysilicon Market
Polysilicon Market Forecasts to 2028 - Global Analysis By Grade (Electronic Grade and Solar Grade), By Form (Granules, Chunks and Rods), By Product Type, By Technology, By Application and By Geography

|
Years Covered |
2020-2028 |
|
Estimated Year Value (2022) |
US $10.22 BN |
|
Projected Year Value (2028) |
US $23.88 BN |
|
CAGR (2022 - 2028) |
15.2% |
|
Regions Covered |
North America, Europe, Asia Pacific, South America, and Middle East & Africa |
|
Countries Covered |
US, Canada, Mexico, Germany, UK, Italy, France, Spain, Japan, China, India, Australia, New Zealand, South Korea, Rest of Asia Pacific, South America, Argentina, Brazil, Chile, Middle East & Africa, Saudi Arabia, UAE, Qatar, and South Africa |
|
Largest Market |
Asia Pacific |
|
Highest Growing Market |
Asia Pacific |
According to Stratistics MRC, the Global Polysilicon Market is accounted for $10.22 billion in 2022 and is expected to reach $23.88 billion by 2028 growing at a CAGR of 15.2% during the forecast period. Metallurgical-grade silicon is used to develop polysilicon, also known as polycrystalline silicon. It is a very pure variety of silicon made up of numerous smaller crystals. This substance is an essential component used in the production of solar cells and other electronic devices.
According to International Renewable Energy Agency (IRENA), the total global solar capacity expansion increased by 19% in 2021, recording 133 GW additional installations. Furthermore, as per World Economic Forum, in 2021, for the first time, solar and wind together generated over 10% of the total electricity across the world, with solar power accounting for around 5% of the share.
Market Dynamics:
Driver:
Demand for solar power
An increase in the demand for polysilicon from the solar power industry is the main factor driving the market growth rate. The development and expansion of various end-user verticals in emerging economies, as well as the rising demand for polysilicon for a range of industrial applications, including the production of multi-crystalline solar panels, electronics, civilian small solar equipment, and others, will also directly and favourably affect the market's growth rate.
Restraint:
Insufficient Raw Materials and High Costs
Lack of demand and supply for raw materials as a result of the lockup and price volatility will be a significant barrier to the market's growth. The market's growth rate will be decelerated by the high cost of R&D, stringent government regulations on industrial operations, rising import and export taxes, and severe international trade barriers. The market's capacity for growth will also be restricted by high capital costs.
Opportunity:
Government initiatives
An increase in industrialization, a greater reliance on renewable energy sources, an increase in the number of small and medium-sized businesses, particularly in developing countries, and a growing emphasis on technological advancements and modernization of production methods will all contribute to the industry's growth. The government will also make greater efforts to reduce the cost of solar products.
Threat:
Use of Capital Intensive Manufacturing Process
The development of a manufacturing facility is a costly venture that also needs cutting-edge equipment and a highly qualified workforce. At present, China controls the market, producing about 80% of the world's goods. A silicon chip shortage brought on by pandemic-related supply chain disruptions had an effect on all industries related to semiconductor electronics, including the automotive and consumer electronics sectors, which depend on semiconductor components. Several nations have realised the significance of domestic production and its geopolitical implications for their semiconductor-dependent industries after witnessing supply chain vulnerabilities.
Covid-19 Impact:
In 2020, China dominated the world market and served as the central focus of the COVID-19 outbreak. The regional lockdown restrictions that were imposed during the pandemic disrupted supply chains and had a negative impact on many end-use industries. Additionally, trade restrictions, labour and raw material shortages, a lack of freight containers, and logistical difficulties all contributed to the pandemic's disruption of the global supply chain. Moreover, the capacity for producing semiconductors was significantly impacted by the lack of raw materials, which led to a total lack of silicon chips.
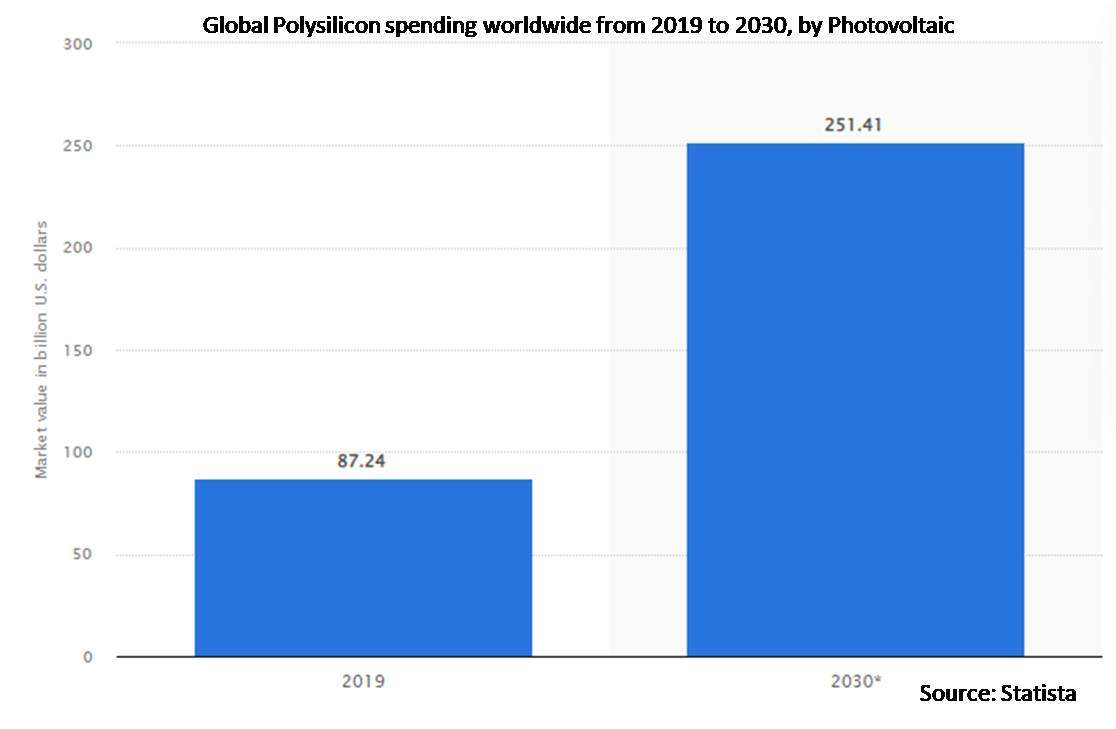
The photovoltaic segment is expected to be the largest during the forecast period
Due to the widespread use of materials in the production of semiconductors and solar photovoltaic panels, the photovoltaics segment is expected to dominate the market during the projection period. However, the main factor driving this segment's growth is the rising global demand for the installation of solar PV systems, which in turn drives up demand.
The electronics grade segment is expected to have the highest CAGR during the forecast period
Due to the electronics sector's rapid growth and a rise in solar energy usage, the electronics segment is expected to have the highest CAGR during the forecast period. Manufacturers are considering other renewable energy options, like solar energy, in a variety of business sectors due to growing concerns about the depletion of conventional energy sources and the sustainability of the environment. Moreover, solar panels are used as alternative sources of electricity alongside various electrical appliances in power grids and commercial and residential buildings.
Region with largest share:
Because of rising consumption in nations like China, South Korea, and India, the Asia-Pacific region is expected to dominate the global market for polysilicon during the estimation period. The nation's 122,000-ton annual production capacity for polysilicon was emerging, according to the Chinese ministry. Additionally, the majority of the largest solar power facilities in the world as of June 2021 were identified in China and India. Moreover, with a total output capacity of 2,245 megawatts, the Bhadla solar farm is located in India's Jodhpur district, Rajasthan.
Region with highest CAGR:
Due to a variety of factors, including an increase in power outages, an immediate need for dependable power supply, rising demand from a range of end-use industries, and an increase in research and development activities, the Asia-Pacific region is anticipated to have the highest CAGR in the polysilicon market during the forecast period. Furthermore, rising consumption and demand from nations like China and India, investment policies by the government to support industrial growth, and high economic growth are driving market growth in this region.

Key players in the market
Some of the key players in Polysilicon market include SunEdison Inc, Hemlock Semiconductor Operations And Hemlock Semiconductor, REC Silicon ASA, Tokuyama Corporation, Mitsubishi Polycrystalline Silicon America Corporation, Qatar Solar Technologies, Wacker Chemie AG, Osaka Titanium Technologies Co. Ltd, OCI Solar Power LLC, Daqo New Energy Corp. and GCL-Poly Energy Holdings Limited.
Key Developments:
In August 2022, REC Silicon ASA and Mississippi Silicon collaborated to develop a solar supply chain in the United States. They plan to develop this solar supply chain from raw silicon to polysilicon and finally to fully assembled modules.
In April 2022, OCI Company Ltd signed a binding memorandum of understanding (MoU) with the South Korean-based solar manufacturer Hanwha Solutions, which is a unit of Hanwha, for the supply of polysilicon. The order was valued at about USD 1.2 billion. This has helped the company in increasing its profit margins.
Grades Covered:
• Electronic Grade
• Solar Grade
Forms Covered:
• Granules
• Chunks
• Rods
Product Types Covered:
• Parallel Connection
• Series Connection
Technologies Covered:
• Upgraded Metallurgical-Grade Silicon Process
• Fluidized Bed Reactor (FBR) Process
• Siemens Process
Applications Covered:
• Photovoltaic
• Solar Power Generation
• Monocrystalline Solar Panel
• Multicrystalline Solar Panel
• Civilian Solar Small Equipment
Regions Covered:
• North America
o US
o Canada
o Mexico
• Europe
o Germany
o UK
o Italy
o France
o Spain
o Rest of Europe
• Asia Pacific
o Japan
o China
o India
o Australia
o New Zealand
o South Korea
o Rest of Asia Pacific
• South America
o Argentina
o Brazil
o Chile
o Rest of South America
• Middle East & Africa
o Saudi Arabia
o UAE
o Qatar
o South Africa
o Rest of Middle East & Africa
What our report offers:
- Market share assessments for the regional and country-level segments
- Strategic recommendations for the new entrants
- Covers Market data for the years 2020, 2021, 2022, 2025, and 2028
- Market Trends (Drivers, Constraints, Opportunities, Threats, Challenges, Investment Opportunities, and recommendations)
- Strategic recommendations in key business segments based on the market estimations
- Competitive landscaping mapping the key common trends
- Company profiling with detailed strategies, financials, and recent developments
- Supply chain trends mapping the latest technological advancements
Free Customization Offerings:
All the customers of this report will be entitled to receive one of the following free customization options:
• Company Profiling
o Comprehensive profiling of additional market players (up to 3)
o SWOT Analysis of key players (up to 3)
• Regional Segmentation
o Market estimations, Forecasts and CAGR of any prominent country as per the client's interest (Note: Depends on feasibility check)
• Competitive Benchmarking
Benchmarking of key players based on product portfolio, geographical presence, and strategic alliances
Table of Contents
1 Executive Summary
2 Preface
2.1 Abstract
2.2 Stake Holders
2.3 Research Scope
2.4 Research Methodology
2.4.1 Data Mining
2.4.2 Data Analysis
2.4.3 Data Validation
2.4.4 Research Approach
2.5 Research Sources
2.5.1 Primary Research Sources
2.5.2 Secondary Research Sources
2.5.3 Assumptions
3 Market Trend Analysis
3.1 Introduction
3.2 Drivers
3.3 Restraints
3.4 Opportunities
3.5 Threats
3.6 Product Analysis
3.7 Technology Analysis
3.8 Application Analysis
3.9 Emerging Markets
3.10 Impact of Covid-19
4 Porters Five Force Analysis
4.1 Bargaining power of suppliers
4.2 Bargaining power of buyers
4.3 Threat of substitutes
4.4 Threat of new entrants
4.5 Competitive rivalry
5 Global Polysilicon Market, By Grade
5.1 Introduction
5.2 Electronic Grade
5.3 Solar Grade
6 Global Polysilicon Market, By Form
6.1 Introduction
6.2 Granules
6.3 Chunks
6.4 Rods
7 Global Polysilicon Market, By Product Type
7.1 Introduction
7.2 Parallel Connection
7.3 Series Connection
8 Global Polysilicon Market, By Technology
8.1 Introduction
8.2 Upgraded Metallurgical-Grade Silicon Process
8.3 Fluidized Bed Reactor (FBR) Process
8.4 Siemens Process
9 Global Polysilicon Market, By Application
9.1 Introduction
9.2 Photovoltaic
9.3 Solar Power Generation
9.4 Monocrystalline Solar Panel
9.5 Multicrystalline Solar Panel
9.6 Civilian Solar Small Equipment
10 Global Polysilicon Market, By Geography
10.1 Introduction
10.2 North America
10.2.1 US
10.2.2 Canada
10.2.3 Mexico
10.3 Europe
10.3.1 Germany
10.3.2 UK
10.3.3 Italy
10.3.4 France
10.3.5 Spain
10.3.6 Rest of Europe
10.4 Asia Pacific
10.4.1 Japan
10.4.2 China
10.4.3 India
10.4.4 Australia
10.4.5 New Zealand
10.4.6 South Korea
10.4.7 Rest of Asia Pacific
10.5 South America
10.5.1 Argentina
10.5.2 Brazil
10.5.3 Chile
10.5.4 Rest of South America
10.6 Middle East & Africa
10.6.1 Saudi Arabia
10.6.2 UAE
10.6.3 Qatar
10.6.4 South Africa
10.6.5 Rest of Middle East & Africa
11 Key Developments
11.1 Agreements, Partnerships, Collaborations and Joint Ventures
11.2 Acquisitions & Mergers
11.3 New Product Launch
11.4 Expansions
11.5 Other Key Strategies
12 Company Profiling
12.1 SunEdison Inc
12.2 Hemlock Semiconductor Operations And Hemlock Semiconductor
12.3 REC Silicon ASA
12.4 Tokuyama Corporation
12.5 Mitsubishi Polycrystalline Silicon America Corporation
12.6 Qatar Solar Technologies
12.7 Wacker Chemie AG
12.8 Osaka Titanium Technologies Co. Ltd
12.9 OCI Solar Power LLC
12.10 Daqo New Energy Corp.
12.11 GCL-Poly Energy Holdings Limited
List of Tables
1 Global Polysilicon Market Outlook, By Region (2020-2028) ($MN)
2 Global Polysilicon Market Outlook, By Grade (2020-2028) ($MN)
3 Global Polysilicon Market Outlook, By Electronic Grade (2020-2028) ($MN)
4 Global Polysilicon Market Outlook, By Solar Grade (2020-2028) ($MN)
5 Global Polysilicon Market Outlook, By Form (2020-2028) ($MN)
6 Global Polysilicon Market Outlook, By Granules (2020-2028) ($MN)
7 Global Polysilicon Market Outlook, By Chunks (2020-2028) ($MN)
8 Global Polysilicon Market Outlook, By Rods (2020-2028) ($MN)
9 Global Polysilicon Market Outlook, By Product Type (2020-2028) ($MN)
10 Global Polysilicon Market Outlook, By Parallel Connection (2020-2028) ($MN)
11 Global Polysilicon Market Outlook, By Series Connection (2020-2028) ($MN)
12 Global Polysilicon Market Outlook, By Technology (2020-2028) ($MN)
13 Global Polysilicon Market Outlook, By Upgraded Metallurgical-Grade Silicon Process (2020-2028) ($MN)
14 Global Polysilicon Market Outlook, By Fluidized Bed Reactor (FBR) Process (2020-2028) ($MN)
15 Global Polysilicon Market Outlook, By Siemens Process (2020-2028) ($MN)
16 Global Polysilicon Market Outlook, By Application (2020-2028) ($MN)
17 Global Polysilicon Market Outlook, By Photovoltaic (2020-2028) ($MN)
18 Global Polysilicon Market Outlook, By Solar Power Generation (2020-2028) ($MN)
19 Global Polysilicon Market Outlook, By Monocrystalline Solar Panel (2020-2028) ($MN)
20 Global Polysilicon Market Outlook, By Multicrystalline Solar Panel (2020-2028) ($MN)
21 Global Polysilicon Market Outlook, By Civilian Solar Small Equipment (2020-2028) ($MN)
22 North America Polysilicon Market Outlook, By Country (2020-2028) ($MN)
23 North America Polysilicon Market Outlook, By Grade (2020-2028) ($MN)
24 North America Polysilicon Market Outlook, By Electronic Grade (2020-2028) ($MN)
25 North America Polysilicon Market Outlook, By Solar Grade (2020-2028) ($MN)
26 North America Polysilicon Market Outlook, By Form (2020-2028) ($MN)
27 North America Polysilicon Market Outlook, By Granules (2020-2028) ($MN)
28 North America Polysilicon Market Outlook, By Chunks (2020-2028) ($MN)
29 North America Polysilicon Market Outlook, By Rods (2020-2028) ($MN)
30 North America Polysilicon Market Outlook, By Product Type (2020-2028) ($MN)
31 North America Polysilicon Market Outlook, By Parallel Connection (2020-2028) ($MN)
32 North America Polysilicon Market Outlook, By Series Connection (2020-2028) ($MN)
33 North America Polysilicon Market Outlook, By Technology (2020-2028) ($MN)
34 North America Polysilicon Market Outlook, By Upgraded Metallurgical-Grade Silicon Process (2020-2028) ($MN)
35 North America Polysilicon Market Outlook, By Fluidized Bed Reactor (FBR) Process (2020-2028) ($MN)
36 North America Polysilicon Market Outlook, By Siemens Process (2020-2028) ($MN)
37 North America Polysilicon Market Outlook, By Application (2020-2028) ($MN)
38 North America Polysilicon Market Outlook, By Photovoltaic (2020-2028) ($MN)
39 North America Polysilicon Market Outlook, By Solar Power Generation (2020-2028) ($MN)
40 North America Polysilicon Market Outlook, By Monocrystalline Solar Panel (2020-2028) ($MN)
41 North America Polysilicon Market Outlook, By Multicrystalline Solar Panel (2020-2028) ($MN)
42 North America Polysilicon Market Outlook, By Civilian Solar Small Equipment (2020-2028) ($MN)
43 Europe Polysilicon Market Outlook, By Country (2020-2028) ($MN)
44 Europe Polysilicon Market Outlook, By Grade (2020-2028) ($MN)
45 Europe Polysilicon Market Outlook, By Electronic Grade (2020-2028) ($MN)
46 Europe Polysilicon Market Outlook, By Solar Grade (2020-2028) ($MN)
47 Europe Polysilicon Market Outlook, By Form (2020-2028) ($MN)
48 Europe Polysilicon Market Outlook, By Granules (2020-2028) ($MN)
49 Europe Polysilicon Market Outlook, By Chunks (2020-2028) ($MN)
50 Europe Polysilicon Market Outlook, By Rods (2020-2028) ($MN)
51 Europe Polysilicon Market Outlook, By Product Type (2020-2028) ($MN)
52 Europe Polysilicon Market Outlook, By Parallel Connection (2020-2028) ($MN)
53 Europe Polysilicon Market Outlook, By Series Connection (2020-2028) ($MN)
54 Europe Polysilicon Market Outlook, By Technology (2020-2028) ($MN)
55 Europe Polysilicon Market Outlook, By Upgraded Metallurgical-Grade Silicon Process (2020-2028) ($MN)
56 Europe Polysilicon Market Outlook, By Fluidized Bed Reactor (FBR) Process (2020-2028) ($MN)
57 Europe Polysilicon Market Outlook, By Siemens Process (2020-2028) ($MN)
58 Europe Polysilicon Market Outlook, By Application (2020-2028) ($MN)
59 Europe Polysilicon Market Outlook, By Photovoltaic (2020-2028) ($MN)
60 Europe Polysilicon Market Outlook, By Solar Power Generation (2020-2028) ($MN)
61 Europe Polysilicon Market Outlook, By Monocrystalline Solar Panel (2020-2028) ($MN)
62 Europe Polysilicon Market Outlook, By Multicrystalline Solar Panel (2020-2028) ($MN)
63 Europe Polysilicon Market Outlook, By Civilian Solar Small Equipment (2020-2028) ($MN)
64 Asia Pacific Polysilicon Market Outlook, By Country (2020-2028) ($MN)
65 Asia Pacific Polysilicon Market Outlook, By Grade (2020-2028) ($MN)
66 Asia Pacific Polysilicon Market Outlook, By Electronic Grade (2020-2028) ($MN)
67 Asia Pacific Polysilicon Market Outlook, By Solar Grade (2020-2028) ($MN)
68 Asia Pacific Polysilicon Market Outlook, By Form (2020-2028) ($MN)
69 Asia Pacific Polysilicon Market Outlook, By Granules (2020-2028) ($MN)
70 Asia Pacific Polysilicon Market Outlook, By Chunks (2020-2028) ($MN)
71 Asia Pacific Polysilicon Market Outlook, By Rods (2020-2028) ($MN)
72 Asia Pacific Polysilicon Market Outlook, By Product Type (2020-2028) ($MN)
73 Asia Pacific Polysilicon Market Outlook, By Parallel Connection (2020-2028) ($MN)
74 Asia Pacific Polysilicon Market Outlook, By Series Connection (2020-2028) ($MN)
75 Asia Pacific Polysilicon Market Outlook, By Technology (2020-2028) ($MN)
76 Asia Pacific Polysilicon Market Outlook, By Upgraded Metallurgical-Grade Silicon Process (2020-2028) ($MN)
77 Asia Pacific Polysilicon Market Outlook, By Fluidized Bed Reactor (FBR) Process (2020-2028) ($MN)
78 Asia Pacific Polysilicon Market Outlook, By Siemens Process (2020-2028) ($MN)
79 Asia Pacific Polysilicon Market Outlook, By Application (2020-2028) ($MN)
80 Asia Pacific Polysilicon Market Outlook, By Photovoltaic (2020-2028) ($MN)
81 Asia Pacific Polysilicon Market Outlook, By Solar Power Generation (2020-2028) ($MN)
82 Asia Pacific Polysilicon Market Outlook, By Monocrystalline Solar Panel (2020-2028) ($MN)
83 Asia Pacific Polysilicon Market Outlook, By Multicrystalline Solar Panel (2020-2028) ($MN)
84 Asia Pacific Polysilicon Market Outlook, By Civilian Solar Small Equipment (2020-2028) ($MN)
85 South America Polysilicon Market Outlook, By Country (2020-2028) ($MN)
86 South America Polysilicon Market Outlook, By Grade (2020-2028) ($MN)
87 South America Polysilicon Market Outlook, By Electronic Grade (2020-2028) ($MN)
88 South America Polysilicon Market Outlook, By Solar Grade (2020-2028) ($MN)
89 South America Polysilicon Market Outlook, By Form (2020-2028) ($MN)
90 South America Polysilicon Market Outlook, By Granules (2020-2028) ($MN)
91 South America Polysilicon Market Outlook, By Chunks (2020-2028) ($MN)
92 South America Polysilicon Market Outlook, By Rods (2020-2028) ($MN)
93 South America Polysilicon Market Outlook, By Product Type (2020-2028) ($MN)
94 South America Polysilicon Market Outlook, By Parallel Connection (2020-2028) ($MN)
95 South America Polysilicon Market Outlook, By Series Connection (2020-2028) ($MN)
96 South America Polysilicon Market Outlook, By Technology (2020-2028) ($MN)
97 South America Polysilicon Market Outlook, By Upgraded Metallurgical-Grade Silicon Process (2020-2028) ($MN)
98 South America Polysilicon Market Outlook, By Fluidized Bed Reactor (FBR) Process (2020-2028) ($MN)
99 South America Polysilicon Market Outlook, By Siemens Process (2020-2028) ($MN)
100 South America Polysilicon Market Outlook, By Application (2020-2028) ($MN)
101 South America Polysilicon Market Outlook, By Photovoltaic (2020-2028) ($MN)
102 South America Polysilicon Market Outlook, By Solar Power Generation (2020-2028) ($MN)
103 South America Polysilicon Market Outlook, By Monocrystalline Solar Panel (2020-2028) ($MN)
104 South America Polysilicon Market Outlook, By Multicrystalline Solar Panel (2020-2028) ($MN)
105 South America Polysilicon Market Outlook, By Civilian Solar Small Equipment (2020-2028) ($MN)
106 Middle East & Africa Polysilicon Market Outlook, By Country (2020-2028) ($MN)
107 Middle East & Africa Polysilicon Market Outlook, By Grade (2020-2028) ($MN)
108 Middle East & Africa Polysilicon Market Outlook, By Electronic Grade (2020-2028) ($MN)
109 Middle East & Africa Polysilicon Market Outlook, By Solar Grade (2020-2028) ($MN)
110 Middle East & Africa Polysilicon Market Outlook, By Form (2020-2028) ($MN)
111 Middle East & Africa Polysilicon Market Outlook, By Granules (2020-2028) ($MN)
112 Middle East & Africa Polysilicon Market Outlook, By Chunks (2020-2028) ($MN)
113 Middle East & Africa Polysilicon Market Outlook, By Rods (2020-2028) ($MN)
114 Middle East & Africa Polysilicon Market Outlook, By Product Type (2020-2028) ($MN)
115 Middle East & Africa Polysilicon Market Outlook, By Parallel Connection (2020-2028) ($MN)
116 Middle East & Africa Polysilicon Market Outlook, By Series Connection (2020-2028) ($MN)
117 Middle East & Africa Polysilicon Market Outlook, By Technology (2020-2028) ($MN)
118 Middle East & Africa Polysilicon Market Outlook, By Upgraded Metallurgical-Grade Silicon Process (2020-2028) ($MN)
119 Middle East & Africa Polysilicon Market Outlook, By Fluidized Bed Reactor (FBR) Process (2020-2028) ($MN)
120 Middle East & Africa Polysilicon Market Outlook, By Siemens Process (2020-2028) ($MN)
121 Middle East & Africa Polysilicon Market Outlook, By Application (2020-2028) ($MN)
122 Middle East & Africa Polysilicon Market Outlook, By Photovoltaic (2020-2028) ($MN)
123 Middle East & Africa Polysilicon Market Outlook, By Solar Power Generation (2020-2028) ($MN)
124 Middle East & Africa Polysilicon Market Outlook, By Monocrystalline Solar Panel (2020-2028) ($MN)
125 Middle East & Africa Polysilicon Market Outlook, By Multicrystalline Solar Panel (2020-2028) ($MN)
126 Middle East & Africa Polysilicon Market Outlook, By Civilian Solar Small Equipment (2020-2028) ($MN)
List of Figures
RESEARCH METHODOLOGY

We at ‘Stratistics’ opt for an extensive research approach which involves data mining, data validation, and data analysis. The various research sources include in-house repository, secondary research, competitor’s sources, social media research, client internal data, and primary research.
Our team of analysts prefers the most reliable and authenticated data sources in order to perform the comprehensive literature search. With access to most of the authenticated data bases our team highly considers the best mix of information through various sources to obtain extensive and accurate analysis.
Each report takes an average time of a month and a team of 4 industry analysts. The time may vary depending on the scope and data availability of the desired market report. The various parameters used in the market assessment are standardized in order to enhance the data accuracy.
Data Mining
The data is collected from several authenticated, reliable, paid and unpaid sources and is filtered depending on the scope & objective of the research. Our reports repository acts as an added advantage in this procedure. Data gathering from the raw material suppliers, distributors and the manufacturers is performed on a regular basis, this helps in the comprehensive understanding of the products value chain. Apart from the above mentioned sources the data is also collected from the industry consultants to ensure the objective of the study is in the right direction.
Market trends such as technological advancements, regulatory affairs, market dynamics (Drivers, Restraints, Opportunities and Challenges) are obtained from scientific journals, market related national & international associations and organizations.
Data Analysis
From the data that is collected depending on the scope & objective of the research the data is subjected for the analysis. The critical steps that we follow for the data analysis include:
- Product Lifecycle Analysis
- Competitor analysis
- Risk analysis
- Porters Analysis
- PESTEL Analysis
- SWOT Analysis
The data engineering is performed by the core industry experts considering both the Marketing Mix Modeling and the Demand Forecasting. The marketing mix modeling makes use of multiple-regression techniques to predict the optimal mix of marketing variables. Regression factor is based on a number of variables and how they relate to an outcome such as sales or profits.
Data Validation
The data validation is performed by the exhaustive primary research from the expert interviews. This includes telephonic interviews, focus groups, face to face interviews, and questionnaires to validate our research from all aspects. The industry experts we approach come from the leading firms, involved in the supply chain ranging from the suppliers, distributors to the manufacturers and consumers so as to ensure an unbiased analysis.
We are in touch with more than 15,000 industry experts with the right mix of consultants, CEO's, presidents, vice presidents, managers, experts from both supply side and demand side, executives and so on.
The data validation involves the primary research from the industry experts belonging to:
- Leading Companies
- Suppliers & Distributors
- Manufacturers
- Consumers
- Industry/Strategic Consultants
Apart from the data validation the primary research also helps in performing the fill gap research, i.e. providing solutions for the unmet needs of the research which helps in enhancing the reports quality.
For more details about research methodology, kindly write to us at info@strategymrc.com
Frequently Asked Questions
In case of any queries regarding this report, you can contact the customer service by filing the “Inquiry Before Buy” form available on the right hand side. You may also contact us through email: info@strategymrc.com or phone: +1-301-202-5929
Yes, the samples are available for all the published reports. You can request them by filling the “Request Sample” option available in this page.
Yes, you can request a sample with your specific requirements. All the customized samples will be provided as per the requirement with the real data masked.
All our reports are available in Digital PDF format. In case if you require them in any other formats, such as PPT, Excel etc you can submit a request through “Inquiry Before Buy” form available on the right hand side. You may also contact us through email: info@strategymrc.com or phone: +1-301-202-5929
We offer a free 15% customization with every purchase. This requirement can be fulfilled for both pre and post sale. You may send your customization requirements through email at info@strategymrc.com or call us on +1-301-202-5929.
We have 3 different licensing options available in electronic format.
- Single User Licence: Allows one person, typically the buyer, to have access to the ordered product. The ordered product cannot be distributed to anyone else.
- 2-5 User Licence: Allows the ordered product to be shared among a maximum of 5 people within your organisation.
- Corporate License: Allows the product to be shared among all employees of your organisation regardless of their geographical location.
All our reports are typically be emailed to you as an attachment.
To order any available report you need to register on our website. The payment can be made either through CCAvenue or PayPal payments gateways which accept all international cards.
We extend our support to 6 months post sale. A post sale customization is also provided to cover your unmet needs in the report.
Request Customization
We offer complimentary customization of up to 15% with every purchase. To share your customization requirements, feel free to email us at info@strategymrc.com or call us on +1-301-202-5929. .
Please Note: Customization within the 15% threshold is entirely free of charge. If your request exceeds this limit, we will conduct a feasibility assessment. Following that, a detailed quote and timeline will be provided.
WHY CHOOSE US ?

Assured Quality
Best in class reports with high standard of research integrity

24X7 Research Support
Continuous support to ensure the best customer experience.

Free Customization
Adding more values to your product of interest.

Safe & Secure Access
Providing a secured environment for all online transactions.

Trusted by 600+ Brands
Serving the most reputed brands across the world.