
Power Electronic Market
Power Electronic Market Forecasts to 2028 - Global Analysis By Device Type (Power Discrete, Power IC, Power Module), Material (Silicon Carbide (SiC), Gallium Nitride (GaN) ) and By Geography

|
Years Covered |
2020-2028 |
|
Estimated Year Value (2022) |
US $40.55 BN |
|
Projected Year Value (2028) |
US $58.84 BN |
|
CAGR (2022 - 2028) |
6.4% |
|
Regions Covered |
North America, Europe, Asia Pacific, South America, and Middle East & Africa |
|
Countries Covered |
US, Canada, Mexico, Germany, UK, Italy, France, Spain, Japan, China, India, Australia, New Zealand, South Korea, Rest of Asia Pacific, South America, Argentina, Brazil, Chile, Middle East & Africa, Saudi Arabia, UAE, Qatar, and South Africa |
|
Largest Market |
North America |
|
Fastest Growing Market |
Asia Pacific |
According to Stratistics MRC, the Global Power Electronic Market is accounted for $40.55 billion in 2022 and is expected to reach $58.84 billion by 2028 growing at a CAGR of 6.4% during the forecast period. Power electronics is the application of solid-state electronics to the control and conversion of electric power. It is used to control the fluctuated power from one device to other power devices such as diodes, transistors, and thyristors. In addition, power electronics can control the flow of energy in unidirectional as well as bidirectional manner, depending upon the usage. Presently, it is used in renewable resources and electric vehicles to develop switching speed and prevent power loss.
According to the Chinese Ministry of Information Technology (MIT), the country deployed over 700,000 5G base stations in 2020 and the country is expected to have 600 million subscribers by 2025, according to GSMA.For instance, in January 2020, the US-based Solid State Devices Inc. launched the SFC35N120 1200-volt silicon carbide (SiC) power MOSFETs for high-reliability aerospace and defense power electronics applications, like PFC boost converters and high-voltage DC-DC converters.
Market Dynamics:
Driver:
Increasing demand for the electric vehicles
Increasing consciousness among the consumers regarding the worsening environmental conditions and growing government initiatives to control carbon emission is fostering the demand for electric vehicles, especially in developed regions like Europe and North America. Automotive components such as windshield wiper control, interior lighting, ignition switch, and power steering are made using power electronics. Therefore, the growing demand for electric vehicles across the globe is expected to drive the growth of the market.
Restraint:
Constant unavailability of semiconductors
The on-going shortages of semiconductors may obstruct market growth. The increasing gap between the demand and supply of semiconductors may adversely impact the global power electronics market during the forecast period.
Opportunity:
Extensive band gap semiconductors encouraging new applications of power electronics
The emergence of wide bandgap semiconductor materials, such as GaN and SiC, has changed the landscape of the market. Wide bandgap semiconductor materials allow for designing smaller, faster, and more reliable power electronic components with higher efficiency than their silicon-based components. The reduction in energy dissipated as heat as a result of higher efficiency not only cuts power losses but also enables the use of smaller systems, reducing costs with higher switching speeds compared to silicon solutions. These capabilities make it possible to reduce weight, volume, and life cycle costs in a wide range of power applications. Moreover, the use of SiC and GaN has resulted in improvements in the existing semiconductor technologies. The higher electron mobility of SiC and GaN enables devices built with those WBG materials to operate at higher switching speeds. These are a few applications where wide bandgap power electronics are expected to be deployed.
Threat:
Ever-changing demand for small, highly efficient, and cost-effective devices
A major issue faced by manufacturers is to meet the ever-changing needs of consumers for more compact devices. To cater to the demand for solid, moveable, and multifunctional devices, components and systems need to be miniaturized to lower production costs. For this purpose, manufacturers are actively investing in research and development (R&D) to develop products and enhance their product offerings to stay competitive in the market. Thus, continuous demand for more compact devices can be a barrier, as it does not justify the return on investments due to the uncertainty associated with the life cycle of developed technologies or products.
The outbreak of COVID-19 has significantly impacted the growth of the market growth, however, with the rise in demand for fundamentals of power electronics and power electronics devices solutions are expected to witness relatively high growth by the end of 2021. However, the market was principally hit by several obstacles created amid the COVID-19 pandemic such as lack of skilled workforce availability and delay or cancelation of projects owing to partial or complete lockdown globally. In contrast, a rise in penetration of power electronics inverters solutions is expected to drive the growth of the test and measurement equipment market during the forecast period.
The automotive segment is expected to be the largest during the forecast period
The automotive segment is expected to be the largest during the forecast period; this can be accredited to the increasing popularity of the electric vehicle among global consumers. The growing demand for emission-free vehicles to protect the environment from pollution emitted from vehicles is predicted to drive the growth of this segment. Moreover, the utilization of power electronics in hybrid electronic vehicles (HEV) and electronic vehicles (EV) for increased efficiency and reliability is propelling the market growth. The growing production of HEV/EV is increasing the utilization of power electronics and further propelling the market growth.
The silicon segment is expected to have the highest CAGR during the forecast period
The silicon segment is expected to have the highest CAGR during the forecast period. Silicon has been measured as the most favourable substrate for making power electronics. Moreover, the growing acceptance of silicon in the production of the majority of semiconductor wafers has boosted the growth of the market. The rising utilization of silicon carbide devices by OEMs for the manufacturing of hybrid vehicles is driving the segment’s growth. Further, the growing utilization of silicon carbide in EV inverters for increased efficiency and reduced carbon footprint is driving the market growth.
Region with highest share:
North America is projected to hold the largest market share during the forecast period,owing to the continuous preference toward the acceptance of emerging technologies. The high focus on innovations in research and development, across organizations in numerous industries, is complementing the industry growth. Furthermore, the presence of several players in the region offering services is further supplementing the industry growth in the region.This region is a hub for advanced semiconductor technologies and their early adoption in innovative applications. Also, the vast demand, particularly from the automotive and consumer electronics industry verticals, substantiates the regional market growth. The presence of several well-established infrastructures pushes market revenues, allowing the implementation of futuristic technologies.The US and Canada account for major growth contributors to the regional market. Furthermore, the presence of notable electronics manufacturers, increasing demand for digital technologies, and growing technological advancements drive the market.
Region with highest CAGR:
Asia Pacific is projected to have the highest CAGR over the forecast period Asia Pacific. The improvement in power transmission and use of renewable energy and increasing demand for industrial and energy & power verticals are some of the factors driving the market in this region. Factors such as the rising focus on renewable power sources across the industry verticals and technological advances drive the market growth. Besides, the accessibility of powerful and cost-competitive technologies is a key driving force behind the regional market growth. Moreover, the presence of many electronic devices manufacturing companies in the region fosters the growth of the market.

Key players in the market
Some of the key players profiled in the Power ElectronicMarket include Siemens AG, Mitsubishi Electric, Toshiba, Texas Instruments, Infineon Technologies, ABB Group, Rockwell Automation, NXP Semiconductors N.V., STMicroelectronics N.V., Vishay Intertechnology, Inc., Qualcomm, Inc., Fuji Electric Co., Ltd, Renesas Electronics Corp., ON Semiconductor Corp., Microchip Technology, ROHM Semiconductor, Littelfuse, Analog Devices and Hitachi.
Key Developments:
In August 2021: STMicroelectronics (Switzerland) launched its new 45W and 150W MasterGaN devices for high-efficiency power conversion.The GaN power transistors of MasterGaN3 devices have asymmetrical on-resistance (Rds(on)) of 225m? and 450m?, making these devices suited to soft-switching and active-rectification converters. In MasterGaN5 both transistors have 450m? Rds(on) for use in topologies such as LLC-resonant and Active Clamp Flyback.
In March 2021: Infineon Technologies launchedStrongIRFET 2 power MOSFETs. It is available in the voltage range of 80 and 100V and is optimized for both the high and low frequencies.
In June 2021: ON Semiconductor (US) announced its new, full silicon carbide MOSFET module solutions for charging electric vehicles with its 1200V full silicon carbide (SiC) MOSFET 2-PACK modules. This is expected to provide a comprehensive portfolio of wide bandgap devices for high-performance charging solutions.
Device Types Covered:
• Power Discrete
• Power IC
• Power Module
• AC-DC converters
• DC-DC converters
• AC-AC converters
• DC-AC converters
• Static switches
Materials Covered:
• Silicon Carbide (SiC)
• Gallium Nitride (GaN)
• Silicon (Si)
• Other Materials
Applications Covered:
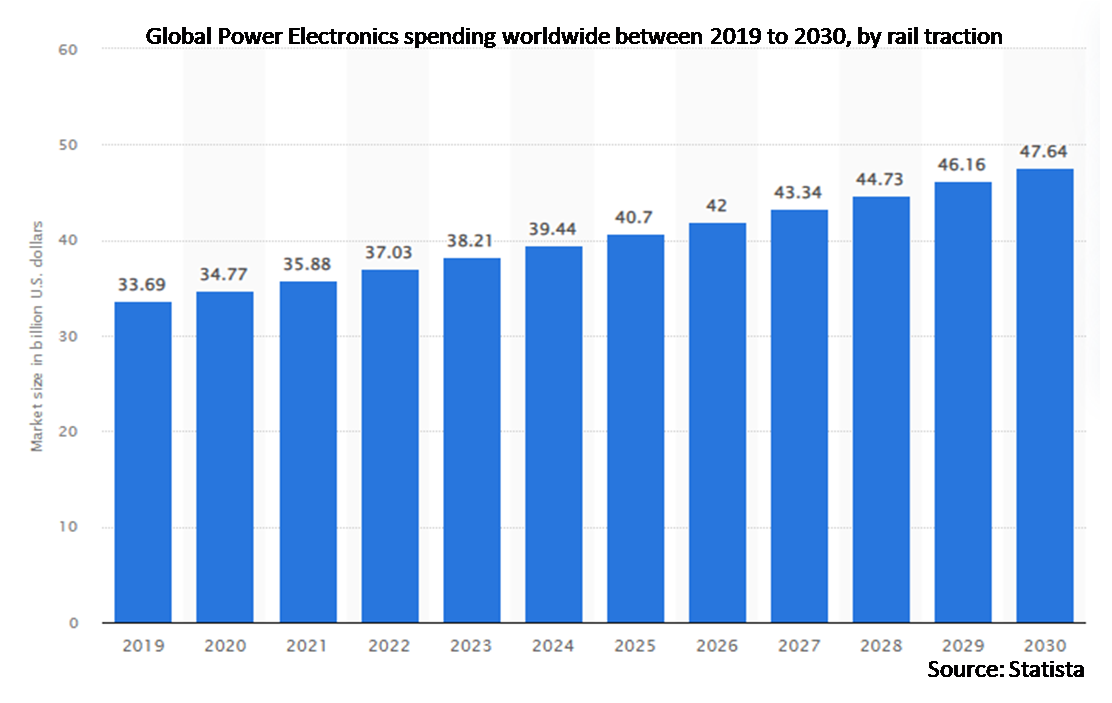
• Rail Traction
• Renewable
• Power Management
• Inverter & Uninterruptible Power Supply (UPS)
• Drives
• Solar power
• Wind power
• Transportation
• Other Applications
End Users Covered:
• Aerospace and Defense
• Energy and Power
• Industrial
• Information and Communications Technology
• Automotive
• Medical Devices
Regions Covered:
• North America
o US
o Canada
o Mexico
• Europe
o Germany
o UK
o Italy
o France
o Spain
o Rest of Europe
• Asia Pacific
o Japan
o China
o India
o Australia
o New Zealand
o South Korea
o Rest of Asia Pacific
• South America
o Argentina
o Brazil
o Chile
o Rest of South America
• Middle East & Africa
o Saudi Arabia
o UAE
o Qatar
o South Africa
o Rest of Middle East & Africa
What our report offers:
- Market share assessments for the regional and country-level segments
- Strategic recommendations for the new entrants
- Covers Market data for the years 2020, 2021, 2022, 2025 and 2028
- Market Trends (Drivers, Constraints, Opportunities, Threats, Challenges, Investment Opportunities, and recommendations)
- Strategic recommendations in key business segments based on the market estimations
- Competitive landscaping mapping the key common trends
- Company profiling with detailed strategies, financials, and recent developments
- Supply chain trends mapping the latest technological advancements
Free Customization Offerings:
All the customers of this report will be entitled to receive one of the following free customization options:
• Company Profiling
o Comprehensive profiling of additional market players (up to 3)
o SWOT Analysis of key players (up to 3)
• Regional Segmentation
o Market estimations, Forecasts and CAGR of any prominent country as per the client's interest (Note: Depends on feasibility check)
• Competitive Benchmarking
o Benchmarking of key players based on product portfolio, geographical presence, and strategic alliances
Table of Contents
1 Executive Summary
2 Preface
2.1 Abstract
2.2 Stake Holders
2.3 Research Scope
2.4 Research Methodology
2.4.1 Data Mining
2.4.2 Data Analysis
2.4.3 Data Validation
2.4.4 Research Approach
2.5 Research Sources
2.5.1 Primary Research Sources
2.5.2 Secondary Research Sources
2.5.3 Assumptions
3 Market Trend Analysis
3.1 Introduction
3.2 Drivers
3.3 Restraints
3.4 Opportunities
3.5 Threats
3.6 Application Analysis
3.7 End User Analysis
3.8 Emerging Markets
3.9 Impact of Covid-19
4 Porters Five Force Analysis
4.1 Bargaining power of suppliers
4.2 Bargaining power of buyers
4.3 Threat of substitutes
4.4 Threat of new entrants
4.5 Competitive rivalry
5 Global Power Electronics Market, By Device Type
5.1 Introduction
5.2 Power Discrete
5.2.1 Transistor
5.2.1.1 Field Effect Transistor (FET)
5.2.1.2 Bipolar Junction Transistor (BJT)
5.2.1.3 Insulated Gate Bipolar Transistor (IGBT)
5.2.2 Diode
5.2.2.1 Zener Diode
5.2.2.2 Schottky Diode
5.2.2.3 Pin Diode
5.2.3 Thyristor
5.3 Power IC
5.3.1 Application-Specific IC
5.3.2 Power Management IC
5.4 Power Module
5.4.1 Intelligent Power Module (IPM)
5.4.2 Power Integrated Module (PIM)
5.4.2.1 Metal-Oxide Semiconductor Field-Effect Transistor (MOSFET) Module
5.5 AC-DC converters
5.6 DC-DC converters
5.7 AC-AC converters
5.8 DC-AC converters
5.9 Static switches
6 Global Power Electronics Market, By Material
6.1 Introduction
6.2 Silicon Carbide (SiC)
6.3 Gallium Nitride (GaN)
6.4 Silicon (Si)
6.5 Other Materials
7 Global Power Electronics Market, By Application
7.1 Introduction
7.2 Rail Traction
7.3 Renewable
7.4 Power Management
7.5 Inverter & Uninterruptible Power Supply (UPS)
7.6 Drives
7.7 Solar power
7.8 Wind power
7.9 Transportation
7.10 Other Applications
8 Global Power Electronics Market, By End User
8.1 Introduction
8.2 Aerospace and Defense
8.3 Energy and Power
8.4 Industrial
8.5 Information and Communications Technology
8.6 Automotive
8.7 Medical Devices
9 Global Power Electronics Market, By Geography
9.1 Introduction
9.2 North America
9.2.1 US
9.2.2 Canada
9.2.3 Mexico
9.3 Europe
9.3.1 Germany
9.3.2 UK
9.3.3 Italy
9.3.4 France
9.3.5 Spain
9.3.6 Rest of Europe
9.4 Asia Pacific
9.4.1 Japan
9.4.2 China
9.4.3 India
9.4.4 Australia
9.4.5 New Zealand
9.4.6 South Korea
9.4.7 Rest of Asia Pacific
9.5 South America
9.5.1 Argentina
9.5.2 Brazil
9.5.3 Chile
9.5.4 Rest of South America
9.6 Middle East & Africa
9.6.1 Saudi Arabia
9.6.2 UAE
9.6.3 Qatar
9.6.4 South Africa
9.6.5 Rest of Middle East & Africa
10 Key Developments
10.1 Agreements, Partnerships, Collaborations and Joint Ventures
10.2 Acquisitions & Mergers
10.3 New Product Launch
10.4 Expansions
10.5 Other Key Strategies
11 Company Profiling
11.1 Siemens AG
11.2 Mitsubishi Electric
11.3 Toshiba
11.4 Texas Instruments
11.5 Infineon Technologies
11.6 ABB Group
11.7 Rockwell Automation
11.8 NXP Semiconductors N.V.
11.9 STMicroelectronics N.V.
11.10 Vishay Intertechnology, Inc.
11.11 Qualcomm, Inc.
11.12 Fuji Electric Co., Ltd
11.13 Renesas Electronics Corp.
11.14 ON Semiconductor Corp.
11.15 Microchip Technology
11.16 ROHM Semiconductor
11.17 Littelfuse
11.18 Analog Devices
11.19 Hitachi
List of Tables
1 Global Power Electronics Market Outlook, By Region (2020-2028) ($MN)
2 Global Power Electronics Market Outlook, By Device Type (2020-2028) ($MN)
3 Global Power Electronics Market Outlook, By Power Discrete (2020-2028) ($MN)
4 Global Power Electronics Market Outlook, By Transistor (2020-2028) ($MN)
5 Global Power Electronics Market Outlook, By Diode (2020-2028) ($MN)
6 Global Power Electronics Market Outlook, By Thyristor (2020-2028) ($MN)
7 Global Power Electronics Market Outlook, By Power IC (2020-2028) ($MN)
8 Global Power Electronics Market Outlook, By Application-Specific IC (2020-2028) ($MN)
9 Global Power Electronics Market Outlook, By Power Management IC (2020-2028) ($MN)
10 Global Power Electronics Market Outlook, By Power Module (2020-2028) ($MN)
11 Global Power Electronics Market Outlook, By Intelligent Power Module (IPM) (2020-2028) ($MN)
12 Global Power Electronics Market Outlook, By Power Integrated Module (PIM) (2020-2028) ($MN)
13 Global Power Electronics Market Outlook, By AC-DC converters (2020-2028) ($MN)
14 Global Power Electronics Market Outlook, By DC-DC converters (2020-2028) ($MN)
15 Global Power Electronics Market Outlook, By AC-AC converters (2020-2028) ($MN)
16 Global Power Electronics Market Outlook, By DC-AC converters (2020-2028) ($MN)
17 Global Power Electronics Market Outlook, By Static switches (2020-2028) ($MN)
18 Global Power Electronics Market Outlook, By Material (2020-2028) ($MN)
19 Global Power Electronics Market Outlook, By Silicon Carbide (SiC) (2020-2028) ($MN)
20 Global Power Electronics Market Outlook, By Gallium Nitride (GaN) (2020-2028) ($MN)
21 Global Power Electronics Market Outlook, By Silicon (Si) (2020-2028) ($MN)
22 Global Power Electronics Market Outlook, By Other Materials (2020-2028) ($MN)
23 Global Power Electronics Market Outlook, By Application (2020-2028) ($MN)
24 Global Power Electronics Market Outlook, By Rail Traction (2020-2028) ($MN)
25 Global Power Electronics Market Outlook, By Renewable (2020-2028) ($MN)
26 Global Power Electronics Market Outlook, By Power Management (2020-2028) ($MN)
27 Global Power Electronics Market Outlook, By Inverter & Uninterruptible Power Supply (UPS) (2020-2028) ($MN)
28 Global Power Electronics Market Outlook, By Drives (2020-2028) ($MN)
29 Global Power Electronics Market Outlook, By Solar power (2020-2028) ($MN)
30 Global Power Electronics Market Outlook, By Wind power (2020-2028) ($MN)
31 Global Power Electronics Market Outlook, By Other Applications (2020-2028) ($MN)
32 Global Power Electronics Market Outlook, By End User (2020-2028) ($MN)
33 Global Power Electronics Market Outlook, By Aerospace and Defense (2020-2028) ($MN)
34 Global Power Electronics Market Outlook, By Energy and Power (2020-2028) ($MN)
35 Global Power Electronics Market Outlook, By Industrial (2020-2028) ($MN)
36 Global Power Electronics Market Outlook, By Information and Communications Technology (2020-2028) ($MN)
37 Global Power Electronics Market Outlook, By Automotive (2020-2028) ($MN)
38 Global Power Electronics Market Outlook, By End User (2020-2028) ($MN)
39 Global Power Electronics Market Outlook, By Aerospace and Defense (2020-2028) ($MN)
40 Global Power Electronics Market Outlook, By Energy and Power (2020-2028) ($MN)
41 Global Power Electronics Market Outlook, By Industrial (2020-2028) ($MN)
42 Global Power Electronics Market Outlook, By Information and Communications Technology (2020-2028) ($MN)
43 Global Power Electronics Market Outlook, By Automotive (2020-2028) ($MN)
44 Global Power Electronics Market Outlook, By Medical Devices (2020-2028) ($MN)
Note: Regional tables for North America, Europe, Asia Pacific, South America and Middle East & Africa are presented in similar manner as the above.
List of Figures
RESEARCH METHODOLOGY

We at ‘Stratistics’ opt for an extensive research approach which involves data mining, data validation, and data analysis. The various research sources include in-house repository, secondary research, competitor’s sources, social media research, client internal data, and primary research.
Our team of analysts prefers the most reliable and authenticated data sources in order to perform the comprehensive literature search. With access to most of the authenticated data bases our team highly considers the best mix of information through various sources to obtain extensive and accurate analysis.
Each report takes an average time of a month and a team of 4 industry analysts. The time may vary depending on the scope and data availability of the desired market report. The various parameters used in the market assessment are standardized in order to enhance the data accuracy.
Data Mining
The data is collected from several authenticated, reliable, paid and unpaid sources and is filtered depending on the scope & objective of the research. Our reports repository acts as an added advantage in this procedure. Data gathering from the raw material suppliers, distributors and the manufacturers is performed on a regular basis, this helps in the comprehensive understanding of the products value chain. Apart from the above mentioned sources the data is also collected from the industry consultants to ensure the objective of the study is in the right direction.
Market trends such as technological advancements, regulatory affairs, market dynamics (Drivers, Restraints, Opportunities and Challenges) are obtained from scientific journals, market related national & international associations and organizations.
Data Analysis
From the data that is collected depending on the scope & objective of the research the data is subjected for the analysis. The critical steps that we follow for the data analysis include:
- Product Lifecycle Analysis
- Competitor analysis
- Risk analysis
- Porters Analysis
- PESTEL Analysis
- SWOT Analysis
The data engineering is performed by the core industry experts considering both the Marketing Mix Modeling and the Demand Forecasting. The marketing mix modeling makes use of multiple-regression techniques to predict the optimal mix of marketing variables. Regression factor is based on a number of variables and how they relate to an outcome such as sales or profits.
Data Validation
The data validation is performed by the exhaustive primary research from the expert interviews. This includes telephonic interviews, focus groups, face to face interviews, and questionnaires to validate our research from all aspects. The industry experts we approach come from the leading firms, involved in the supply chain ranging from the suppliers, distributors to the manufacturers and consumers so as to ensure an unbiased analysis.
We are in touch with more than 15,000 industry experts with the right mix of consultants, CEO's, presidents, vice presidents, managers, experts from both supply side and demand side, executives and so on.
The data validation involves the primary research from the industry experts belonging to:
- Leading Companies
- Suppliers & Distributors
- Manufacturers
- Consumers
- Industry/Strategic Consultants
Apart from the data validation the primary research also helps in performing the fill gap research, i.e. providing solutions for the unmet needs of the research which helps in enhancing the reports quality.
For more details about research methodology, kindly write to us at info@strategymrc.com
Frequently Asked Questions
In case of any queries regarding this report, you can contact the customer service by filing the “Inquiry Before Buy” form available on the right hand side. You may also contact us through email: info@strategymrc.com or phone: +1-301-202-5929
Yes, the samples are available for all the published reports. You can request them by filling the “Request Sample” option available in this page.
Yes, you can request a sample with your specific requirements. All the customized samples will be provided as per the requirement with the real data masked.
All our reports are available in Digital PDF format. In case if you require them in any other formats, such as PPT, Excel etc you can submit a request through “Inquiry Before Buy” form available on the right hand side. You may also contact us through email: info@strategymrc.com or phone: +1-301-202-5929
We offer a free 15% customization with every purchase. This requirement can be fulfilled for both pre and post sale. You may send your customization requirements through email at info@strategymrc.com or call us on +1-301-202-5929.
We have 3 different licensing options available in electronic format.
- Single User Licence: Allows one person, typically the buyer, to have access to the ordered product. The ordered product cannot be distributed to anyone else.
- 2-5 User Licence: Allows the ordered product to be shared among a maximum of 5 people within your organisation.
- Corporate License: Allows the product to be shared among all employees of your organisation regardless of their geographical location.
All our reports are typically be emailed to you as an attachment.
To order any available report you need to register on our website. The payment can be made either through CCAvenue or PayPal payments gateways which accept all international cards.
We extend our support to 6 months post sale. A post sale customization is also provided to cover your unmet needs in the report.
Request Customization
We offer complimentary customization of up to 15% with every purchase. To share your customization requirements, feel free to email us at info@strategymrc.com or call us on +1-301-202-5929. .
Please Note: Customization within the 15% threshold is entirely free of charge. If your request exceeds this limit, we will conduct a feasibility assessment. Following that, a detailed quote and timeline will be provided.
WHY CHOOSE US ?

Assured Quality
Best in class reports with high standard of research integrity

24X7 Research Support
Continuous support to ensure the best customer experience.

Free Customization
Adding more values to your product of interest.

Safe & Secure Access
Providing a secured environment for all online transactions.

Trusted by 600+ Brands
Serving the most reputed brands across the world.