
Smart And Mobile Supply Chain Solutions Market
Smart and Mobile Supply Chain Solutions Market Forecasts to 2028 - Global Analysis By Solution (Warehouse Management Systems (WMS), Transportation Management Systems (TMS), Manufacturing Execution Systems (MES), Sourcing & Procurement, Supply Chain Planning (SCP) and Other Solutions), Enterprise Size (SMEs, Large Enterprises and Other Enterprise Sizes), End User (Manufacturing, Retail & Consumer Goods, Government, IT & Telecom, Energy & Utilities, Healthcare, Transportation & Logistics and Other End Users) and By Geography

|
Years Covered |
2020-2028 |
|
Estimated Year Value (2022) |
US $38.63BN |
|
Projected Year Value (2028) |
US $63.40 BN |
|
CAGR (2022 - 2028) |
8.60% |
|
Regions Covered |
North America, Europe, Asia Pacific, South America, and Middle East & Africa |
|
Countries Covered |
US, Canada, Mexico, Germany, UK, Italy, France, Spain, Japan, China, India, Australia, New Zealand, South Korea, Rest of Asia Pacific, South America, Argentina, Brazil, Chile, Middle East & Africa, Saudi Arabia, UAE, Qatar, and South Africa |
|
Largest Market |
North America |
|
Highest Growing Market |
Asia Pacific |
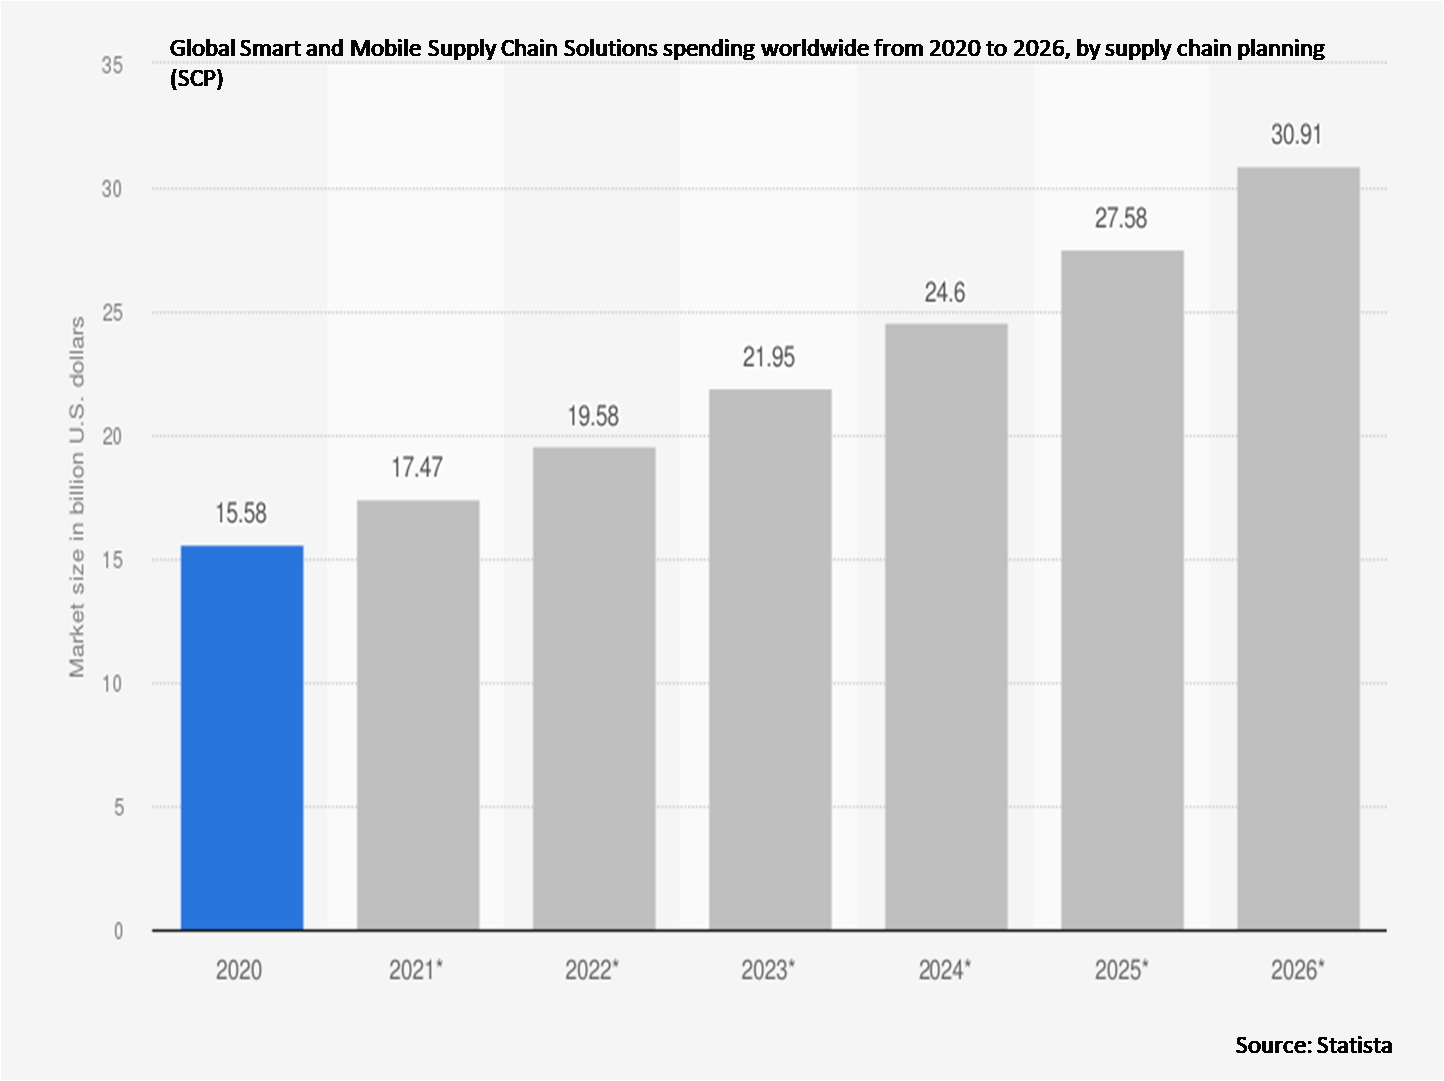
According to Stratistics MRC, the Global Smart and Mobile Supply Chain Solutions Market is accounted for $38.63 billion in 2022 and is expected to reach $63.40 billion by 2028 growing at a CAGR of 8.60% during the forecast period. Smart and mobile Supply Chain Management (SCM) solutions integrates functions such as sourcing, procurement, manufacturing, storage, transportation, material, financial flows and sales by completely managing information. It improves services to offer an enhanced customer experience and optimize operational costs. These solutions come from deviations in the manufacturing environment such as increase in price of manufacturing, shortened product lifecycles and shrinking resources of manufacturing bases. Supply chain management software with mobile integration helps organizations in vehicle inspections, deliveries, customer surveys, route planning and task management. It enables businesses to improve productivity, customer experience and automate the delivery process.
According to a study conducted by Verizon, a US-based telecommunications company and Incisiv, a US-based consumer industry insights company, the overall 5G adoption stands at about 13%, which is expected to triple by 2024.
Market Dynamics:
Driver:
Rise in integration of robotic process automation
Robotic Process Automation (RPA) generates a sequence of actions, integrates with back-end systems such as ERP and CRM, and then automatically executes the repeatable tasks. It helps to improve supply chain efficiency and reduce cost by automating processes and eliminates human errors and anomalies. It helps to streamline various processes such as email automation, vendor selection, order processing, payments, inventory management and customer service which are fuelling the market demand.
Restraint:
Cost instability
Cost instability remains a major challenge in the field of mobile supply chain solutions. The majority of supply chain executives are focused on the cost-effectiveness of the operations. Rapid changes in internal costs such as spikes in commodity prices, rapid wage inflation, sudden credit freezes, long-term implementation and revaluation of distribution strategies, load sharing, and third-party engagement are hampering the market growth.
Opportunity:
Increase in demand for industrial automation
Industrial automation is driving the demand for mobile devices and applications for supply chain management. Growth in competitiveness has prompted enterprises to manufacture high-quality products and reduce production costs. It has led to increased productivity, enhanced product quality, improved efficiency and reliability. This offers complete business visibility, optimizes inventories and synchronizes supply with demand and manufacturing.
Threat:
Low visibility of information
Lack of information transparency is the main problem in the supply chain solutions market. Even though a vast amount of information is available, the service supply providers find it difficult to record and gather the information. Despite of having better network connectivity, getting feasible information and integration are hindering the market growth.
Covid-19 Impact
The COVID-19 pandemic had a major impact on the global smart and mobile supply chain solutions market. Companies had developed technologies such as contactless delivery, mobile payment solutions and automated customer service. The widespread adoption of these technologies has passed as businesses strive to become more efficient and cost-effective. All these factors have positively as well as negatively impacted the market.
The manufacturing execution system (MES) segment is expected to be the largest during the forecast period
The manufacturing execution system (MES) segment is estimated to have a lucrative growth, due to its monitoring, tracking, documenting and controlling factors. It improves quality control and increases uptime while reducing inventory and costs. It has the ability to manage workflows and generate valuable production data. It can make operations more efficient, productive and responsive and thus drives the market demand.
The IT & telecom segment is expected to have the highest CAGR during the forecast period
The IT & telecom segment is anticipated to witness the fastest CAGR growth during the forecast period, due to its operational efficiency and raising customer demand. Telecommunication industry is growing drastically due to increase in the competitive environment for more cheap products with better quality service. Secure configurations, digital transformations, strategic cost management and sustainability are fuelling the market growth.
Region with largest share:
North America is projected to hold the largest market share during the forecast period owing to the rapid expansion of the e-commerce sectors. This region is widely adopting software that provides easy access to customer information, real-time analytics, operation monitoring and improved internal production processes due to rise in demand for logistics management services. These aspects are anticipating to the huge share in the market.
Region with highest CAGR:
Asia Pacific is projected to have the highest CAGR over the forecast period, owing to the increase in adoption of advanced technologies. Manufacturing and retail & consumer goods sectors in this region are adopting advanced GPS and RFID. This region is having the top most key players and they are strengthening their operations and driving the growth of the market significantly in this region.

Key players in the market
Some of the key players profiled in the Smart and Mobile Supply Chain Solutions Market include IBM Corporation, SAP SE, Oracle Corporation, Honeywell International Inc, Magaya Corporation, The Descartes Systems Group Inc, Dassault Systems, Blue Yonder Group Inc, Korber AG, Kewill Systems plc, GT Nexus Inc, JDA Software Group Inc, Infor Global Solutions Inc, Epicor Software Corporation, Verizon connect, Manhattan Associates Inc, WiseTech Global, Vanguard
Key Developments:
In November 2022, Honeywell launched its new operational technology (OT) cybersecurity solutions, designed to assist customers in defending the availability, reliability and safety of their industrial control systems and operations which include a new Advanced Monitoring and Incident Response (AMIR) dashboard and updated Cyber App Control.
In October 2022, Oracle announced Oracle Alloy, a new cloud infrastructure platform that enables service providers, integrators, independent software vendors (ISVs) and other organizations such as financial institutions or telecommunications providers to become cloud providers and roll out new cloud services to their customers.
Solutions Covered:
• Warehouse Management Systems (WMS)
• Transportation Management Systems (TMS)
• Manufacturing Execution Systems (MES)
• Sourcing & Procurement
• Supply Chain Planning (SCP)
• Other Solutions
Enterprise Sizes Covered:
• SMEs
• Large Enterprises
• Other Enterprise Sizes
End Users Covered:
• Manufacturing
• Retail & Consumer Goods
• Government
• IT & Telecom
• Energy & Utilities
• Healthcare
• Transportation & Logistics
• Other End Users
Regions Covered:
• North America
o US
o Canada
o Mexico
• Europe
o Germany
o UK
o Italy
o France
o Spain
o Rest of Europe
• Asia Pacific
o Japan
o China
o India
o Australia
o New Zealand
o South Korea
o Rest of Asia Pacific
• South America
o Argentina
o Brazil
o Chile
o Rest of South America
• Middle East & Africa
o Saudi Arabia
o UAE
o Qatar
o South Africa
o Rest of Middle East & Africa
What our report offers:
- Market share assessments for the regional and country-level segments
- Strategic recommendations for the new entrants
- Covers Market data for the years 2020, 2021, 2022, 2025, and 2028
- Market Trends (Drivers, Constraints, Opportunities, Threats, Challenges, Investment Opportunities, and recommendations)
- Strategic recommendations in key business segments based on the market estimations
- Competitive landscaping mapping the key common trends
- Company profiling with detailed strategies, financials, and recent developments
- Supply chain trends mapping the latest technological advancements
Free Customization Offerings:
All the customers of this report will be entitled to receive one of the following free customization options:
• Company Profiling
o Comprehensive profiling of additional market players (up to 3)
o SWOT Analysis of key players (up to 3)
• Regional Segmentation
o Market estimations, Forecasts and CAGR of any prominent country as per the client's interest (Note: Depends on feasibility check)
• Competitive Benchmarking
o Benchmarking of key players based on product portfolio, geographical presence, and strategic alliances
Table of Contents
1 Executive Summary
2 Preface
2.1 Abstract
2.2 Stake Holders
2.3 Research Scope
2.4 Research Methodology
2.4.1 Data Mining
2.4.2 Data Analysis
2.4.3 Data Validation
2.4.4 Research Approach
2.5 Research Sources
2.5.1 Primary Research Sources
2.5.2 Secondary Research Sources
2.5.3 Assumptions
3 Market Trend Analysis
3.1 Introduction
3.2 Drivers
3.3 Restraints
3.4 Opportunities
3.5 Threats
3.6 End User Analysis
3.7 Emerging Markets
3.8 Impact of Covid-19
4 Porters Five Force Analysis
4.1 Bargaining power of suppliers
4.2 Bargaining power of buyers
4.3 Threat of substitutes
4.4 Threat of new entrants
4.5 Competitive rivalry
5 Global Smart and Mobile Supply Chain Solutions Market, By Solution
5.1 Introduction
5.2 Warehouse Management Systems (WMS)
5.3 Transportation Management Systems (TMS)
5.4 Manufacturing Execution Systems (MES)
5.5 Sourcing & Procurement
5.6 Supply Chain Planning (SCP)
5.7 Other Solutions
6 Global Smart and Mobile Supply Chain Solutions Market, By Enterprise Size
6.1 Introduction
6.2 SMEs
6.3 Large Enterprises
6.4 Other Enterprise Sizes
7 Global Smart and Mobile Supply Chain Solutions Market, By End User
7.1 Introduction
7.2 Manufacturing
7.3 Retail & Consumer Goods
7.4 Government
7.5 IT & Telecom
7.6 Energy & Utilities
7.7 Healthcare
7.8 Transportation & Logistics
7.9 Other End Users
8 Global Smart and Mobile Supply Chain Solutions Market, By Geography
8.1 Introduction
8.2 North America
8.2.1 US
8.2.2 Canada
8.2.3 Mexico
8.3 Europe
8.3.1 Germany
8.3.2 UK
8.3.3 Italy
8.3.4 France
8.3.5 Spain
8.3.6 Rest of Europe
8.4 Asia Pacific
8.4.1 Japan
8.4.2 China
8.4.3 India
8.4.4 Australia
8.4.5 New Zealand
8.4.6 South Korea
8.4.7 Rest of Asia Pacific
8.5 South America
8.5.1 Argentina
8.5.2 Brazil
8.5.3 Chile
8.5.4 Rest of South America
8.6 Middle East & Africa
8.6.1 Saudi Arabia
8.6.2 UAE
8.6.3 Qatar
8.6.4 South Africa
8.6.5 Rest of Middle East & Africa
9 Key Developments
9.1 Agreements, Partnerships, Collaborations and Joint Ventures
9.2 Acquisitions & Mergers
9.3 New Product Launch
9.4 Expansions
9.5 Other Key Strategies
10 Company Profiling
10.1 IBM Corporation
10.2 SAP SE
10.3 Oracle Corporation
10.4 Honeywell International Inc
10.5 Magaya Corporation
10.6 The Descartes Systems Group Inc
10.7 Dassault Systems
10.8 Blue Yonder Group Inc
10.9 Korber AG
10.10 Kewill Systems plc
10.11 GT Nexus Inc
10.12 JDA Software Group Inc
10.13 Infor Global Solutions Inc
10.14 Epicor Software Corporation
10.15 Verizon connect
10.16 Manhattan Associates Inc
10.17 WiseTech Global
10.18 Vanguard
List of Tables
1 Global Smart and Mobile Supply Chain Solutions Market Outlook, By Region (2020-2028) ($MN)
2 Global Smart and Mobile Supply Chain Solutions Market Outlook, By Solution (2020-2028) ($MN)
3 Global Smart and Mobile Supply Chain Solutions Market Outlook, By Warehouse Management Systems (WMS) (2020-2028) ($MN)
4 Global Smart and Mobile Supply Chain Solutions Market Outlook, By Transportation Management Systems (TMS) (2020-2028) ($MN)
5 Global Smart and Mobile Supply Chain Solutions Market Outlook, By Manufacturing Execution Systems (MES) (2020-2028) ($MN)
6 Global Smart and Mobile Supply Chain Solutions Market Outlook, By Sourcing & Procurement (2020-2028) ($MN)
7 Global Smart and Mobile Supply Chain Solutions Market Outlook, By Supply Chain Planning (SCP) (2020-2028) ($MN)
8 Global Smart and Mobile Supply Chain Solutions Market Outlook, By Other Solutions (2020-2028) ($MN)
9 Global Smart and Mobile Supply Chain Solutions Market Outlook, By Enterprise Size (2020-2028) ($MN)
10 Global Smart and Mobile Supply Chain Solutions Market Outlook, By SMEs (2020-2028) ($MN)
11 Global Smart and Mobile Supply Chain Solutions Market Outlook, By Large Enterprises (2020-2028) ($MN)
12 Global Smart and Mobile Supply Chain Solutions Market Outlook, By Other Enterprise Sizes (2020-2028) ($MN)
13 Global Smart and Mobile Supply Chain Solutions Market Outlook, By End User (2020-2028) ($MN)
14 Global Smart and Mobile Supply Chain Solutions Market Outlook, By Manufacturing (2020-2028) ($MN)
15 Global Smart and Mobile Supply Chain Solutions Market Outlook, By Retail & Consumer Goods (2020-2028) ($MN)
16 Global Smart and Mobile Supply Chain Solutions Market Outlook, By Government (2020-2028) ($MN)
17 Global Smart and Mobile Supply Chain Solutions Market Outlook, By IT & Telecom (2020-2028) ($MN)
18 Global Smart and Mobile Supply Chain Solutions Market Outlook, By Energy & Utilities (2020-2028) ($MN)
19 Global Smart and Mobile Supply Chain Solutions Market Outlook, By Healthcare (2020-2028) ($MN)
20 Global Smart and Mobile Supply Chain Solutions Market Outlook, By Transportation & Logistics (2020-2028) ($MN)
21 Global Smart and Mobile Supply Chain Solutions Market Outlook, By Other End Users (2020-2028) ($MN)
22 North America Smart and Mobile Supply Chain Solutions Market Outlook, By Country (2020-2028) ($MN)
23 North America Smart and Mobile Supply Chain Solutions Market Outlook, By Solution (2020-2028) ($MN)
24 North America Smart and Mobile Supply Chain Solutions Market Outlook, By Warehouse Management Systems (WMS) (2020-2028) ($MN)
25 North America Smart and Mobile Supply Chain Solutions Market Outlook, By Transportation Management Systems (TMS) (2020-2028) ($MN)
26 North America Smart and Mobile Supply Chain Solutions Market Outlook, By Manufacturing Execution Systems (MES) (2020-2028) ($MN)
27 North America Smart and Mobile Supply Chain Solutions Market Outlook, By Sourcing & Procurement (2020-2028) ($MN)
28 North America Smart and Mobile Supply Chain Solutions Market Outlook, By Supply Chain Planning (SCP) (2020-2028) ($MN)
29 North America Smart and Mobile Supply Chain Solutions Market Outlook, By Other Solutions (2020-2028) ($MN)
30 North America Smart and Mobile Supply Chain Solutions Market Outlook, By Enterprise Size (2020-2028) ($MN)
31 North America Smart and Mobile Supply Chain Solutions Market Outlook, By SMEs (2020-2028) ($MN)
32 North America Smart and Mobile Supply Chain Solutions Market Outlook, By Large Enterprises (2020-2028) ($MN)
33 North America Smart and Mobile Supply Chain Solutions Market Outlook, By Other Enterprise Sizes (2020-2028) ($MN)
34 North America Smart and Mobile Supply Chain Solutions Market Outlook, By End User (2020-2028) ($MN)
35 North America Smart and Mobile Supply Chain Solutions Market Outlook, By Manufacturing (2020-2028) ($MN)
36 North America Smart and Mobile Supply Chain Solutions Market Outlook, By Retail & Consumer Goods (2020-2028) ($MN)
37 North America Smart and Mobile Supply Chain Solutions Market Outlook, By Government (2020-2028) ($MN)
38 North America Smart and Mobile Supply Chain Solutions Market Outlook, By IT & Telecom (2020-2028) ($MN)
39 North America Smart and Mobile Supply Chain Solutions Market Outlook, By Energy & Utilities (2020-2028) ($MN)
40 North America Smart and Mobile Supply Chain Solutions Market Outlook, By Healthcare (2020-2028) ($MN)
41 North America Smart and Mobile Supply Chain Solutions Market Outlook, By Transportation & Logistics (2020-2028) ($MN)
42 North America Smart and Mobile Supply Chain Solutions Market Outlook, By Other End Users (2020-2028) ($MN)
43 Europe Smart and Mobile Supply Chain Solutions Market Outlook, By Country (2020-2028) ($MN)
44 Europe Smart and Mobile Supply Chain Solutions Market Outlook, By Solution (2020-2028) ($MN)
45 Europe Smart and Mobile Supply Chain Solutions Market Outlook, By Warehouse Management Systems (WMS) (2020-2028) ($MN)
46 Europe Smart and Mobile Supply Chain Solutions Market Outlook, By Transportation Management Systems (TMS) (2020-2028) ($MN)
47 Europe Smart and Mobile Supply Chain Solutions Market Outlook, By Manufacturing Execution Systems (MES) (2020-2028) ($MN)
48 Europe Smart and Mobile Supply Chain Solutions Market Outlook, By Sourcing & Procurement (2020-2028) ($MN)
49 Europe Smart and Mobile Supply Chain Solutions Market Outlook, By Supply Chain Planning (SCP) (2020-2028) ($MN)
50 Europe Smart and Mobile Supply Chain Solutions Market Outlook, By Other Solutions (2020-2028) ($MN)
51 Europe Smart and Mobile Supply Chain Solutions Market Outlook, By Enterprise Size (2020-2028) ($MN)
52 Europe Smart and Mobile Supply Chain Solutions Market Outlook, By SMEs (2020-2028) ($MN)
53 Europe Smart and Mobile Supply Chain Solutions Market Outlook, By Large Enterprises (2020-2028) ($MN)
54 Europe Smart and Mobile Supply Chain Solutions Market Outlook, By Other Enterprise Sizes (2020-2028) ($MN)
55 Europe Smart and Mobile Supply Chain Solutions Market Outlook, By End User (2020-2028) ($MN)
56 Europe Smart and Mobile Supply Chain Solutions Market Outlook, By Manufacturing (2020-2028) ($MN)
57 Europe Smart and Mobile Supply Chain Solutions Market Outlook, By Retail & Consumer Goods (2020-2028) ($MN)
58 Europe Smart and Mobile Supply Chain Solutions Market Outlook, By Government (2020-2028) ($MN)
59 Europe Smart and Mobile Supply Chain Solutions Market Outlook, By IT & Telecom (2020-2028) ($MN)
60 Europe Smart and Mobile Supply Chain Solutions Market Outlook, By Energy & Utilities (2020-2028) ($MN)
61 Europe Smart and Mobile Supply Chain Solutions Market Outlook, By Healthcare (2020-2028) ($MN)
62 Europe Smart and Mobile Supply Chain Solutions Market Outlook, By Transportation & Logistics (2020-2028) ($MN)
63 Europe Smart and Mobile Supply Chain Solutions Market Outlook, By Other End Users (2020-2028) ($MN)
64 Asia Pacific Smart and Mobile Supply Chain Solutions Market Outlook, By Country (2020-2028) ($MN)
65 Asia Pacific Smart and Mobile Supply Chain Solutions Market Outlook, By Solution (2020-2028) ($MN)
66 Asia Pacific Smart and Mobile Supply Chain Solutions Market Outlook, By Warehouse Management Systems (WMS) (2020-2028) ($MN)
67 Asia Pacific Smart and Mobile Supply Chain Solutions Market Outlook, By Transportation Management Systems (TMS) (2020-2028) ($MN)
68 Asia Pacific Smart and Mobile Supply Chain Solutions Market Outlook, By Manufacturing Execution Systems (MES) (2020-2028) ($MN)
69 Asia Pacific Smart and Mobile Supply Chain Solutions Market Outlook, By Sourcing & Procurement (2020-2028) ($MN)
70 Asia Pacific Smart and Mobile Supply Chain Solutions Market Outlook, By Supply Chain Planning (SCP) (2020-2028) ($MN)
71 Asia Pacific Smart and Mobile Supply Chain Solutions Market Outlook, By Other Solutions (2020-2028) ($MN)
72 Asia Pacific Smart and Mobile Supply Chain Solutions Market Outlook, By Enterprise Size (2020-2028) ($MN)
73 Asia Pacific Smart and Mobile Supply Chain Solutions Market Outlook, By SMEs (2020-2028) ($MN)
74 Asia Pacific Smart and Mobile Supply Chain Solutions Market Outlook, By Large Enterprises (2020-2028) ($MN)
75 Asia Pacific Smart and Mobile Supply Chain Solutions Market Outlook, By Other Enterprise Sizes (2020-2028) ($MN)
76 Asia Pacific Smart and Mobile Supply Chain Solutions Market Outlook, By End User (2020-2028) ($MN)
77 Asia Pacific Smart and Mobile Supply Chain Solutions Market Outlook, By Manufacturing (2020-2028) ($MN)
78 Asia Pacific Smart and Mobile Supply Chain Solutions Market Outlook, By Retail & Consumer Goods (2020-2028) ($MN)
79 Asia Pacific Smart and Mobile Supply Chain Solutions Market Outlook, By Government (2020-2028) ($MN)
80 Asia Pacific Smart and Mobile Supply Chain Solutions Market Outlook, By IT & Telecom (2020-2028) ($MN)
81 Asia Pacific Smart and Mobile Supply Chain Solutions Market Outlook, By Energy & Utilities (2020-2028) ($MN)
82 Asia Pacific Smart and Mobile Supply Chain Solutions Market Outlook, By Healthcare (2020-2028) ($MN)
83 Asia Pacific Smart and Mobile Supply Chain Solutions Market Outlook, By Transportation & Logistics (2020-2028) ($MN)
84 Asia Pacific Smart and Mobile Supply Chain Solutions Market Outlook, By Other End Users (2020-2028) ($MN)
85 South America Smart and Mobile Supply Chain Solutions Market Outlook, By Country (2020-2028) ($MN)
86 South America Smart and Mobile Supply Chain Solutions Market Outlook, By Solution (2020-2028) ($MN)
87 South America Smart and Mobile Supply Chain Solutions Market Outlook, By Warehouse Management Systems (WMS) (2020-2028) ($MN)
88 South America Smart and Mobile Supply Chain Solutions Market Outlook, By Transportation Management Systems (TMS) (2020-2028) ($MN)
89 South America Smart and Mobile Supply Chain Solutions Market Outlook, By Manufacturing Execution Systems (MES) (2020-2028) ($MN)
90 South America Smart and Mobile Supply Chain Solutions Market Outlook, By Sourcing & Procurement (2020-2028) ($MN)
91 South America Smart and Mobile Supply Chain Solutions Market Outlook, By Supply Chain Planning (SCP) (2020-2028) ($MN)
92 South America Smart and Mobile Supply Chain Solutions Market Outlook, By Other Solutions (2020-2028) ($MN)
93 South America Smart and Mobile Supply Chain Solutions Market Outlook, By Enterprise Size (2020-2028) ($MN)
94 South America Smart and Mobile Supply Chain Solutions Market Outlook, By SMEs (2020-2028) ($MN)
95 South America Smart and Mobile Supply Chain Solutions Market Outlook, By Large Enterprises (2020-2028) ($MN)
96 South America Smart and Mobile Supply Chain Solutions Market Outlook, By Other Enterprise Sizes (2020-2028) ($MN)
97 South America Smart and Mobile Supply Chain Solutions Market Outlook, By End User (2020-2028) ($MN)
98 South America Smart and Mobile Supply Chain Solutions Market Outlook, By Manufacturing (2020-2028) ($MN)
99 South America Smart and Mobile Supply Chain Solutions Market Outlook, By Retail & Consumer Goods (2020-2028) ($MN)
100 South America Smart and Mobile Supply Chain Solutions Market Outlook, By Government (2020-2028) ($MN)
101 South America Smart and Mobile Supply Chain Solutions Market Outlook, By IT & Telecom (2020-2028) ($MN)
102 South America Smart and Mobile Supply Chain Solutions Market Outlook, By Energy & Utilities (2020-2028) ($MN)
103 South America Smart and Mobile Supply Chain Solutions Market Outlook, By Healthcare (2020-2028) ($MN)
104 South America Smart and Mobile Supply Chain Solutions Market Outlook, By Transportation & Logistics (2020-2028) ($MN)
105 South America Smart and Mobile Supply Chain Solutions Market Outlook, By Other End Users (2020-2028) ($MN)
106 Middle East & Africa Smart and Mobile Supply Chain Solutions Market Outlook, By Country (2020-2028) ($MN)
107 Middle East & Africa Smart and Mobile Supply Chain Solutions Market Outlook, By Solution (2020-2028) ($MN)
108 Middle East & Africa Smart and Mobile Supply Chain Solutions Market Outlook, By Warehouse Management Systems (WMS) (2020-2028) ($MN)
109 Middle East & Africa Smart and Mobile Supply Chain Solutions Market Outlook, By Transportation Management Systems (TMS) (2020-2028) ($MN)
110 Middle East & Africa Smart and Mobile Supply Chain Solutions Market Outlook, By Manufacturing Execution Systems (MES) (2020-2028) ($MN)
111 Middle East & Africa Smart and Mobile Supply Chain Solutions Market Outlook, By Sourcing & Procurement (2020-2028) ($MN)
112 Middle East & Africa Smart and Mobile Supply Chain Solutions Market Outlook, By Supply Chain Planning (SCP) (2020-2028) ($MN)
113 Middle East & Africa Smart and Mobile Supply Chain Solutions Market Outlook, By Other Solutions (2020-2028) ($MN)
114 Middle East & Africa Smart and Mobile Supply Chain Solutions Market Outlook, By Enterprise Size (2020-2028) ($MN)
115 Middle East & Africa Smart and Mobile Supply Chain Solutions Market Outlook, By SMEs (2020-2028) ($MN)
116 Middle East & Africa Smart and Mobile Supply Chain Solutions Market Outlook, By Large Enterprises (2020-2028) ($MN)
117 Middle East & Africa Smart and Mobile Supply Chain Solutions Market Outlook, By Other Enterprise Sizes (2020-2028) ($MN)
118 Middle East & Africa Smart and Mobile Supply Chain Solutions Market Outlook, By End User (2020-2028) ($MN)
119 Middle East & Africa Smart and Mobile Supply Chain Solutions Market Outlook, By Manufacturing (2020-2028) ($MN)
120 Middle East & Africa Smart and Mobile Supply Chain Solutions Market Outlook, By Retail & Consumer Goods (2020-2028) ($MN)
121 Middle East & Africa Smart and Mobile Supply Chain Solutions Market Outlook, By Government (2020-2028) ($MN)
122 Middle East & Africa Smart and Mobile Supply Chain Solutions Market Outlook, By IT & Telecom (2020-2028) ($MN)
123 Middle East & Africa Smart and Mobile Supply Chain Solutions Market Outlook, By Energy & Utilities (2020-2028) ($MN)
124 Middle East & Africa Smart and Mobile Supply Chain Solutions Market Outlook, By Healthcare (2020-2028) ($MN)
125 Middle East & Africa Smart and Mobile Supply Chain Solutions Market Outlook, By Transportation & Logistics (2020-2028) ($MN)
126 Middle East & Africa Smart and Mobile Supply Chain Solutions Market Outlook, By Other End Users (2020-2028) ($MN)
List of Figures
RESEARCH METHODOLOGY

We at ‘Stratistics’ opt for an extensive research approach which involves data mining, data validation, and data analysis. The various research sources include in-house repository, secondary research, competitor’s sources, social media research, client internal data, and primary research.
Our team of analysts prefers the most reliable and authenticated data sources in order to perform the comprehensive literature search. With access to most of the authenticated data bases our team highly considers the best mix of information through various sources to obtain extensive and accurate analysis.
Each report takes an average time of a month and a team of 4 industry analysts. The time may vary depending on the scope and data availability of the desired market report. The various parameters used in the market assessment are standardized in order to enhance the data accuracy.
Data Mining
The data is collected from several authenticated, reliable, paid and unpaid sources and is filtered depending on the scope & objective of the research. Our reports repository acts as an added advantage in this procedure. Data gathering from the raw material suppliers, distributors and the manufacturers is performed on a regular basis, this helps in the comprehensive understanding of the products value chain. Apart from the above mentioned sources the data is also collected from the industry consultants to ensure the objective of the study is in the right direction.
Market trends such as technological advancements, regulatory affairs, market dynamics (Drivers, Restraints, Opportunities and Challenges) are obtained from scientific journals, market related national & international associations and organizations.
Data Analysis
From the data that is collected depending on the scope & objective of the research the data is subjected for the analysis. The critical steps that we follow for the data analysis include:
- Product Lifecycle Analysis
- Competitor analysis
- Risk analysis
- Porters Analysis
- PESTEL Analysis
- SWOT Analysis
The data engineering is performed by the core industry experts considering both the Marketing Mix Modeling and the Demand Forecasting. The marketing mix modeling makes use of multiple-regression techniques to predict the optimal mix of marketing variables. Regression factor is based on a number of variables and how they relate to an outcome such as sales or profits.
Data Validation
The data validation is performed by the exhaustive primary research from the expert interviews. This includes telephonic interviews, focus groups, face to face interviews, and questionnaires to validate our research from all aspects. The industry experts we approach come from the leading firms, involved in the supply chain ranging from the suppliers, distributors to the manufacturers and consumers so as to ensure an unbiased analysis.
We are in touch with more than 15,000 industry experts with the right mix of consultants, CEO's, presidents, vice presidents, managers, experts from both supply side and demand side, executives and so on.
The data validation involves the primary research from the industry experts belonging to:
- Leading Companies
- Suppliers & Distributors
- Manufacturers
- Consumers
- Industry/Strategic Consultants
Apart from the data validation the primary research also helps in performing the fill gap research, i.e. providing solutions for the unmet needs of the research which helps in enhancing the reports quality.
For more details about research methodology, kindly write to us at info@strategymrc.com
Frequently Asked Questions
In case of any queries regarding this report, you can contact the customer service by filing the “Inquiry Before Buy” form available on the right hand side. You may also contact us through email: info@strategymrc.com or phone: +1-301-202-5929
Yes, the samples are available for all the published reports. You can request them by filling the “Request Sample” option available in this page.
Yes, you can request a sample with your specific requirements. All the customized samples will be provided as per the requirement with the real data masked.
All our reports are available in Digital PDF format. In case if you require them in any other formats, such as PPT, Excel etc you can submit a request through “Inquiry Before Buy” form available on the right hand side. You may also contact us through email: info@strategymrc.com or phone: +1-301-202-5929
We offer a free 15% customization with every purchase. This requirement can be fulfilled for both pre and post sale. You may send your customization requirements through email at info@strategymrc.com or call us on +1-301-202-5929.
We have 3 different licensing options available in electronic format.
- Single User Licence: Allows one person, typically the buyer, to have access to the ordered product. The ordered product cannot be distributed to anyone else.
- 2-5 User Licence: Allows the ordered product to be shared among a maximum of 5 people within your organisation.
- Corporate License: Allows the product to be shared among all employees of your organisation regardless of their geographical location.
All our reports are typically be emailed to you as an attachment.
To order any available report you need to register on our website. The payment can be made either through CCAvenue or PayPal payments gateways which accept all international cards.
We extend our support to 6 months post sale. A post sale customization is also provided to cover your unmet needs in the report.
Request Customization
We offer complimentary customization of up to 15% with every purchase. To share your customization requirements, feel free to email us at info@strategymrc.com or call us on +1-301-202-5929. .
Please Note: Customization within the 15% threshold is entirely free of charge. If your request exceeds this limit, we will conduct a feasibility assessment. Following that, a detailed quote and timeline will be provided.
WHY CHOOSE US ?

Assured Quality
Best in class reports with high standard of research integrity

24X7 Research Support
Continuous support to ensure the best customer experience.

Free Customization
Adding more values to your product of interest.

Safe & Secure Access
Providing a secured environment for all online transactions.

Trusted by 600+ Brands
Serving the most reputed brands across the world.