
Solar Generator Market
Solar Generator Market Forecasts to 2028 - Global Analysis By Product (40-80 KWH, Below 40KWH, 80-150 KWH, Over 150 KWH), Power Rating (More than 500 W, Up to 500 W), Battery Type (Lithium-ion, Lead-acid), Grid Connectivity (On - Grid, Off - Grid), Application and By Geography

|
Years Covered |
2020-2028 |
|
Estimated Year Value (2022) |
US $523.38 MN |
|
Projected Year Value (2028) |
US $900.7 MN |
|
CAGR (2022 - 2028) |
9.47% |
|
Regions Covered |
North America, Europe, Asiap Pacific, South America, and Middle East & Africa |
|
Countries Covered |
US, Canada, Mexico, Germany, UK, Italy, France, Spain, Japan, China, India, Australia, New Zealand, South Korea, Rest of Asia Pacific, South America, Argentina, Brazil, Chile, Middle East & Africa, Saudi Arabia, UAE, Qatar, and South Africa |
|
Largest Market |
North America |
|
Fastest Growing Market |
Asia Pacific |
According to Stratistics MRC, the Global Solar Generator Market is accounted for $523.38 million in 2022 and is expected to reach $900.7 million by 2028 growing at a CAGR of 9.47% during the forecast period. A solar generator exchanges solar energy into electrical energy. The solar panels are used in a solar generator, which also includes an inverter, solar panel battery, and battery charger. The solar generator captures solar energy and stores it in the battery of the generator. Before the power is output, the inverters remove energy by converting the current from DC power to AC power. Photovoltaics are mostly utilised in solar generators to generate electricity for minor and everyday uses. These generators power the homes without releasing any gases or harmful fumes.
According to Enerdata, China’s electricity demand was increased by 4.5% in 2019 compared to 2018. To meet the growing demand most of the countries are installing new solar plants or enhancing the capacity of the existing ones. This is expected to drive the solar power market growth during the forecast period.
Market Dynamics:
Driver:
Increased developed technologies and new innovative features
The market is expanding as a result of newly developed technology and unique solar generator characteristics. Solar panels installed on roofs or in the ground are used by photovoltaic cells to convert sunlight into electrical energy. Concentrated solar power, also known as concentrated solar thermal, uses energy to create steam before being renovated by a turbine into electricity. Solar generators don't produce any gases, fumes, or scents, thus they are pollution-free, but the creation of solar panels does. Rapid urbanization and development in developing nations with rising populations has led to the creation of solar generators in a variety of sizes and types to meet growing market demand and customer demand.
Restraint:
Several unfavorable factors
The expansion of the worldwide solar generator market is significantly constrained by a number of unfavourable factors. These solar generators are more expensive up front, have a restricted power source, and recharge slowly. Additionally, because of their dependence on the temperature, abrupt changes in the climate might impair their functionality.
Opportunity:
Increased advancements and consumer needs
The market for solar generators has expanded to a greater level as a result of increased advancements, the production of more types of solar generators, and rising consumer and market demands. The market has grown significantly due to the expansion in underdeveloped areas, the development of solar generators, and the increase in installations and product varieties.
Threat:
High cost and effectiveness during seasons
The largest obstacle to accelerating market growth during the predicted period is the rising cost of solar generators. The effectiveness of solar systems is not the same on cloudy or rainy days as it is during the summer season, which is another important factor in the market's growth. Summertime efficiency is higher due to sunlight. Less room may hinder the use of solar generators and slow industry expansion.
Covid-19 Impact
Impact of COVID-19 along with government-imposed restrictions and the nation's lockdown resulted in a decline in market growth due to a lack of supply and halted transit. However, once the pandemic situation had stabilised, the demand for solar generators had increased. During the projection period, market participants who are engaged in the production, manufacturing, and installation of solar generators will have a significant impact on market growth and revenue share.
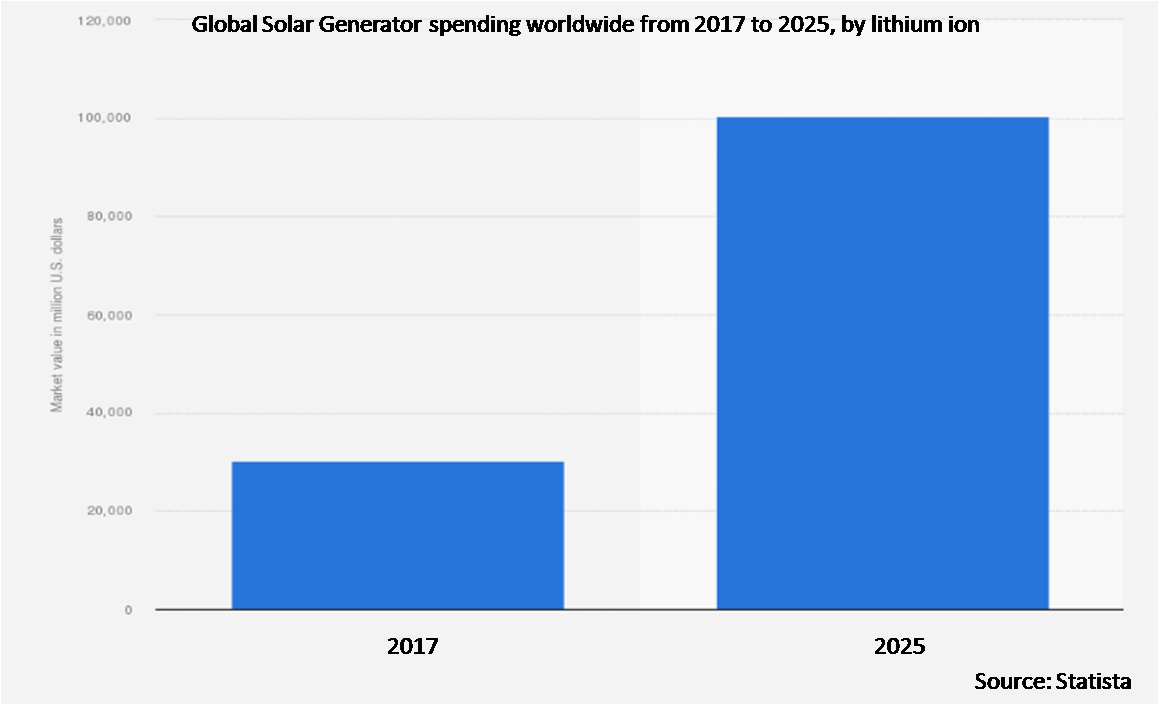
The lithium ion segment is expected to be the largest during the forecast period
The lithium ion segment is estimated to have a lucrative growth, due to which is used in solar generators, which provide power for the generators, has contributed most to the demand growth during the forecast period. In solar generators, lithium ion batteries are frequently employed to store energy for later use. While more expensive than lead acid batteries, lithium ion batteries have the advantage of charging more quickly.
The residential segment is expected to have the highest CAGR during the forecast period
The residential segment is anticipated to witness the fastest CAGR growth during the forecast period, due to the world's rapidly growing population, an increase in building and construction activities, rising global demand for uninterrupted electricity, and rising consumer awareness of climatic concerns and the benefits of renewable energy, the residential sector currently represents the largest end user segment.
Region with highest share:
North America is projected to hold the largest market share during the forecast period owing to growing government initiatives to install solar panels additional reasonably priced. Due to the rising demand for a consistent and clean power source, technological advancements, the availability of many types of advanced solar generator systems, and the expanding use of solar generators throughout the region, North America is predicted to. Additionally, rising R&D expenditures to create goods with improved battery power and quick recharging are anticipated to drive market expansion in North America in the future.
Region with highest CAGR:
Asia Pacific is projected to have the highest CAGR over the forecast period, owing to the region's rapidly growing population, rising construction and building activities, rising adoption of solar generator systems as a result of rising public awareness of renewable energy, and rising investments in the development of improved solar generators, the Asia Pacific solar generator market revenue is anticipated to grow at a rapid CAGR throughout the forecast period.

Key players in the market
Some of the key players profiled in the Solar Generator Market include Duracell, SolarRover, Silicon CPV, Voltaic, Solar line, Hollandia, JackeryInc., Biolite Powerenz, Goal Zero, Carnegie Clean Energy, Sol Systems, Altern Limited, Sunvis Solar, Intech Clean Energy, Ameresco, REDAVIA, Off-Grid Europe, Intech Clean Energy.
Key Developments:
In July 2021, Goal zero introduces ranger series, he ranger 300. The lights in weigh rigid solar panels harness high power from the sun. Maintenance of high portability and transportation easy from one place to another place. The ranger 300 briefcase pairs perfect with Yeti 1000X power and larger for high use of solar power.
In July 2021, Sol Systems, a leading renewable energy generating firm based in United States, partnered with KKR to scale Sol Systems’ infrastructural approach and renewable energy to cater to rising sustainability needs in the US.
In March 2021, Jackery Inc. launched a new product, Jackery Solar Generator 2000, equipped with efficient solar charging technology and waterproof, portable solar panels.
In May 2019, voltaic power introduced new contains solar laptop charging kit that is Arc 20W solar laptop charger kit.
Products Covered:
• 40-80 KWH
• Below 40KWH
• 80-150 KWH
• Over 150 KWH
Power Ratings Covered:
• More than 500 W
• Up to 500 W
Battery Types Covered:
• Lithium-ion
• Lead-acid
Grid Connectivity’s Covered:
• On - Grid
• Off - Grid
Applications Covered:
• Academics
• Electrical Industry
• Commercial
• Oil and Gas Industry
• Government
• Residential
Regions Covered:
• North America
o US
o Canada
o Mexico
• Europe
o Germany
o UK
o Italy
o France
o Spain
o Rest of Europe
• Asia Pacific
o Japan
o China
o India
o Australia
o New Zealand
o South Korea
o Rest of Asia Pacific
• South America
o Argentina
o Brazil
o Chile
o Rest of South America
• Middle East & Africa
o Saudi Arabia
o UAE
o Qatar
o South Africa
o Rest of the Middle East & Africa
What our report offers:
- Market share assessments for the regional and country-level segments
- Strategic recommendations for the new entrants
- Covers Market data for the years 2020, 2021, 2022, 2025, and 2028
- Market Trends (Drivers, Constraints, Opportunities, Threats, Challenges, Investment Opportunities, and recommendations)
- Strategic recommendations in key business segments based on the market estimations
- Competitive landscaping mapping the key common trends
- Company profiling with detailed strategies, financials, and recent developments
- Supply chain trends mapping the latest technological advancements
Free Customization Offerings:
All the customers of this report will be entitled to receive one of the following free customization options:
• Company Profiling
o Comprehensive profiling of additional market players (up to 3)
o SWOT Analysis of key players (up to 3)
• Regional Segmentation
o Market estimations, Forecasts and CAGR of any prominent country as per the client's interest (Note: Depends on feasibility check)
• Competitive Benchmarking
o Benchmarking of key players based on product portfolio, geographical presence, and strategic alliances
Table of Contents
1 Executive Summary
2 Preface
2.1 Abstract
2.2 Stake Holders
2.3 Research Scope
2.4 Research Methodology
2.4.1 Data Mining
2.4.2 Data Analysis
2.4.3 Data Validation
2.4.4 Research Approach
2.5 Research Sources
2.5.1 Primary Research Sources
2.5.2 Secondary Research Sources
2.5.3 Assumptions
3 Market Trend Analysis
3.1 Introduction
3.2 Drivers
3.3 Restraints
3.4 Opportunities
3.5 Threats
3.6 Product Analysis
3.7 Application Analysis
3.8 Emerging Markets
3.9 Impact of Covid-19
4 Porters Five Force Analysis
4.1 Bargaining power of suppliers
4.2 Bargaining power of buyers
4.3 Threat of substitutes
4.4 Threat of new entrants
4.5 Competitive rivalry
5 Global Solar Generator Market, By Product
5.1 Introduction
5.2 40-80 KWH
5.3 Below 40KWH
5.4 80-150 KWH
5.5 Over 150 KWH
6 Global Solar Generator Market, By Power Rating
6.1 Introduction
6.2 More than 500 W
6.3 Up to 500 W
7 Global Solar Generator Market, By Battery Type
7.1 Introduction
7.2 Lithium-ion
7.3 Lead-acid
8 Global Solar Generator Market, By Grid Connectivity
8.1 Introduction
8.2 On - Grid
8.3 Off - Grid
9 Global Solar Generator Market, By Application
9.1 Introduction
9.2 Academics
9.3 Electrical Industry
9.4 Commercial
9.5 Oil and Gas Industry
9.6 Government
9.7 Residential
10 Global Solar Generator Market, By Geography
10.1 Introduction
10.2 North America
10.2.1 US
10.2.2 Canada
10.2.3 Mexico
10.3 Europe
10.3.1 Germany
10.3.2 UK
10.3.3 Italy
10.3.4 France
10.3.5 Spain
10.3.6 Rest of Europe
10.4 Asia Pacific
10.4.1 Japan
10.4.2 China
10.4.3 India
10.4.4 Australia
10.4.5 New Zealand
10.4.6 South Korea
10.4.7 Rest of Asia Pacific
10.5 South America
10.5.1 Argentina
10.5.2 Brazil
10.5.3 Chile
10.5.4 Rest of South America
10.6 Middle East & Africa
10.6.1 Saudi Arabia
10.6.2 UAE
10.6.3 Qatar
10.6.4 South Africa
10.6.5 Rest of Middle East & Africa
11 Key Developments
11.1 Agreements, Partnerships, Collaborations and Joint Ventures
11.2 Acquisitions & Mergers
11.3 New Product Launch
11.4 Expansions
11.5 Other Key Strategies
12 Company Profiling
12.1 Duracell
12.2 SolarRover
12.3 Silicon CPV
12.4 Voltaic
12.5 Solar line
12.6 Hollandia
12.7 JackeryInc.
12.8 Biolite Powerenz
12.9 Goal Zero
12.10 Carnegie Clean Energy
12.11 Sol Systems
12.12 Altern Limited
12.13 Sunvis Solar
12.14 Intech Clean Energy
12.15 Ameresco
12.16 REDAVIA
12.17 Off-Grid Europe
12.18 Intech Clean Energy
List of Tables
1 Global Solar Generator Market Outlook, By Region (2020-2028) ($MN)
2 Global Solar Generator Market Outlook, By Product (2020-2028) ($MN)
3 Global Solar Generator Market Outlook, By 40-80 KWH (2020-2028) ($MN)
4 Global Solar Generator Market Outlook, By Below 40KWH (2020-2028) ($MN)
5 Global Solar Generator Market Outlook, By 80-150 KWH (2020-2028) ($MN)
6 Global Solar Generator Market Outlook, By Over 150 KWH (2020-2028) ($MN)
7 Global Solar Generator Market Outlook, By Power Rating (2020-2028) ($MN)
8 Global Solar Generator Market Outlook, By More than 500 W (2020-2028) ($MN)
9 Global Solar Generator Market Outlook, By Up to 500 W (2020-2028) ($MN)
10 Global Solar Generator Market Outlook, By Battery Type (2020-2028) ($MN)
11 Global Solar Generator Market Outlook, By Lithium-ion (2020-2028) ($MN)
12 Global Solar Generator Market Outlook, By Lead-acid (2020-2028) ($MN)
13 Global Solar Generator Market Outlook, By Grid Connectivity (2020-2028) ($MN)
14 Global Solar Generator Market Outlook, By On - Grid (2020-2028) ($MN)
15 Global Solar Generator Market Outlook, By Off - Grid (2020-2028) ($MN)
16 Global Solar Generator Market Outlook, By Application (2020-2028) ($MN)
17 Global Solar Generator Market Outlook, By Academics (2020-2028) ($MN)
18 Global Solar Generator Market Outlook, By Electrical Industry (2020-2028) ($MN)
19 Global Solar Generator Market Outlook, By Commercial (2020-2028) ($MN)
20 Global Solar Generator Market Outlook, By Oil and Gas Industry (2020-2028) ($MN)
21 Global Solar Generator Market Outlook, By Government (2020-2028) ($MN)
22 Global Solar Generator Market Outlook, By Residential (2020-2028) ($MN)
23 North America Solar Generator Market Outlook, By Country (2020-2028) ($MN)
24 North America Solar Generator Market Outlook, By Product (2020-2028) ($MN)
25 North America Solar Generator Market Outlook, By 40-80 KWH (2020-2028) ($MN)
26 North America Solar Generator Market Outlook, By Below 40KWH (2020-2028) ($MN)
27 North America Solar Generator Market Outlook, By 80-150 KWH (2020-2028) ($MN)
28 North America Solar Generator Market Outlook, By Over 150 KWH (2020-2028) ($MN)
29 North America Solar Generator Market Outlook, By Power Rating (2020-2028) ($MN)
30 North America Solar Generator Market Outlook, By More than 500 W (2020-2028) ($MN)
31 North America Solar Generator Market Outlook, By Up to 500 W (2020-2028) ($MN)
32 North America Solar Generator Market Outlook, By Battery Type (2020-2028) ($MN)
33 North America Solar Generator Market Outlook, By Lithium-ion (2020-2028) ($MN)
34 North America Solar Generator Market Outlook, By Lead-acid (2020-2028) ($MN)
35 North America Solar Generator Market Outlook, By Grid Connectivity (2020-2028) ($MN)
36 North America Solar Generator Market Outlook, By On - Grid (2020-2028) ($MN)
37 North America Solar Generator Market Outlook, By Off - Grid (2020-2028) ($MN)
38 North America Solar Generator Market Outlook, By Application (2020-2028) ($MN)
39 North America Solar Generator Market Outlook, By Academics (2020-2028) ($MN)
40 North America Solar Generator Market Outlook, By Electrical Industry (2020-2028) ($MN)
41 North America Solar Generator Market Outlook, By Commercial (2020-2028) ($MN)
42 North America Solar Generator Market Outlook, By Oil and Gas Industry (2020-2028) ($MN)
43 North America Solar Generator Market Outlook, By Government (2020-2028) ($MN)
44 North America Solar Generator Market Outlook, By Residential (2020-2028) ($MN)
45 Europe Solar Generator Market Outlook, By Country (2020-2028) ($MN)
46 Europe Solar Generator Market Outlook, By Product (2020-2028) ($MN)
47 Europe Solar Generator Market Outlook, By 40-80 KWH (2020-2028) ($MN)
48 Europe Solar Generator Market Outlook, By Below 40KWH (2020-2028) ($MN)
49 Europe Solar Generator Market Outlook, By 80-150 KWH (2020-2028) ($MN)
50 Europe Solar Generator Market Outlook, By Over 150 KWH (2020-2028) ($MN)
51 Europe Solar Generator Market Outlook, By Power Rating (2020-2028) ($MN)
52 Europe Solar Generator Market Outlook, By More than 500 W (2020-2028) ($MN)
53 Europe Solar Generator Market Outlook, By Up to 500 W (2020-2028) ($MN)
54 Europe Solar Generator Market Outlook, By Battery Type (2020-2028) ($MN)
55 Europe Solar Generator Market Outlook, By Lithium-ion (2020-2028) ($MN)
56 Europe Solar Generator Market Outlook, By Lead-acid (2020-2028) ($MN)
57 Europe Solar Generator Market Outlook, By Grid Connectivity (2020-2028) ($MN)
58 Europe Solar Generator Market Outlook, By On - Grid (2020-2028) ($MN)
59 Europe Solar Generator Market Outlook, By Off - Grid (2020-2028) ($MN)
60 Europe Solar Generator Market Outlook, By Application (2020-2028) ($MN)
61 Europe Solar Generator Market Outlook, By Academics (2020-2028) ($MN)
62 Europe Solar Generator Market Outlook, By Electrical Industry (2020-2028) ($MN)
63 Europe Solar Generator Market Outlook, By Commercial (2020-2028) ($MN)
64 Europe Solar Generator Market Outlook, By Oil and Gas Industry (2020-2028) ($MN)
65 Europe Solar Generator Market Outlook, By Government (2020-2028) ($MN)
66 Europe Solar Generator Market Outlook, By Residential (2020-2028) ($MN)
67 Asia Pacific Solar Generator Market Outlook, By Country (2020-2028) ($MN)
68 Asia Pacific Solar Generator Market Outlook, By Product (2020-2028) ($MN)
69 Asia Pacific Solar Generator Market Outlook, By 40-80 KWH (2020-2028) ($MN)
70 Asia Pacific Solar Generator Market Outlook, By Below 40KWH (2020-2028) ($MN)
71 Asia Pacific Solar Generator Market Outlook, By 80-150 KWH (2020-2028) ($MN)
72 Asia Pacific Solar Generator Market Outlook, By Over 150 KWH (2020-2028) ($MN)
73 Asia Pacific Solar Generator Market Outlook, By Power Rating (2020-2028) ($MN)
74 Asia Pacific Solar Generator Market Outlook, By More than 500 W (2020-2028) ($MN)
75 Asia Pacific Solar Generator Market Outlook, By Up to 500 W (2020-2028) ($MN)
76 Asia Pacific Solar Generator Market Outlook, By Battery Type (2020-2028) ($MN)
77 Asia Pacific Solar Generator Market Outlook, By Lithium-ion (2020-2028) ($MN)
78 Asia Pacific Solar Generator Market Outlook, By Lead-acid (2020-2028) ($MN)
79 Asia Pacific Solar Generator Market Outlook, By Grid Connectivity (2020-2028) ($MN)
80 Asia Pacific Solar Generator Market Outlook, By On - Grid (2020-2028) ($MN)
81 Asia Pacific Solar Generator Market Outlook, By Off - Grid (2020-2028) ($MN)
82 Asia Pacific Solar Generator Market Outlook, By Application (2020-2028) ($MN)
83 Asia Pacific Solar Generator Market Outlook, By Academics (2020-2028) ($MN)
84 Asia Pacific Solar Generator Market Outlook, By Electrical Industry (2020-2028) ($MN)
85 Asia Pacific Solar Generator Market Outlook, By Commercial (2020-2028) ($MN)
86 Asia Pacific Solar Generator Market Outlook, By Oil and Gas Industry (2020-2028) ($MN)
87 Asia Pacific Solar Generator Market Outlook, By Government (2020-2028) ($MN)
88 Asia Pacific Solar Generator Market Outlook, By Residential (2020-2028) ($MN)
89 South America Solar Generator Market Outlook, By Country (2020-2028) ($MN)
90 South America Solar Generator Market Outlook, By Product (2020-2028) ($MN)
91 South America Solar Generator Market Outlook, By 40-80 KWH (2020-2028) ($MN)
92 South America Solar Generator Market Outlook, By Below 40KWH (2020-2028) ($MN)
93 South America Solar Generator Market Outlook, By 80-150 KWH (2020-2028) ($MN)
94 South America Solar Generator Market Outlook, By Over 150 KWH (2020-2028) ($MN)
95 South America Solar Generator Market Outlook, By Power Rating (2020-2028) ($MN)
96 South America Solar Generator Market Outlook, By More than 500 W (2020-2028) ($MN)
97 South America Solar Generator Market Outlook, By Up to 500 W (2020-2028) ($MN)
98 South America Solar Generator Market Outlook, By Battery Type (2020-2028) ($MN)
99 South America Solar Generator Market Outlook, By Lithium-ion (2020-2028) ($MN)
100 South America Solar Generator Market Outlook, By Lead-acid (2020-2028) ($MN)
101 South America Solar Generator Market Outlook, By Grid Connectivity (2020-2028) ($MN)
102 South America Solar Generator Market Outlook, By On - Grid (2020-2028) ($MN)
103 South America Solar Generator Market Outlook, By Off - Grid (2020-2028) ($MN)
104 South America Solar Generator Market Outlook, By Application (2020-2028) ($MN)
105 South America Solar Generator Market Outlook, By Academics (2020-2028) ($MN)
106 South America Solar Generator Market Outlook, By Electrical Industry (2020-2028) ($MN)
107 South America Solar Generator Market Outlook, By Commercial (2020-2028) ($MN)
108 South America Solar Generator Market Outlook, By Oil and Gas Industry (2020-2028) ($MN)
109 South America Solar Generator Market Outlook, By Government (2020-2028) ($MN)
110 South America Solar Generator Market Outlook, By Residential (2020-2028) ($MN)
111 Middle East & Africa Solar Generator Market Outlook, By Country (2020-2028) ($MN)
112 Middle East & Africa Solar Generator Market Outlook, By Product (2020-2028) ($MN)
113 Middle East & Africa Solar Generator Market Outlook, By 40-80 KWH (2020-2028) ($MN)
114 Middle East & Africa Solar Generator Market Outlook, By Below 40KWH (2020-2028) ($MN)
115 Middle East & Africa Solar Generator Market Outlook, By 80-150 KWH (2020-2028) ($MN)
116 Middle East & Africa Solar Generator Market Outlook, By Over 150 KWH (2020-2028) ($MN)
117 Middle East & Africa Solar Generator Market Outlook, By Power Rating (2020-2028) ($MN)
118 Middle East & Africa Solar Generator Market Outlook, By More than 500 W (2020-2028) ($MN)
119 Middle East & Africa Solar Generator Market Outlook, By Up to 500 W (2020-2028) ($MN)
120 Middle East & Africa Solar Generator Market Outlook, By Battery Type (2020-2028) ($MN)
121 Middle East & Africa Solar Generator Market Outlook, By Lithium-ion (2020-2028) ($MN)
122 Middle East & Africa Solar Generator Market Outlook, By Lead-acid (2020-2028) ($MN)
123 Middle East & Africa Solar Generator Market Outlook, By Grid Connectivity (2020-2028) ($MN)
124 Middle East & Africa Solar Generator Market Outlook, By On - Grid (2020-2028) ($MN)
125 Middle East & Africa Solar Generator Market Outlook, By Off - Grid (2020-2028) ($MN)
126 Middle East & Africa Solar Generator Market Outlook, By Application (2020-2028) ($MN)
127 Middle East & Africa Solar Generator Market Outlook, By Academics (2020-2028) ($MN)
128 Middle East & Africa Solar Generator Market Outlook, By Electrical Industry (2020-2028) ($MN)
129 Middle East & Africa Solar Generator Market Outlook, By Commercial (2020-2028) ($MN)
130 Middle East & Africa Solar Generator Market Outlook, By Oil and Gas Industry (2020-2028) ($MN)
131 Middle East & Africa Solar Generator Market Outlook, By Government (2020-2028) ($MN)
132 Middle East & Africa Solar Generator Market Outlook, By Residential (2020-2028) ($MN)
List of Figures
RESEARCH METHODOLOGY

We at ‘Stratistics’ opt for an extensive research approach which involves data mining, data validation, and data analysis. The various research sources include in-house repository, secondary research, competitor’s sources, social media research, client internal data, and primary research.
Our team of analysts prefers the most reliable and authenticated data sources in order to perform the comprehensive literature search. With access to most of the authenticated data bases our team highly considers the best mix of information through various sources to obtain extensive and accurate analysis.
Each report takes an average time of a month and a team of 4 industry analysts. The time may vary depending on the scope and data availability of the desired market report. The various parameters used in the market assessment are standardized in order to enhance the data accuracy.
Data Mining
The data is collected from several authenticated, reliable, paid and unpaid sources and is filtered depending on the scope & objective of the research. Our reports repository acts as an added advantage in this procedure. Data gathering from the raw material suppliers, distributors and the manufacturers is performed on a regular basis, this helps in the comprehensive understanding of the products value chain. Apart from the above mentioned sources the data is also collected from the industry consultants to ensure the objective of the study is in the right direction.
Market trends such as technological advancements, regulatory affairs, market dynamics (Drivers, Restraints, Opportunities and Challenges) are obtained from scientific journals, market related national & international associations and organizations.
Data Analysis
From the data that is collected depending on the scope & objective of the research the data is subjected for the analysis. The critical steps that we follow for the data analysis include:
- Product Lifecycle Analysis
- Competitor analysis
- Risk analysis
- Porters Analysis
- PESTEL Analysis
- SWOT Analysis
The data engineering is performed by the core industry experts considering both the Marketing Mix Modeling and the Demand Forecasting. The marketing mix modeling makes use of multiple-regression techniques to predict the optimal mix of marketing variables. Regression factor is based on a number of variables and how they relate to an outcome such as sales or profits.
Data Validation
The data validation is performed by the exhaustive primary research from the expert interviews. This includes telephonic interviews, focus groups, face to face interviews, and questionnaires to validate our research from all aspects. The industry experts we approach come from the leading firms, involved in the supply chain ranging from the suppliers, distributors to the manufacturers and consumers so as to ensure an unbiased analysis.
We are in touch with more than 15,000 industry experts with the right mix of consultants, CEO's, presidents, vice presidents, managers, experts from both supply side and demand side, executives and so on.
The data validation involves the primary research from the industry experts belonging to:
- Leading Companies
- Suppliers & Distributors
- Manufacturers
- Consumers
- Industry/Strategic Consultants
Apart from the data validation the primary research also helps in performing the fill gap research, i.e. providing solutions for the unmet needs of the research which helps in enhancing the reports quality.
For more details about research methodology, kindly write to us at info@strategymrc.com
Frequently Asked Questions
In case of any queries regarding this report, you can contact the customer service by filing the “Inquiry Before Buy” form available on the right hand side. You may also contact us through email: info@strategymrc.com or phone: +1-301-202-5929
Yes, the samples are available for all the published reports. You can request them by filling the “Request Sample” option available in this page.
Yes, you can request a sample with your specific requirements. All the customized samples will be provided as per the requirement with the real data masked.
All our reports are available in Digital PDF format. In case if you require them in any other formats, such as PPT, Excel etc you can submit a request through “Inquiry Before Buy” form available on the right hand side. You may also contact us through email: info@strategymrc.com or phone: +1-301-202-5929
We offer a free 15% customization with every purchase. This requirement can be fulfilled for both pre and post sale. You may send your customization requirements through email at info@strategymrc.com or call us on +1-301-202-5929.
We have 3 different licensing options available in electronic format.
- Single User Licence: Allows one person, typically the buyer, to have access to the ordered product. The ordered product cannot be distributed to anyone else.
- 2-5 User Licence: Allows the ordered product to be shared among a maximum of 5 people within your organisation.
- Corporate License: Allows the product to be shared among all employees of your organisation regardless of their geographical location.
All our reports are typically be emailed to you as an attachment.
To order any available report you need to register on our website. The payment can be made either through CCAvenue or PayPal payments gateways which accept all international cards.
We extend our support to 6 months post sale. A post sale customization is also provided to cover your unmet needs in the report.
Request Customization
We offer complimentary customization of up to 15% with every purchase. To share your customization requirements, feel free to email us at info@strategymrc.com or call us on +1-301-202-5929. .
Please Note: Customization within the 15% threshold is entirely free of charge. If your request exceeds this limit, we will conduct a feasibility assessment. Following that, a detailed quote and timeline will be provided.
WHY CHOOSE US ?

Assured Quality
Best in class reports with high standard of research integrity

24X7 Research Support
Continuous support to ensure the best customer experience.

Free Customization
Adding more values to your product of interest.

Safe & Secure Access
Providing a secured environment for all online transactions.

Trusted by 600+ Brands
Serving the most reputed brands across the world.