
Stored Grain Protectants Market
Stored Grain Protectants Market Forecasts to 2028 – Global Analysis By Product (Chemical Control, Physical Control, Biological Control), Application (Corn, Wheat, Rice, Other Applications), and By Geography

|
Years Covered |
2020-2028 |
|
Estimated Year Value (2021) |
US $663.24 MN |
|
Projected Year Value (2028) |
US $997.27 MN |
|
CAGR (2021 - 2028) |
6.0% |
|
Regions Covered |
North America, Europe, Asia Pacific, South America, and Middle East & Africa |
|
Countries Covered |
US, Canada, Mexico, Germany, UK, Italy, France, Spain, Japan, China, India, Australia, New Zealand, South Korea, Rest of Asia Pacific, South America, Argentina, Brazil, Chile, Middle East & Africa, Saudi Arabia, UAE, Qatar, and South Africa |
|
Largest Market |
Asia Pacific |
|
Highest Growing Market |
North America |
According to Stratistics MRC, the Global Stored Grain Protectants Market is accounted for $663.24 million in 2021 and is expected to reach $997.27 million by 2028 growing at a CAGR of 6.0% during the forecast period. Prevention of food losses during storage after harvesting is important in terms of economy. Nowadays integrated pest management is a widely accepted strategy in pest control, which involves the use of chemical insecticides coupled with fumigants. The uses of synthetic fumigants are restricted because of the residue problem and health hazards to humans. Food grain losses are a serious problem, particularly in developing countries. Losses caused by insects include not only the direct consumption of kernels, but also the accumulation of cadavers, exuviae, and webbing. Insect damage can result in, reduction of rain weight, loss of nutrients, and decreased germination. It may also cause deterioration and contamination to the grain which in turn cause poorer gradation of grain and lower the market value. There are various types of methods available for pest control such as Chemical control which includes Insecticides, Fumigants, and Rodenticides, Physical control that includes Traps, Baits, Aeration, Heat Treatment, and Biological control. Chemical control is the most adopted pest control method across the globe. Among chemical control, air fumigants are most preferred by farmers as it leaves a minimum residue as compared to others.
Market Dynamics:
Driver:
Growing insect pest management in stored grain
Once cereal grain is harvested and put into storage, it provides a resource for a range of insect pests of stored grain. With few exceptions, these insects rarely attack grain in the field before harvest, but once the grain is in storage there is a degree of inevitability that insect infestation will occur. This means that methods are needed to either disinfest grain or to protect it from infestation during storage. Resistance to phosphine resistance and various insecticides, as well as the phase-out of methyl bromide as an ozone-depleting substance, continue to be major drivers for research on management of insects in stored products. Other research has focused on improving the basic understanding of various methods or ways of improving methods currently in use. Despite extensive research on a wide variety of chemical and non-chemical treatments, very few have been commercialized. Two examples are spinosad, which has been registered as a grain protectant, and sulfuric fluoride, which is now available as a grain fumigant. The interest in non-chemical treatments, especially aeration cooling, is encouraging. In general, integrated pest management is seen as the goal of entomologists, requiring the strategic integration of multiple methods to provide maximum effect with minimal health and environmental risks.
Restraint:
Post-harvest losses of grain
Post-harvest grain losses include all losses, starting from grain harvesting before it is used for consumption or other purposes. In most developing countries, especially in Sub-Saharan Africa, agricultural productivity is lower compared to developed countries. In addition to the lower agricultural productivity, post-harvest losses of cereals and legumes range from 20–30% in most developing countries around the world [6]. Losses could be in terms or the quantity and quality of grain, both of which significantly reduce the value. Quantitative losses occur due to spillage and scattering of grain, direct infestation by pests, birds and mycotoxins, or mechanical breakages, whereas qualitative losses are mainly due to infestation by mold, mycotoxins, and mechanical breakages. There are different factors associated with different forms and extents of post-harvest losses along the grain supply chain.
Opportunity:
Improvements in large-scale storage
The choice amongst the technical options to develop cost-effective packages of measures for well-integrated pest control cannot be made without reference to particular situations. As has been previously stressed, it is the storage management objectives, together with the technical and financial constraints, that must be identified and analyzed in each case. However, it is of interest that recent decades have seen a marked swing towards the use of physical barriers against re-infestation in combination with improved conventional fumigation or the introduction of controlled atmosphere storage techniques. The attainment of fully integrated pest management in large-scale storage will depend largely upon the development and adoption of improved pest-monitoring procedures, with increased capability for measuring pest population levels as a parameter of grain damage and quality loss, so as to ensure as far as possible the most cost-effective timing of pest control actions.
Threat:
Challenges in grain storage practices
Grain is usually stored for several months after harvest, which is much longer than other grain post-harvest steps. Also, the grain is minimally monitored during storage. Thus, proper grain storage conditions are needed to minimize grain losses. Factors that play a crucial role in storage losses can be classified as physical, biological, and socioeconomic. Physical factors influence the conditions for insect multiplication and mold growth during grain storage, which eventually affects the storability of the grain. Insects/pests and rodents are the major factors affecting grain quality and grain losses in developing countries. Mold formation in stored grain can produce different mycotoxins, which are toxic chemicals unsuitable for human consumption.
The corn segment is expected to be the largest during the forecast period
The corn segment is expected to hold the largest share in the market due to the demand for corn from the various food industries in developed countries like the U.S. Storing corn, even for a short time, requires a proactive defense against corn bugs that could lead to damaged grain and a reduced bottom line. A protectant insecticide should be applied to corn that is expected to be stored for greater than one year, and it should be applied only after high-temperature drying when the corn moisture is approximately 14% to 15%. For instance, Actellic 5E. This product has long been the standard for use on corn and grain sorghum. A full rate will provide protection from weevils for 9-12 months. Reducing the rate will decrease the longevity of the protection. UGA data suggest that Actellic is susceptible to heat degradation in the drier when grain temperatures exceed 120 F.
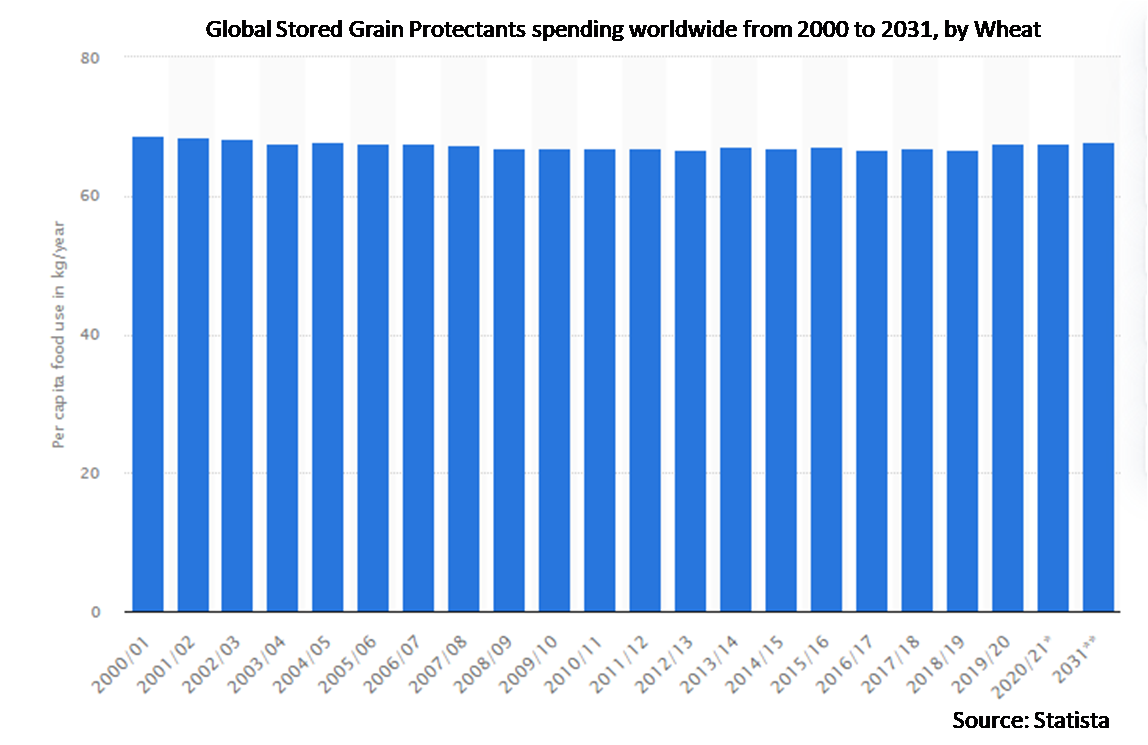
The wheat segment is expected to have the highest CAGR during the forecast period
The wheat segment is anticipated to witness the fastest CAGR growth during the forecast period. Biological control agents, such as predatory and parasitic insects, have limited use in stored wheat management. This is mainly due to inadequate availability and restrictions on the presence of all live insects in the wheat when it is sold. As wheat harvest is underway it is important to ensure that grain bins are prepared in the best possible manner to prevent insect infestations.
Region with largest share:
Asia Pacific is projected to hold the largest market share during the forecast period due to the higher adoption of grain fumigants in the countries such as India, China, Vietnam, and Thailand. In addition, rain productions in these countries are higher in amount. The rising population and decreasing arable land have led to an increase in the demand for food security and food safety, globally. Additionally, the growing concerns of food grain damage and deterioration due to pest manifestations have led to the increased use of stored grain protectants for food grains in the region.
Region with highest CAGR:
North America is projected to have the highest CAGR over the forecast period owing to the growing concerns of food grain damage and deterioration due to pest manifestations have led to the increased use of grain protectants for food grains. Also, there is a high adoption of grain protection practices by large-scale farmers and presence of key manufacturers in the region. Additionally, the need to meet the standards while storing grains in warehouses is also boosting the sales of grain protectants in the region.

Key players in the market:
Some of the key players profiled in the Stored Grain Protectants Market include Arysta Lifescience, BASF, Bayer, Central Life Sciences, Degesch America, Dowdupont, FMC, Hedley Technologies, Nufarm, Sumitomo Chemical, Syngenta, and UPL.
Key Developments:
In April 2021, Central Life Sciences enhances Inselux Fog & Mill Spray, a fogging component, to its sector portfolio of stored-grain insect management solutions.
In April 2019, Nufarm Americas, Inc. has invented the Panther MTZ herbicide, which is designed to help growers manage weeds and provide long-lasting residual control that develops spring flexibility.
In April 2018, BASF signed agreement to acquire additional seeds and crop protection businesses and assets from Bayer. With this acquisition, BASF will become an even better partner for farmers by strengthening crop protection portfolio and entering the seeds business in key agricultural markets.
Products Covered:
• Chemical Control
• Physical Control
• Biological Control
Applications Covered:
• Corn
• Wheat
• Rice
• Other Applications
Regions Covered:
• North America
o US
o Canada
o Mexico
• Europe
o Germany
o UK
o Italy
o France
o Spain
o Rest of Europe
• Asia Pacific
o Japan
o China
o India
o Australia
o New Zealand
o South Korea
o Rest of Asia Pacific
• South America
o Argentina
o Brazil
o Chile
o Rest of South America
• Middle East & Africa
o Saudi Arabia
o UAE
o Qatar
o South Africa
o Rest of Middle East & Africa
What our report offers:
- Market share assessments for the regional and country-level segments
- Strategic recommendations for the new entrants
- Covers Market data for the years 2020, 2021, 2022, 2025, and 2028
- Market Trends (Drivers, Constraints, Opportunities, Threats, Challenges, Investment Opportunities, and recommendations)
- Strategic recommendations in key business segments based on the market estimations
- Competitive landscaping mapping the key common trends
- Company profiling with detailed strategies, financials, and recent developments
- Supply chain trends mapping the latest technological advancements
Free Customization Offerings:
All the customers of this report will be entitled to receive one of the following free customization options:
• Company Profiling
o Comprehensive profiling of additional market players (up to 3)
o SWOT Analysis of key players (up to 3)
• Regional Segmentation
o Market estimations, Forecasts and CAGR of any prominent country as per the client's interest (Note: Depends on feasibility check)
• Competitive Benchmarking
o Benchmarking of key players based on product portfolio, geographical presence, and strategic alliances
Table of Contents
1 Executive Summary
2 Preface
2.1 Abstract
2.2 Stake Holders
2.3 Research Scope
2.4 Research Methodology
2.4.1 Data Mining
2.4.2 Data Analysis
2.4.3 Data Validation
2.4.4 Research Approach
2.5 Research Sources
2.5.1 Primary Research Sources
2.5.2 Secondary Research Sources
2.5.3 Assumptions
3 Market Trend Analysis
3.1 Introduction
3.2 Drivers
3.3 Restraints
3.4 Opportunities
3.5 Threats
3.6 Product Analysis
3.7 Application Analysis
3.8 Emerging Markets
3.9 Impact of Covid-19
4 Porters Five Force Analysis
4.1 Bargaining power of suppliers
4.2 Bargaining power of buyers
4.3 Threat of substitutes
4.4 Threat of new entrants
4.5 Competitive rivalry
5 Global Stored Grain Protectants Market, By Product
5.1 Introduction
5.2 Chemical Control
5.3 Physical Control
5.4 Biological Control
6 Global Stored Grain Protectants Market, By Application
6.1 Introduction
6.2 Corn
6.3 Wheat
6.4 Rice
6.5 Other Applications
7 Global Stored Grain Protectants Market, By Geography
7.1 Introduction
7.2 North America
7.2.1 US
7.2.2 Canada
7.2.3 Mexico
7.3 Europe
7.3.1 Germany
7.3.2 UK
7.3.3 Italy
7.3.4 France
7.3.5 Spain
7.3.6 Rest of Europe
7.4 Asia Pacific
7.4.1 Japan
7.4.2 China
7.4.3 India
7.4.4 Australia
7.4.5 New Zealand
7.4.6 South Korea
7.4.7 Rest of Asia Pacific
7.5 South America
7.5.1 Argentina
7.5.2 Brazil
7.5.3 Chile
7.5.4 Rest of South America
7.6 Middle East & Africa
7.6.1 Saudi Arabia
7.6.2 UAE
7.6.3 Qatar
7.6.4 South Africa
7.6.5 Rest of Middle East & Africa
8 Key Developments
8.1 Agreements, Partnerships, Collaborations and Joint Ventures
8.2 Acquisitions & Mergers
8.3 New Product Launch
8.4 Expansions
8.5 Other Key Strategies
9 Company Profiling
9.1 Arysta Lifescience
9.2 BASF
9.3 Bayer
9.4 Central Life Sciences
9.5 Degesch America
9.6 Dowdupont
9.7 FMC
9.8 Hedley Technologies
9.9 Nufarm
9.10 Sumitomo Chemical
9.11 Syngenta
9.12 UPL
List of Tables
1 Global Stored Grain Protectants Market Outlook, By Region (2019-2028) ($MN)
2 Global Stored Grain Protectants Market Outlook, By Product (2019-2028) ($MN)
3 Global Stored Grain Protectants Market Outlook, By Chemical Control (2019-2028) ($MN)
4 Global Stored Grain Protectants Market Outlook, By Physical Control (2019-2028) ($MN)
5 Global Stored Grain Protectants Market Outlook, By Biological Control (2019-2028) ($MN)
6 Global Stored Grain Protectants Market Outlook, By Application (2019-2028) ($MN)
7 Global Stored Grain Protectants Market Outlook, By Corn (2019-2028) ($MN)
8 Global Stored Grain Protectants Market Outlook, By Wheat (2019-2028) ($MN)
9 Global Stored Grain Protectants Market Outlook, By Rice (2019-2028) ($MN)
10 Global Stored Grain Protectants Market Outlook, By Other Applications (2019-2028) ($MN)
11 North America Stored Grain Protectants Market Outlook, By Country (2019-2028) ($MN)
12 North America Stored Grain Protectants Market Outlook, By Product (2019-2028) ($MN)
13 North America Stored Grain Protectants Market Outlook, By Chemical Control (2019-2028) ($MN)
14 North America Stored Grain Protectants Market Outlook, By Physical Control (2019-2028) ($MN)
15 North America Stored Grain Protectants Market Outlook, By Biological Control (2019-2028) ($MN)
16 North America Stored Grain Protectants Market Outlook, By Application (2019-2028) ($MN)
17 North America Stored Grain Protectants Market Outlook, By Corn (2019-2028) ($MN)
18 North America Stored Grain Protectants Market Outlook, By Wheat (2019-2028) ($MN)
19 North America Stored Grain Protectants Market Outlook, By Rice (2019-2028) ($MN)
20 North America Stored Grain Protectants Market Outlook, By Other Applications (2019-2028) ($MN)
21 Europe Stored Grain Protectants Market Outlook, By Country (2019-2028) ($MN)
22 Europe Stored Grain Protectants Market Outlook, By Product (2019-2028) ($MN)
23 Europe Stored Grain Protectants Market Outlook, By Chemical Control (2019-2028) ($MN)
24 Europe Stored Grain Protectants Market Outlook, By Physical Control (2019-2028) ($MN)
25 Europe Stored Grain Protectants Market Outlook, By Biological Control (2019-2028) ($MN)
26 Europe Stored Grain Protectants Market Outlook, By Application (2019-2028) ($MN)
27 Europe Stored Grain Protectants Market Outlook, By Corn (2019-2028) ($MN)
28 Europe Stored Grain Protectants Market Outlook, By Wheat (2019-2028) ($MN)
29 Europe Stored Grain Protectants Market Outlook, By Rice (2019-2028) ($MN)
30 Europe Stored Grain Protectants Market Outlook, By Other Applications (2019-2028) ($MN)
31 Asia Pacific Stored Grain Protectants Market Outlook, By Country (2019-2028) ($MN)
32 Asia Pacific Stored Grain Protectants Market Outlook, By Product (2019-2028) ($MN)
33 Asia Pacific Stored Grain Protectants Market Outlook, By Chemical Control (2019-2028) ($MN)
34 Asia Pacific Stored Grain Protectants Market Outlook, By Physical Control (2019-2028) ($MN)
35 Asia Pacific Stored Grain Protectants Market Outlook, By Biological Control (2019-2028) ($MN)
36 Asia Pacific Stored Grain Protectants Market Outlook, By Application (2019-2028) ($MN)
37 Asia Pacific Stored Grain Protectants Market Outlook, By Corn (2019-2028) ($MN)
38 Asia Pacific Stored Grain Protectants Market Outlook, By Wheat (2019-2028) ($MN)
39 Asia Pacific Stored Grain Protectants Market Outlook, By Rice (2019-2028) ($MN)
40 Asia Pacific Stored Grain Protectants Market Outlook, By Other Applications (2019-2028) ($MN)
41 South America Stored Grain Protectants Market Outlook, By Country (2019-2028) ($MN)
42 South America Stored Grain Protectants Market Outlook, By Product (2019-2028) ($MN)
43 South America Stored Grain Protectants Market Outlook, By Chemical Control (2019-2028) ($MN)
44 South America Stored Grain Protectants Market Outlook, By Physical Control (2019-2028) ($MN)
45 South America Stored Grain Protectants Market Outlook, By Biological Control (2019-2028) ($MN)
46 South America Stored Grain Protectants Market Outlook, By Application (2019-2028) ($MN)
47 South America Stored Grain Protectants Market Outlook, By Corn (2019-2028) ($MN)
48 South America Stored Grain Protectants Market Outlook, By Wheat (2019-2028) ($MN)
49 South America Stored Grain Protectants Market Outlook, By Rice (2019-2028) ($MN)
50 South America Stored Grain Protectants Market Outlook, By Other Applications (2019-2028) ($MN)
51 Middle East & Africa Stored Grain Protectants Market Outlook, By Country (2019-2028) ($MN)
52 Middle East & Africa Stored Grain Protectants Market Outlook, By Product (2019-2028) ($MN)
53 Middle East & Africa Stored Grain Protectants Market Outlook, By Chemical Control (2019-2028) ($MN)
54 Middle East & Africa Stored Grain Protectants Market Outlook, By Physical Control (2019-2028) ($MN)
55 Middle East & Africa Stored Grain Protectants Market Outlook, By Biological Control (2019-2028) ($MN)
56 Middle East & Africa Stored Grain Protectants Market Outlook, By Application (2019-2028) ($MN)
57 Middle East & Africa Stored Grain Protectants Market Outlook, By Corn (2019-2028) ($MN)
58 Middle East & Africa Stored Grain Protectants Market Outlook, By Wheat (2019-2028) ($MN)
59 Middle East & Africa Stored Grain Protectants Market Outlook, By Rice (2019-2028) ($MN)
60 Middle East & Africa Stored Grain Protectants Market Outlook, By Other Applications (2019-2028) ($MN)
List of Figures
RESEARCH METHODOLOGY

We at ‘Stratistics’ opt for an extensive research approach which involves data mining, data validation, and data analysis. The various research sources include in-house repository, secondary research, competitor’s sources, social media research, client internal data, and primary research.
Our team of analysts prefers the most reliable and authenticated data sources in order to perform the comprehensive literature search. With access to most of the authenticated data bases our team highly considers the best mix of information through various sources to obtain extensive and accurate analysis.
Each report takes an average time of a month and a team of 4 industry analysts. The time may vary depending on the scope and data availability of the desired market report. The various parameters used in the market assessment are standardized in order to enhance the data accuracy.
Data Mining
The data is collected from several authenticated, reliable, paid and unpaid sources and is filtered depending on the scope & objective of the research. Our reports repository acts as an added advantage in this procedure. Data gathering from the raw material suppliers, distributors and the manufacturers is performed on a regular basis, this helps in the comprehensive understanding of the products value chain. Apart from the above mentioned sources the data is also collected from the industry consultants to ensure the objective of the study is in the right direction.
Market trends such as technological advancements, regulatory affairs, market dynamics (Drivers, Restraints, Opportunities and Challenges) are obtained from scientific journals, market related national & international associations and organizations.
Data Analysis
From the data that is collected depending on the scope & objective of the research the data is subjected for the analysis. The critical steps that we follow for the data analysis include:
- Product Lifecycle Analysis
- Competitor analysis
- Risk analysis
- Porters Analysis
- PESTEL Analysis
- SWOT Analysis
The data engineering is performed by the core industry experts considering both the Marketing Mix Modeling and the Demand Forecasting. The marketing mix modeling makes use of multiple-regression techniques to predict the optimal mix of marketing variables. Regression factor is based on a number of variables and how they relate to an outcome such as sales or profits.
Data Validation
The data validation is performed by the exhaustive primary research from the expert interviews. This includes telephonic interviews, focus groups, face to face interviews, and questionnaires to validate our research from all aspects. The industry experts we approach come from the leading firms, involved in the supply chain ranging from the suppliers, distributors to the manufacturers and consumers so as to ensure an unbiased analysis.
We are in touch with more than 15,000 industry experts with the right mix of consultants, CEO's, presidents, vice presidents, managers, experts from both supply side and demand side, executives and so on.
The data validation involves the primary research from the industry experts belonging to:
- Leading Companies
- Suppliers & Distributors
- Manufacturers
- Consumers
- Industry/Strategic Consultants
Apart from the data validation the primary research also helps in performing the fill gap research, i.e. providing solutions for the unmet needs of the research which helps in enhancing the reports quality.
For more details about research methodology, kindly write to us at info@strategymrc.com
Frequently Asked Questions
In case of any queries regarding this report, you can contact the customer service by filing the “Inquiry Before Buy” form available on the right hand side. You may also contact us through email: info@strategymrc.com or phone: +1-301-202-5929
Yes, the samples are available for all the published reports. You can request them by filling the “Request Sample” option available in this page.
Yes, you can request a sample with your specific requirements. All the customized samples will be provided as per the requirement with the real data masked.
All our reports are available in Digital PDF format. In case if you require them in any other formats, such as PPT, Excel etc you can submit a request through “Inquiry Before Buy” form available on the right hand side. You may also contact us through email: info@strategymrc.com or phone: +1-301-202-5929
We offer a free 15% customization with every purchase. This requirement can be fulfilled for both pre and post sale. You may send your customization requirements through email at info@strategymrc.com or call us on +1-301-202-5929.
We have 3 different licensing options available in electronic format.
- Single User Licence: Allows one person, typically the buyer, to have access to the ordered product. The ordered product cannot be distributed to anyone else.
- 2-5 User Licence: Allows the ordered product to be shared among a maximum of 5 people within your organisation.
- Corporate License: Allows the product to be shared among all employees of your organisation regardless of their geographical location.
All our reports are typically be emailed to you as an attachment.
To order any available report you need to register on our website. The payment can be made either through CCAvenue or PayPal payments gateways which accept all international cards.
We extend our support to 6 months post sale. A post sale customization is also provided to cover your unmet needs in the report.
Request Customization
We offer complimentary customization of up to 15% with every purchase. To share your customization requirements, feel free to email us at info@strategymrc.com or call us on +1-301-202-5929. .
Please Note: Customization within the 15% threshold is entirely free of charge. If your request exceeds this limit, we will conduct a feasibility assessment. Following that, a detailed quote and timeline will be provided.
WHY CHOOSE US ?

Assured Quality
Best in class reports with high standard of research integrity

24X7 Research Support
Continuous support to ensure the best customer experience.

Free Customization
Adding more values to your product of interest.

Safe & Secure Access
Providing a secured environment for all online transactions.

Trusted by 600+ Brands
Serving the most reputed brands across the world.