
Utility Tractor Market
Utility Tractor Market Forecasts to 2028 - Global Analysis By Driver Type (Pedestrian, Wheeled, Two-Wheelers and Four-Wheelers), By Engine (Internal Combustion and Electric) By Application (Dairy farmland, Hay and Agriculture Products, Landscaping and Construction/Maintenance) and Geography

|
Years Covered |
2020-2028 |
|
Estimated Year Value (2022) |
US $106 BN |
|
Projected Year Value (2028) |
US $165 BN |
|
CAGR (2022 - 2028) |
7.7% |
|
Regions Covered |
North America, Europe, Asia Pacific, South America, and Middle East & Africa |
|
Countries Covered |
US, Canada, Mexico, Germany, UK, Italy, France, Spain, Japan, China, India, Australia, New Zealand, South Korea, Rest of Asia Pacific, South America, Argentina, Brazil, Chile, Middle East & Africa, Saudi Arabia, UAE, Qatar, and South Africa |
|
Largest Market |
Asia Pacific |
|
Highest Growing Market |
North America |
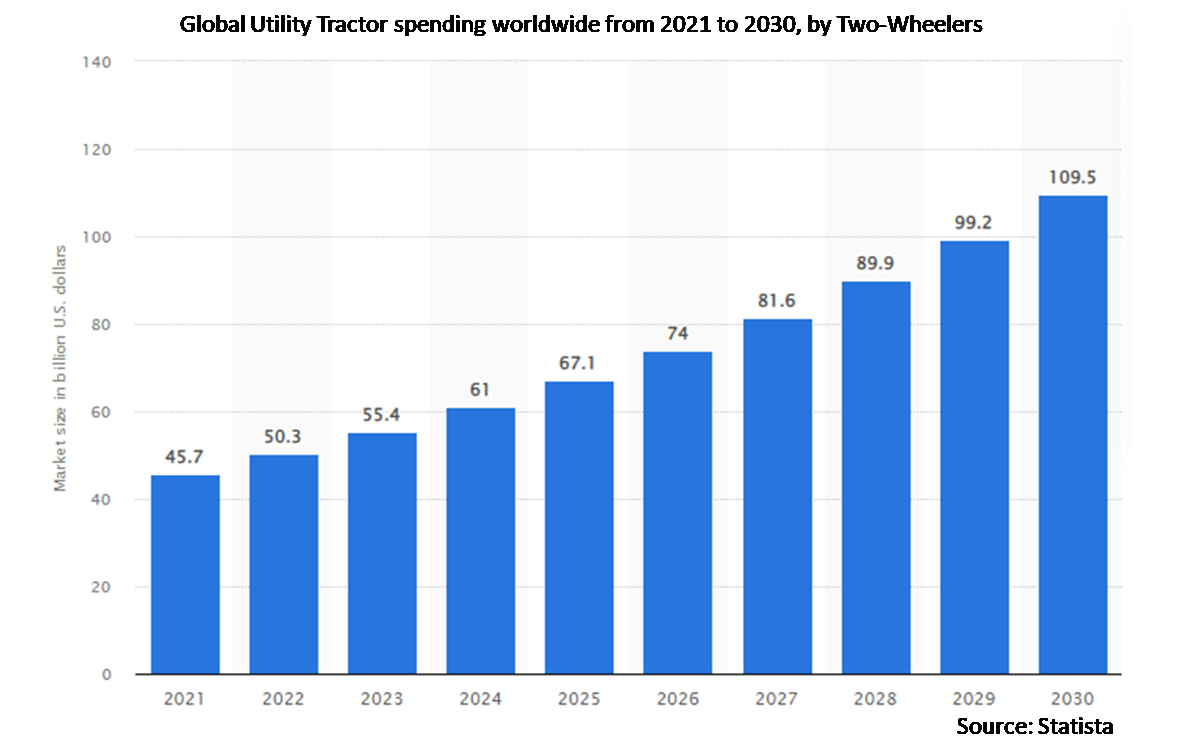
According to Stratistics MRC, the Global Utility Tractor Market is accounted for $106 billion in 2022 and is expected to reach $165 billion by 2028 growing at a CAGR of 7.7% during the forecast period. A utility tractor is a low- to medium-horsepower tractor. Attachments are installed on utility tractors to enable them to perform maintenance, landscaping, and agricultural tasks. The utility tractors have three-point hitches, hydraulics, and power take-offs (PTOs). The tractors can therefore handle heavy tasks with great ease and effectiveness. The main drivers behind the growth of the utility tractor market include the rising demand for powered implements and 4-wheel drive tractors, the demand for new, mechanised farming or agricultural techniques, particularly in developing nations, and the increasing integration of cutting-edge technology with agricultural equipment.
According to the Federation of Automobile Dealers Associations of India, In December 2020, tractor sales in India increased by 35.49% yoy in december 2020. India, being the largest tractor producer and market in the world with the increase in sales it will eventually boost the market growth.
Market Dynamics:
Driver:
Rise in demand for mechanization among farmers
Tractor adoption has been fueled by farmers' increased purchasing power and the desire to increase farm yield. As a result, utility tractors are becoming more popular among small-scale and subsistence farmers in rural areas, which in turn is driving the market. Utility tractors are economical and can be equipped with mowers, log splitters, trailers, rotavators, and harrows, among other attachments. Compared to high power tractors, utility tractors are simpler to maintain and are simple to customise for use in agricultural and construction applications. Consequently, it is anticipated that the utility tractor market will grow as a result of the increased use of tractors in agricultural operations and the rising demand for mechanisation.
Restraint:
High fuel consumption and limited storage
The cost of ownership and operation is lower in utility tractors. Comparing it to conventional tractors, which are frequently too heavy for some tasks like moving cargo down steep hillsides, it has more versatility because its carrying size is less constricting. Moreover, they do not carry as much torque, which can cause faster wear out from stress, generally requires less maintenance than standard sized tractors. However, compared to their larger counterparts, these machines consume fuel much more quickly.
Opportunity:
Rising technological advancements
Due to consumer demand, manufacturers are concentrating on technological advancement in utility tractors for energy-efficient and environmentally friendly tractors. Manufacturers of construction equipment are attempting to include a GPS-based advanced tracking system that will allow a driver to track the location of the wheeled utility tractors and increase their efficiency. The Asia Pacific region's farmers are also looking for utility tractors with specialised features that can meet their needs for efficient farming. So many domestic and international agricultural machinery manufacturers are developing new, technologically advanced utility tractors that can handle a variety of farming applications in order to meet consumer demand.
Threat:
Unavailability of quick assistance
Many businesses in the market are unable to offer urgent support if the device malfunctions on a production website in a remote location, aside from routine maintenance. This contributes to customer dissatisfaction and increases their costs, which raises the overall cost of ownership. Such elements are hindering the market expansion.
Covid-19 Impact
Due to the implementation of lockdown to prevent the spread of the COVID-19 pandemic, sales of tractors in the end of first quarter and in the starting month of second quarter slightly declined in most of the countries. Because businesses were unable to obtain the raw materials, components, and other tractor parts needed for assembly and manufacturing, the production of tractors drastically decreased in 2020. Despite the fact that sales of tractors fell dramatically during the COVID-19's second wave, supply chains were strengthened and the market quickly recovered. Due to the release of the COVID-19 Omicron variant, sales have decreased once more in December 2021. However, the market is anticipated to quickly rebound in 2022.
The 4 Wheelers segment is expected to be the largest during the forecast period
The demand for 4 wheelers segment is anticipated to increase significantly in the coming years due to their increased efficiency and improved fuel economy. Due to this, the 4 Wheelers segment is expected to be the largest during the forecast period. When accelerating, the 4WD tractors offer remarkably high forward traction. Depending on the type of soil and environmental factors, the maximum power output of a 4-wheel drive vehicle increases from 12% to 45%. This is useful when driving in agricultural settings and on mild off-road terrain. Such factors are causing the rapid growth.
The Electric segment is expected to have the highest CAGR during the forecast period
Due to their low noise and emission-free operation, electric segment is anticipated to have the highest CAGR during the forecast period. Moreover, battery-powered tractors are being used more and more in dairy farms. Furthermore, the key players will benefit from R&D investments and technological advancements in developing nations against utility tractors, such as tailored features. Such factors are boosting the segment growth.
Region with Largest share:
Asia Pacific is expected to hold the largest market share during the forecast period. Utility tractors in terms of volume, accounting for more than 81% of the global market share in 2019. Increased agricultural investment and government encouragement of farm mechanisation have been the trend driving the rise in China. The demand for utility tractors in the Asia Pacific region is a result of investments and small farmers in India have benefited from custom hiring services, and a new breed of entrepreneurs has emerged who operate utility tractors for the benefit of small landowners.
Region with highest CAGR:
North America is projected to have the highest CAGR over the forecast period, owing to the quick technological advancement of utility tractors which is currently revolutionising agriculture in North America. Additionally, rising mechanisation in the agricultural sector, particularly in the US, and accelerating globalisation will pave the way for the growth of the utility tractor market in the region.

Key players in the market
Some of the key players profiled in the Utility Tractor Market include Mahindra and Mahindra Corporation, Kubota Corporation, Escorts Group, Tractors and Farm Equipment Limited (TAFE), Kuhn Group, Yanmar Company Limited, New Holland Agriculture, JCB India Limited, SDF S.p.A., Bucher Industries AG, Alamo Group Inc, Deere and Company, CNH Global NV, AGCO Corporation and CLAAS KGaA mbH.
Key Developments:
In September 2021, IVECO a subsidiary of CNH Industrial and Nikola inaugurates joint venture manufactured facility for heavy duty trucks ulm in Germany.
In June 2021, CNH Industrial acquires raven industries, enhancing precision agricultural capabilities and scale.
In October 2021, Mahindra and Mahindra Corporation launch 3 new Yuvo tech+ tractors.
Drive Types Covered:
• Pedestrian
• Wheeled
• Two-Wheelers
• Four-Wheelers
Engines Covered:
• Internal Combustion
• Electric
Applications Covered:
• Dairy farmland
• Hay and Agriculture Products
• Landscaping
• Construction/Maintenance
Regions Covered:
• North America
o US
o Canada
o Mexico
• Europe
o Germany
o UK
o Italy
o France
o Spain
o Rest of Europe
• Asia Pacific
o Japan
o China
o India
o Australia
o New Zealand
o South Korea
o Rest of Asia Pacific
• South America
o Argentina
o Brazil
o Chile
o Rest of South America
• Middle East & Africa
o Saudi Arabia
o UAE
o Qatar
o South Africa
o Rest of Middle East & Africa
What our report offers:
- Market share assessments for the regional and country-level segments
- Strategic recommendations for the new entrants
- Covers Market data for the years 2020, 2021, 2022, 2025, and 2028
- Market Trends (Drivers, Constraints, Opportunities, Threats, Challenges, Investment Opportunities, and recommendations)
- Strategic recommendations in key business segments based on the market estimations
- Competitive landscaping mapping the key common trends
- Company profiling with detailed strategies, financials, and recent developments
- Supply chain trends mapping the latest technological advancements
Free Customization Offerings:
All the customers of this report will be entitled to receive one of the following free customization options:
• Company Profiling
o Comprehensive profiling of additional market players (up to 3)
o SWOT Analysis of key players (up to 3)
• Regional Segmentation
o Market estimations, Forecasts and CAGR of any prominent country as per the client's interest (Note: Depends on feasibility check)
• Competitive Benchmarking
o Benchmarking of key players based on product portfolio, geographical presence, and strategic alliances
Table of Contents
1 Executive Summary
2 Preface
2.1 Abstract
2.2 Stake Holders
2.3 Research Scope
2.4 Research Methodology
2.4.1 Data Mining
2.4.2 Data Analysis
2.4.3 Data Validation
2.4.4 Research Approach
2.5 Research Sources
2.5.1 Primary Research Sources
2.5.2 Secondary Research Sources
2.5.3 Assumptions
3 Market Trend Analysis
3.1 Introduction
3.2 Drivers
3.3 Restraints
3.4 Opportunities
3.5 Threats
3.6 Application Analysis
3.7 Emerging Markets
3.8 Impact of Covid-19
4 Porters Five Force Analysis
4.1 Bargaining power of suppliers
4.2 Bargaining power of buyers
4.3 Threat of substitutes
4.4 Threat of new entrants
4.5 Competitive rivalry
5 Global Utility Tractor Market, By Drive Type
5.1 Introduction
5.2 Pedestrian
5.3 Wheeled
5.4 Two-Wheelers
5.5 Four-Wheelers
6 Global Utility Tractor Market, By Engine
6.1 Introduction
6.2 Internal Combustion
6.3 Electric
7 Global Utility Tractor Market, By Application
7.1 Introduction
7.2 Dairy farmland
7.3 Hay and Agriculture Products
7.4 Landscaping
7.5 Construction/Maintenance
8 Global Utility Tractor Market, By Geography
8.1 Introduction
8.2 North America
8.2.1 US
8.2.2 Canada
8.2.3 Mexico
8.3 Europe
8.3.1 Germany
8.3.2 UK
8.3.3 Italy
8.3.4 France
8.3.5 Spain
8.3.6 Rest of Europe
8.4 Asia Pacific
8.4.1 Japan
8.4.2 China
8.4.3 India
8.4.4 Australia
8.4.5 New Zealand
8.4.6 South Korea
8.4.7 Rest of Asia Pacific
8.5 South America
8.5.1 Argentina
8.5.2 Brazil
8.5.3 Chile
8.5.4 Rest of South America
8.6 Middle East & Africa
8.6.1 Saudi Arabia
8.6.2 UAE
8.6.3 Qatar
8.6.4 South Africa
8.6.5 Rest of Middle East & Africa
9 Key Developments
9.1 Agreements, Partnerships, Collaborations and Joint Ventures
9.2 Acquisitions & Mergers
9.3 New Product Launch
9.4 Expansions
9.5 Other Key Strategies
10 Company Profiling
10.1 Mahindra and Mahindra Corporation
10.2 Kubota Corporation
10.3 Escorts Group
10.4 Tractors and Farm Equipment Limited (TAFE)
10.5 Kuhn Group
10.6 Yanmar Company Limited
10.7 New Holland Agriculture
10.8 JCB India Limited
10.9 SDF S.p.A.
10.10 Bucher Industries AG
10.11 Alamo Group Inc
10.12 Deere and Company
10.13 CNH Global NV
10.14 AGCO Corporation
10.15 CLAAS KGaA mbH
List of Tables
1 Global Utility Tractor Market Outlook, By Region (2020-2028) ($MN)
2 Global Utility Tractor Market Outlook, By Drive Type (2020-2028) ($MN)
3 Global Utility Tractor Market Outlook, By Pedestrian (2020-2028) ($MN)
4 Global Utility Tractor Market Outlook, By Wheeled (2020-2028) ($MN)
5 Global Utility Tractor Market Outlook, By Two-Wheelers (2020-2028) ($MN)
6 Global Utility Tractor Market Outlook, By Four-Wheelers (2020-2028) ($MN)
7 Global Utility Tractor Market Outlook, By Engine (2020-2028) ($MN)
8 Global Utility Tractor Market Outlook, By Internal Combustion (2020-2028) ($MN)
9 Global Utility Tractor Market Outlook, By Electric (2020-2028) ($MN)
10 Global Utility Tractor Market Outlook, By Application (2020-2028) ($MN)
11 Global Utility Tractor Market Outlook, By Dairy farmland (2020-2028) ($MN)
12 Global Utility Tractor Market Outlook, By Hay and Agriculture Products (2020-2028) ($MN)
13 Global Utility Tractor Market Outlook, By Landscaping (2020-2028) ($MN)
14 Global Utility Tractor Market Outlook, By Construction/Maintenance (2020-2028) ($MN)
15 North America Automotive Semiconductor Market Outlook, By Country (2020-2028) ($MN)
16 North America Automotive Semiconductor Market Outlook, By Drive Type (2020-2028) ($MN)
17 North America Automotive Semiconductor Market Outlook, By Pedestrian (2020-2028) ($MN)
18 North America Automotive Semiconductor Market Outlook, By Wheeled (2020-2028) ($MN)
19 North America Automotive Semiconductor Market Outlook, By Two-Wheelers (2020-2028) ($MN)
20 North America Automotive Semiconductor Market Outlook, By Four-Wheelers (2020-2028) ($MN)
21 North America Automotive Semiconductor Market Outlook, By Engine (2020-2028) ($MN)
22 North America Automotive Semiconductor Market Outlook, By Internal Combustion (2020-2028) ($MN)
23 North America Automotive Semiconductor Market Outlook, By Electric (2020-2028) ($MN)
24 North America Automotive Semiconductor Market Outlook, By Application (2020-2028) ($MN)
25 North America Automotive Semiconductor Market Outlook, By Dairy farmland (2020-2028) ($MN)
26 North America Automotive Semiconductor Market Outlook, By Hay and Agriculture Products (2020-2028) ($MN)
27 North America Automotive Semiconductor Market Outlook, By Landscaping (2020-2028) ($MN)
28 North America Automotive Semiconductor Market Outlook, By Construction/Maintenance (2020-2028) ($MN)
29 Europe Automotive Semiconductor Market Outlook, By Country (2020-2028) ($MN)
30 Europe Automotive Semiconductor Market Outlook, By Drive Type (2020-2028) ($MN)
31 Europe Automotive Semiconductor Market Outlook, By Pedestrian (2020-2028) ($MN)
32 Europe Automotive Semiconductor Market Outlook, By Wheeled (2020-2028) ($MN)
33 Europe Automotive Semiconductor Market Outlook, By Two-Wheelers (2020-2028) ($MN)
34 Europe Automotive Semiconductor Market Outlook, By Four-Wheelers (2020-2028) ($MN)
35 Europe Automotive Semiconductor Market Outlook, By Engine (2020-2028) ($MN)
36 Europe Automotive Semiconductor Market Outlook, By Internal Combustion (2020-2028) ($MN)
37 Europe Automotive Semiconductor Market Outlook, By Electric (2020-2028) ($MN)
38 Europe Automotive Semiconductor Market Outlook, By Application (2020-2028) ($MN)
39 Europe Automotive Semiconductor Market Outlook, By Dairy farmland (2020-2028) ($MN)
40 Europe Automotive Semiconductor Market Outlook, By Hay and Agriculture Products (2020-2028) ($MN)
41 Europe Automotive Semiconductor Market Outlook, By Landscaping (2020-2028) ($MN)
42 Europe Automotive Semiconductor Market Outlook, By Construction/Maintenance (2020-2028) ($MN)
43 Asia Pacific Automotive Semiconductor Market Outlook, By Country (2020-2028) ($MN)
44 Asia Pacific Automotive Semiconductor Market Outlook, By Drive Type (2020-2028) ($MN)
45 Asia Pacific Automotive Semiconductor Market Outlook, By Pedestrian (2020-2028) ($MN)
46 Asia Pacific Automotive Semiconductor Market Outlook, By Wheeled (2020-2028) ($MN)
47 Asia Pacific Automotive Semiconductor Market Outlook, By Two-Wheelers (2020-2028) ($MN)
48 Asia Pacific Automotive Semiconductor Market Outlook, By Four-Wheelers (2020-2028) ($MN)
49 Asia Pacific Automotive Semiconductor Market Outlook, By Engine (2020-2028) ($MN)
50 Asia Pacific Automotive Semiconductor Market Outlook, By Internal Combustion (2020-2028) ($MN)
51 Asia Pacific Automotive Semiconductor Market Outlook, By Electric (2020-2028) ($MN)
52 Asia Pacific Automotive Semiconductor Market Outlook, By Application (2020-2028) ($MN)
53 Asia Pacific Automotive Semiconductor Market Outlook, By Dairy farmland (2020-2028) ($MN)
54 Asia Pacific Automotive Semiconductor Market Outlook, By Hay and Agriculture Products (2020-2028) ($MN)
55 Asia Pacific Automotive Semiconductor Market Outlook, By Landscaping (2020-2028) ($MN)
56 Asia Pacific Automotive Semiconductor Market Outlook, By Construction/Maintenance (2020-2028) ($MN)
57 South America Automotive Semiconductor Market Outlook, By Country (2020-2028) ($MN)
58 South America Automotive Semiconductor Market Outlook, By Drive Type (2020-2028) ($MN)
59 South America Automotive Semiconductor Market Outlook, By Pedestrian (2020-2028) ($MN)
60 South America Automotive Semiconductor Market Outlook, By Wheeled (2020-2028) ($MN)
61 South America Automotive Semiconductor Market Outlook, By Two-Wheelers (2020-2028) ($MN)
62 South America Automotive Semiconductor Market Outlook, By Four-Wheelers (2020-2028) ($MN)
63 South America Automotive Semiconductor Market Outlook, By Engine (2020-2028) ($MN)
64 South America Automotive Semiconductor Market Outlook, By Internal Combustion (2020-2028) ($MN)
65 South America Automotive Semiconductor Market Outlook, By Electric (2020-2028) ($MN)
66 South America Automotive Semiconductor Market Outlook, By Application (2020-2028) ($MN)
67 South America Automotive Semiconductor Market Outlook, By Dairy farmland (2020-2028) ($MN)
68 South America Automotive Semiconductor Market Outlook, By Hay and Agriculture Products (2020-2028) ($MN)
69 South America Automotive Semiconductor Market Outlook, By Landscaping (2020-2028) ($MN)
70 South America Automotive Semiconductor Market Outlook, By Construction/Maintenance (2020-2028) ($MN)
71 Middle East & Africa Automotive Semiconductor Market Outlook, By Country (2020-2028) ($MN)
72 Middle East & Africa Automotive Semiconductor Market Outlook, By Drive Type (2020-2028) ($MN)
73 Middle East & Africa Automotive Semiconductor Market Outlook, By Pedestrian (2020-2028) ($MN)
74 Middle East & Africa Automotive Semiconductor Market Outlook, By Wheeled (2020-2028) ($MN)
75 Middle East & Africa Automotive Semiconductor Market Outlook, By Two-Wheelers (2020-2028) ($MN)
76 Middle East & Africa Automotive Semiconductor Market Outlook, By Four-Wheelers (2020-2028) ($MN)
77 Middle East & Africa Automotive Semiconductor Market Outlook, By Engine (2020-2028) ($MN)
78 Middle East & Africa Automotive Semiconductor Market Outlook, By Internal Combustion (2020-2028) ($MN)
79 Middle East & Africa Automotive Semiconductor Market Outlook, By Electric (2020-2028) ($MN)
80 Middle East & Africa Automotive Semiconductor Market Outlook, By Application (2020-2028) ($MN)
81 Middle East & Africa Automotive Semiconductor Market Outlook, By Dairy farmland (2020-2028) ($MN)
82 Middle East & Africa Automotive Semiconductor Market Outlook, By Hay and Agriculture Products (2020-2028) ($MN)
83 Middle East & Africa Automotive Semiconductor Market Outlook, By Landscaping (2020-2028) ($MN)
84 Middle East & Africa Automotive Semiconductor Market Outlook, By Construction/Maintenance (2020-2028) ($MN)
List of Figures
RESEARCH METHODOLOGY

We at ‘Stratistics’ opt for an extensive research approach which involves data mining, data validation, and data analysis. The various research sources include in-house repository, secondary research, competitor’s sources, social media research, client internal data, and primary research.
Our team of analysts prefers the most reliable and authenticated data sources in order to perform the comprehensive literature search. With access to most of the authenticated data bases our team highly considers the best mix of information through various sources to obtain extensive and accurate analysis.
Each report takes an average time of a month and a team of 4 industry analysts. The time may vary depending on the scope and data availability of the desired market report. The various parameters used in the market assessment are standardized in order to enhance the data accuracy.
Data Mining
The data is collected from several authenticated, reliable, paid and unpaid sources and is filtered depending on the scope & objective of the research. Our reports repository acts as an added advantage in this procedure. Data gathering from the raw material suppliers, distributors and the manufacturers is performed on a regular basis, this helps in the comprehensive understanding of the products value chain. Apart from the above mentioned sources the data is also collected from the industry consultants to ensure the objective of the study is in the right direction.
Market trends such as technological advancements, regulatory affairs, market dynamics (Drivers, Restraints, Opportunities and Challenges) are obtained from scientific journals, market related national & international associations and organizations.
Data Analysis
From the data that is collected depending on the scope & objective of the research the data is subjected for the analysis. The critical steps that we follow for the data analysis include:
- Product Lifecycle Analysis
- Competitor analysis
- Risk analysis
- Porters Analysis
- PESTEL Analysis
- SWOT Analysis
The data engineering is performed by the core industry experts considering both the Marketing Mix Modeling and the Demand Forecasting. The marketing mix modeling makes use of multiple-regression techniques to predict the optimal mix of marketing variables. Regression factor is based on a number of variables and how they relate to an outcome such as sales or profits.
Data Validation
The data validation is performed by the exhaustive primary research from the expert interviews. This includes telephonic interviews, focus groups, face to face interviews, and questionnaires to validate our research from all aspects. The industry experts we approach come from the leading firms, involved in the supply chain ranging from the suppliers, distributors to the manufacturers and consumers so as to ensure an unbiased analysis.
We are in touch with more than 15,000 industry experts with the right mix of consultants, CEO's, presidents, vice presidents, managers, experts from both supply side and demand side, executives and so on.
The data validation involves the primary research from the industry experts belonging to:
- Leading Companies
- Suppliers & Distributors
- Manufacturers
- Consumers
- Industry/Strategic Consultants
Apart from the data validation the primary research also helps in performing the fill gap research, i.e. providing solutions for the unmet needs of the research which helps in enhancing the reports quality.
For more details about research methodology, kindly write to us at info@strategymrc.com
Frequently Asked Questions
In case of any queries regarding this report, you can contact the customer service by filing the “Inquiry Before Buy” form available on the right hand side. You may also contact us through email: info@strategymrc.com or phone: +1-301-202-5929
Yes, the samples are available for all the published reports. You can request them by filling the “Request Sample” option available in this page.
Yes, you can request a sample with your specific requirements. All the customized samples will be provided as per the requirement with the real data masked.
All our reports are available in Digital PDF format. In case if you require them in any other formats, such as PPT, Excel etc you can submit a request through “Inquiry Before Buy” form available on the right hand side. You may also contact us through email: info@strategymrc.com or phone: +1-301-202-5929
We offer a free 15% customization with every purchase. This requirement can be fulfilled for both pre and post sale. You may send your customization requirements through email at info@strategymrc.com or call us on +1-301-202-5929.
We have 3 different licensing options available in electronic format.
- Single User Licence: Allows one person, typically the buyer, to have access to the ordered product. The ordered product cannot be distributed to anyone else.
- 2-5 User Licence: Allows the ordered product to be shared among a maximum of 5 people within your organisation.
- Corporate License: Allows the product to be shared among all employees of your organisation regardless of their geographical location.
All our reports are typically be emailed to you as an attachment.
To order any available report you need to register on our website. The payment can be made either through CCAvenue or PayPal payments gateways which accept all international cards.
We extend our support to 6 months post sale. A post sale customization is also provided to cover your unmet needs in the report.
Request Customization
We offer complimentary customization of up to 15% with every purchase. To share your customization requirements, feel free to email us at info@strategymrc.com or call us on +1-301-202-5929. .
Please Note: Customization within the 15% threshold is entirely free of charge. If your request exceeds this limit, we will conduct a feasibility assessment. Following that, a detailed quote and timeline will be provided.
WHY CHOOSE US ?

Assured Quality
Best in class reports with high standard of research integrity

24X7 Research Support
Continuous support to ensure the best customer experience.

Free Customization
Adding more values to your product of interest.

Safe & Secure Access
Providing a secured environment for all online transactions.

Trusted by 600+ Brands
Serving the most reputed brands across the world.