
Virtual Tour Software Market
Virtual Tour Software Market Forecasts to 2028 - Global Analysis By Device Type (Head Mounted, and Gesture Tracking), Deployment (Cloud and On-Premises), End User (Automotive, Real Estate and Other End Users) and By Geography

|
Years Covered |
2020-2028 |
|
Estimated Year Value (2022) |
US $354.83 MN |
|
Projected Year Value (2028) |
US $1070.15 MN |
|
CAGR (2022 - 2028) |
20.2% |
|
Regions Covered |
North America, Europe, Asia Pacific, South America, and Middle East & Africa |
|
Countries Covered |
US, Canada, Mexico, Germany, UK, Italy, France, Spain, Japan, China, India, Australia, New Zealand, South Korea, Rest of Asia Pacific, South America, Argentina, Brazil, Chile, Middle East & Africa, Saudi Arabia, UAE, Qatar, and South Africa |
|
Largest Market |
Asia Pacific |
|
Highest Growing Market |
North America |
According to Stratistics MRC, the Global Virtual Tour Software Market is accounted for $354.83 million in 2022 and is expected to reach $1070.15 million by 2028 growing at a CAGR of 20.2% during the forecast period. Travel agencies and tour operators are used by the virtual tour software to create virtual visualisations of tourist sites. Tourism businesses use virtual visualisations to accurately depict traveller locations to customers. Internet content managers that like merging virtual tours on websites or online portals utilise this software with the help of sales and advertising groups for promotional purposes. Businesses can save money by using virtual tour software instead of engaging professional videographers to make digital tours.
According to the National Association of Realtors in the U.S., virtual tours have received more than 87% more views than those without 360 virtual tours. In addition, more than 50% of buyers would not prefer to visit the website to shortlist the property if they don't provide a 360 virtual tour.
Market Dynamics:
Driver:
Increasing Technological Advancements
Virtual reality offers a wider range of industrial applications because to technological advancement. The software that supports destination-based marketing is one of the expanding uses of virtual reality. This software is being widely adopted by numerous industries as a new marketing tactic to improve consumer interaction, including education, automotive, manufacturing, security, real estate, tourism, and hospitality. Through the virtual solution and increased interactive sessions, the marketing approach is anticipated to enhance consumer experience.
Restraint:
Lack of awareness and information to Customers
All potential clients can browse and access the information thanks to the programme. Customers can only see a restricted amount of data from end users including educational institutions, real estate, tourism, and hospitality. Customers may only have limited access to the nearby locations' data. Tour operators might not be able to offer or limit the regions they might not wish to highlight. This is anticipated to have a detrimental effect on market expansion.
Opportunity:
Rising adoption of AI-assisted Chabot virtual tours
Virtual tours based on AI and cloud computing are being adopted by a number of businesses in a number of sectors, including automotive, real estate, education, and healthcare. For the purpose of providing product promotions, major market companies are utilising methods like mergers, acquisitions, and partnerships to adopt cutting-edge technology like A.I., cloud computing, and analytics tools.
Threat:
High interaction costs
Many agents only employ digital tours on their ultra-luxury offerings due to the hefty price tags. A digital tour can only be created by agents for the most expensive properties. Due to this, not everyone can benefit from digital tour promotion. For generating digital tours, several virtual tour firms demand astronomically high prices. Virtual tours created by businesses cost a lot of money.
Covid-19 Impact
In order to stop the coronavirus from spreading during the COVID-19 pandemic, a number of manufacturing facilities and building projects have been put on hold. Consumers and businesses have been compelled by this pandemic to adopt cutting-edge technologies like virtual reality and software for virtual product tours. Additionally, numerous real estate owners were advertising their apartments and homes on a virtual reality 360-degree platform during the pandemic.
The cloud segment is expected to be the largest during the forecast period
The cloud segment is estimated to have a lucrative growth, due to the accessibility of cloud-based tour software from anywhere in the world, the increase is mostly attributable to the increasing acceptance of advanced technology-enabled tour software in the real estate, educational institutions, tourist, and hospitality industries. A cloud-based platform for virtual tours of historical sites, hotels, and real estate properties is being developed by a number of the industry's top companies. Additionally, growing enterprise cloud spending has accelerated the adoption of cloud-based virtual tour software.
The real estate segment is expected to have the highest CAGR during the forecast period
The real estate segment is anticipated to witness the fastest CAGR growth during the forecast period, due to the growing desire from home buyers to list residential properties online via virtual tours, it is anticipated to expand at a notable CAGR throughout the projection period. Before contacting an agent or visiting any residential homes, the majority of home buyers conduct their research online, according to Matter port.
Region with highest share:
Asia Pacific is projected to hold the largest market share during the forecast period. It is anticipated to continue to dominate the virtual tour business, accounting for more than two-fifths of the global market. This is because more companies are investing in virtual tours thanks to the growth of the IoT (Internet of Things) and the planning of events like product launches and shows, among other things. However, LAMEA is anticipated to experience the quickest CAGR over the forecast period due to an increase in advertising and marketing investments from major companies and a rise in demand for online events.
Region with highest CAGR:
North America is projected to have the highest CAGR over the forecast period, making it the mind-boggling nation in the market for virtual tour software. The enhancement would be made possible by marketing analysis tools and by current players who have genuinely grown used to the market over time. Despite this, business associations, outcast leaders, etc. are focusing their efforts on producing customer-driven products that will further contribute to the development in this field. The market for virtual tour software is likely to experience fundamental growth as a result of increasing revenue, increased compensation, pattern-setting advancement, and invention, along with initiatives to promote awareness of the demand.

Key players in the market
Some of the key players profiled in the Virtual Tour Software Market include Concept3D, Inc., Klapty, Kuula LLC, CloudPano, RTV, Inc., Matter-port, Inc., Eyespy360, 3DVista Stitcher, Roundme Limited, Matterport, Kolor, SeekBeak and Real Tour Vision
Key Developments:
In June 2022, Concept3D, Inc. announced a partnership with a higher education engagement hub, Pathify, to offer campus tours through virtual mapping.
April 2022, Washington-based Mass Interact teamed up with Full Measure Education, to offer virtual tour solution to enhance campus visits. The partnership aims to improve students’ enrolment and retention, increasing search ability, tailored virtual experience, and more.
In March 2022, Concept3D, Inc. announced a strategic collaboration with PlatformQ Education, a software development company, to integrate Concept3D and PlatformQ solution capabilities. The partnership is expected to expand virtual touring along with enhancing virtual experience.
In July 2021, Kuula LLC announced a partnership with Angola-based real estate, AngoCasa, to incorporate virtual tours into its properties.
In May 2021, EyeSpy360 announced collaboration with real estate sales and marketing developer, Chime, to provide its virtual tour content. The company integrated its software with website management tool of Chime that offers live tours and virtual walk-in.
Device Types Covered:
• Head Mounted
• Gesture Tracking
Deployments Covered:
• Cloud
• On-Premises
End Users Covered:
• Automotive
• Real Estate
• Tourism & Hospitality
• Education
• Healthcare
• Other End Users
Regions Covered:
• North America
o US
o Canada
o Mexico
• Europe
o Germany
o UK
o Italy
o France
o Spain
o Rest of Europe
• Asia Pacific
o Japan
o China
o India
o Australia
o New Zealand
o South Korea
o Rest of Asia Pacific
• South America
o Argentina
o Brazil
o Chile
o Rest of South America
• Middle East & Africa
o Saudi Arabia
o UAE
o Qatar
o South Africa
o Rest of Middle East & Africa
What our report offers:
- Market share assessments for the regional and country-level segments
- Strategic recommendations for the new entrants
- Covers Market data for the years 2020, 2021, 2022, 2025, and 2028
- Market Trends (Drivers, Constraints, Opportunities, Threats, Challenges, Investment Opportunities, and recommendations)
- Strategic recommendations in key business segments based on the market estimations
- Competitive landscaping mapping the key common trends
- Company profiling with detailed strategies, financials, and recent developments
- Supply chain trends mapping the latest technological advancements
Free Customization Offerings:
All the customers of this report will be entitled to receive one of the following free customization options:
• Company Profiling
o Comprehensive profiling of additional market players (up to 3)
o SWOT Analysis of key players (up to 3)
• Regional Segmentation
o Market estimations, Forecasts and CAGR of any prominent country as per the client's interest (Note: Depends on feasibility check)
• Competitive Benchmarking
o Benchmarking of key players based on product portfolio, geographical presence, and strategic alliances
Table of Contents
1 Executive Summary
2 Preface
2.1 Abstract
2.2 Stake Holders
2.3 Research Scope
2.4 Research Methodology
2.4.1 Data Mining
2.4.2 Data Analysis
2.4.3 Data Validation
2.4.4 Research Approach
2.5 Research Sources
2.5.1 Primary Research Sources
2.5.2 Secondary Research Sources
2.5.3 Assumptions
3 Market Trend Analysis
3.1 Introduction
3.2 Drivers
3.3 Restraints
3.4 Opportunities
3.5 Threats
3.6 End User Analysis
3.7 Emerging Markets
3.8 Impact of Covid-19
4 Porters Five Force Analysis
4.1 Bargaining power of suppliers
4.2 Bargaining power of buyers
4.3 Threat of substitutes
4.4 Threat of new entrants
4.5 Competitive rivalry
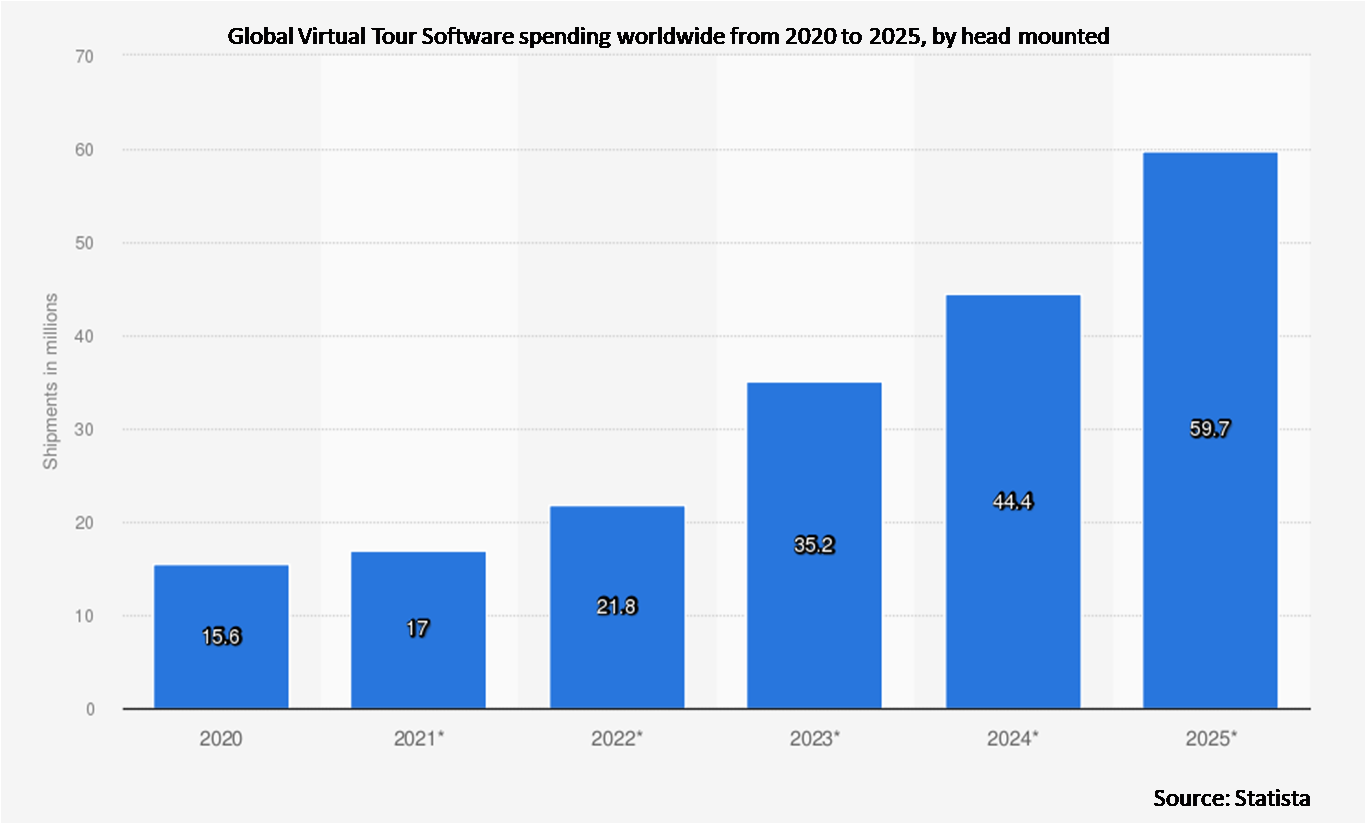
5 Global Virtual Tour Software Market, By Device Type
5.1 Introduction
5.2 Head Mounted
5.3 Gesture Tracking
6 Global Virtual Tour Software Market, By Deployment
6.1 Introduction
6.2 Cloud
6.3 On-Premises
7 Global Virtual Tour Software Market, By End User
7.1 Introduction
7.2 Automotive
7.3 Real Estate
7.4 Tourism & Hospitality
7.5 Education
7.6 Healthcare
7.7 Other End Users
8 Global Virtual Tour Software Market, By Geography
8.1 Introduction
8.2 North America
8.2.1 US
8.2.2 Canada
8.2.3 Mexico
8.3 Europe
8.3.1 Germany
8.3.2 UK
8.3.3 Italy
8.3.4 France
8.3.5 Spain
8.3.6 Rest of Europe
8.4 Asia Pacific
8.4.1 Japan
8.4.2 China
8.4.3 India
8.4.4 Australia
8.4.5 New Zealand
8.4.6 South Korea
8.4.7 Rest of Asia Pacific
8.5 South America
8.5.1 Argentina
8.5.2 Brazil
8.5.3 Chile
8.5.4 Rest of South America
8.6 Middle East & Africa
8.6.1 Saudi Arabia
8.6.2 UAE
8.6.3 Qatar
8.6.4 South Africa
8.6.5 Rest of Middle East & Africa
9 Key Developments
9.1 Agreements, Partnerships, Collaborations and Joint Ventures
9.2 Acquisitions & Mergers
9.3 New Product Launch
9.4 Expansions
9.5 Other Key Strategies
10 Company Profiling
10.1 Concept3D, Inc.
10.2 Klapty
10.3 Kuula LLC
10.4 CloudPano
10.5 RTV, Inc.
10.6 Matterport, Inc.
10.7 Eyespy360
10.8 3DVista Stitcher
10.9 Roundme Limited
10.10 Matterport
10.11 Kolor
10.12 SeekBeak
10.13 Real Tour Vision
List of Tables
1 Global Virtual Tour Software Market Outlook, By Region (2020-2028) ($MN)
2 Global Virtual Tour Software Market Outlook, By Device Type (2020-2028) ($MN)
3 Global Virtual Tour Software Market Outlook, By Head Mounted (2020-2028) ($MN)
4 Global Virtual Tour Software Market Outlook, By Gesture Tracking (2020-2028) ($MN)
5 Global Virtual Tour Software Market Outlook, By Deployment (2020-2028) ($MN)
6 Global Virtual Tour Software Market Outlook, By Cloud (2020-2028) ($MN)
7 Global Virtual Tour Software Market Outlook, By On-Premises (2020-2028) ($MN)
8 Global Virtual Tour Software Market Outlook, By End User (2020-2028) ($MN)
9 Global Virtual Tour Software Market Outlook, By Automotive (2020-2028) ($MN)
10 Global Virtual Tour Software Market Outlook, By Real Estate (2020-2028) ($MN)
11 Global Virtual Tour Software Market Outlook, By Tourism & Hospitality (2020-2028) ($MN)
12 Global Virtual Tour Software Market Outlook, By Education (2020-2028) ($MN)
13 Global Virtual Tour Software Market Outlook, By Healthcare (2020-2028) ($MN)
14 Global Virtual Tour Software Market Outlook, By Other End Users (2020-2028) ($MN)
15 North America Virtual Tour Software Market Outlook, By Country (2020-2028) ($MN)
16 North America Virtual Tour Software Market Outlook, By Device Type (2020-2028) ($MN)
17 North America Virtual Tour Software Market Outlook, By Head Mounted (2020-2028) ($MN)
18 North America Virtual Tour Software Market Outlook, By Gesture Tracking (2020-2028) ($MN)
19 North America Virtual Tour Software Market Outlook, By Deployment (2020-2028) ($MN)
20 North America Virtual Tour Software Market Outlook, By Cloud (2020-2028) ($MN)
21 North America Virtual Tour Software Market Outlook, By On-Premises (2020-2028) ($MN)
22 North America Virtual Tour Software Market Outlook, By End User (2020-2028) ($MN)
23 North America Virtual Tour Software Market Outlook, By Automotive (2020-2028) ($MN)
24 North America Virtual Tour Software Market Outlook, By Real Estate (2020-2028) ($MN)
25 North America Virtual Tour Software Market Outlook, By Tourism & Hospitality (2020-2028) ($MN)
26 North America Virtual Tour Software Market Outlook, By Education (2020-2028) ($MN)
27 North America Virtual Tour Software Market Outlook, By Healthcare (2020-2028) ($MN)
28 North America Virtual Tour Software Market Outlook, By Other End Users (2020-2028) ($MN)
29 Europe Virtual Tour Software Market Outlook, By Country (2020-2028) ($MN)
30 Europe Virtual Tour Software Market Outlook, By Device Type (2020-2028) ($MN)
31 Europe Virtual Tour Software Market Outlook, By Head Mounted (2020-2028) ($MN)
32 Europe Virtual Tour Software Market Outlook, By Gesture Tracking (2020-2028) ($MN)
33 Europe Virtual Tour Software Market Outlook, By Deployment (2020-2028) ($MN)
34 Europe Virtual Tour Software Market Outlook, By Cloud (2020-2028) ($MN)
35 Europe Virtual Tour Software Market Outlook, By On-Premises (2020-2028) ($MN)
36 Europe Virtual Tour Software Market Outlook, By End User (2020-2028) ($MN)
37 Europe Virtual Tour Software Market Outlook, By Automotive (2020-2028) ($MN)
38 Europe Virtual Tour Software Market Outlook, By Real Estate (2020-2028) ($MN)
39 Europe Virtual Tour Software Market Outlook, By Tourism & Hospitality (2020-2028) ($MN)
40 Europe Virtual Tour Software Market Outlook, By Education (2020-2028) ($MN)
41 Europe Virtual Tour Software Market Outlook, By Healthcare (2020-2028) ($MN)
42 Europe Virtual Tour Software Market Outlook, By Other End Users (2020-2028) ($MN)
43 Asia Pacific Virtual Tour Software Market Outlook, By Country (2020-2028) ($MN)
44 Asia Pacific Virtual Tour Software Market Outlook, By Device Type (2020-2028) ($MN)
45 Asia Pacific Virtual Tour Software Market Outlook, By Head Mounted (2020-2028) ($MN)
46 Asia Pacific Virtual Tour Software Market Outlook, By Gesture Tracking (2020-2028) ($MN)
47 Asia Pacific Virtual Tour Software Market Outlook, By Deployment (2020-2028) ($MN)
48 Asia Pacific Virtual Tour Software Market Outlook, By Cloud (2020-2028) ($MN)
49 Asia Pacific Virtual Tour Software Market Outlook, By On-Premises (2020-2028) ($MN)
50 Asia Pacific Virtual Tour Software Market Outlook, By End User (2020-2028) ($MN)
51 Asia Pacific Virtual Tour Software Market Outlook, By Automotive (2020-2028) ($MN)
52 Asia Pacific Virtual Tour Software Market Outlook, By Real Estate (2020-2028) ($MN)
53 Asia Pacific Virtual Tour Software Market Outlook, By Tourism & Hospitality (2020-2028) ($MN)
54 Asia Pacific Virtual Tour Software Market Outlook, By Education (2020-2028) ($MN)
55 Asia Pacific Virtual Tour Software Market Outlook, By Healthcare (2020-2028) ($MN)
56 Asia Pacific Virtual Tour Software Market Outlook, By Other End Users (2020-2028) ($MN)
57 South America Virtual Tour Software Market Outlook, By Country (2020-2028) ($MN)
58 South America Virtual Tour Software Market Outlook, By Device Type (2020-2028) ($MN)
59 South America Virtual Tour Software Market Outlook, By Head Mounted (2020-2028) ($MN)
60 South America Virtual Tour Software Market Outlook, By Gesture Tracking (2020-2028) ($MN)
61 South America Virtual Tour Software Market Outlook, By Deployment (2020-2028) ($MN)
62 South America Virtual Tour Software Market Outlook, By Cloud (2020-2028) ($MN)
63 South America Virtual Tour Software Market Outlook, By On-Premises (2020-2028) ($MN)
64 South America Virtual Tour Software Market Outlook, By End User (2020-2028) ($MN)
65 South America Virtual Tour Software Market Outlook, By Automotive (2020-2028) ($MN)
66 South America Virtual Tour Software Market Outlook, By Real Estate (2020-2028) ($MN)
67 South America Virtual Tour Software Market Outlook, By Tourism & Hospitality (2020-2028) ($MN)
68 South America Virtual Tour Software Market Outlook, By Education (2020-2028) ($MN)
69 South America Virtual Tour Software Market Outlook, By Healthcare (2020-2028) ($MN)
70 South America Virtual Tour Software Market Outlook, By Other End Users (2020-2028) ($MN)
71 Middle East & Africa Virtual Tour Software Market Outlook, By Country (2020-2028) ($MN)
72 Middle East & Africa Virtual Tour Software Market Outlook, By Device Type (2020-2028) ($MN)
73 Middle East & Africa Virtual Tour Software Market Outlook, By Head Mounted (2020-2028) ($MN)
74 Middle East & Africa Virtual Tour Software Market Outlook, By Gesture Tracking (2020-2028) ($MN)
75 Middle East & Africa Virtual Tour Software Market Outlook, By Deployment (2020-2028) ($MN)
76 Middle East & Africa Virtual Tour Software Market Outlook, By Cloud (2020-2028) ($MN)
77 Middle East & Africa Virtual Tour Software Market Outlook, By On-Premises (2020-2028) ($MN)
78 Middle East & Africa Virtual Tour Software Market Outlook, By End User (2020-2028) ($MN)
79 Middle East & Africa Virtual Tour Software Market Outlook, By Automotive (2020-2028) ($MN)
80 Middle East & Africa Virtual Tour Software Market Outlook, By Real Estate (2020-2028) ($MN)
81 Middle East & Africa Virtual Tour Software Market Outlook, By Tourism & Hospitality (2020-2028) ($MN)
82 Middle East & Africa Virtual Tour Software Market Outlook, By Education (2020-2028) ($MN)
83 Middle East & Africa Virtual Tour Software Market Outlook, By Healthcare (2020-2028) ($MN)
84 Middle East & Africa Virtual Tour Software Market Outlook, By Other End Users (2020-2028) ($MN)
List of Figures
RESEARCH METHODOLOGY

We at ‘Stratistics’ opt for an extensive research approach which involves data mining, data validation, and data analysis. The various research sources include in-house repository, secondary research, competitor’s sources, social media research, client internal data, and primary research.
Our team of analysts prefers the most reliable and authenticated data sources in order to perform the comprehensive literature search. With access to most of the authenticated data bases our team highly considers the best mix of information through various sources to obtain extensive and accurate analysis.
Each report takes an average time of a month and a team of 4 industry analysts. The time may vary depending on the scope and data availability of the desired market report. The various parameters used in the market assessment are standardized in order to enhance the data accuracy.
Data Mining
The data is collected from several authenticated, reliable, paid and unpaid sources and is filtered depending on the scope & objective of the research. Our reports repository acts as an added advantage in this procedure. Data gathering from the raw material suppliers, distributors and the manufacturers is performed on a regular basis, this helps in the comprehensive understanding of the products value chain. Apart from the above mentioned sources the data is also collected from the industry consultants to ensure the objective of the study is in the right direction.
Market trends such as technological advancements, regulatory affairs, market dynamics (Drivers, Restraints, Opportunities and Challenges) are obtained from scientific journals, market related national & international associations and organizations.
Data Analysis
From the data that is collected depending on the scope & objective of the research the data is subjected for the analysis. The critical steps that we follow for the data analysis include:
- Product Lifecycle Analysis
- Competitor analysis
- Risk analysis
- Porters Analysis
- PESTEL Analysis
- SWOT Analysis
The data engineering is performed by the core industry experts considering both the Marketing Mix Modeling and the Demand Forecasting. The marketing mix modeling makes use of multiple-regression techniques to predict the optimal mix of marketing variables. Regression factor is based on a number of variables and how they relate to an outcome such as sales or profits.
Data Validation
The data validation is performed by the exhaustive primary research from the expert interviews. This includes telephonic interviews, focus groups, face to face interviews, and questionnaires to validate our research from all aspects. The industry experts we approach come from the leading firms, involved in the supply chain ranging from the suppliers, distributors to the manufacturers and consumers so as to ensure an unbiased analysis.
We are in touch with more than 15,000 industry experts with the right mix of consultants, CEO's, presidents, vice presidents, managers, experts from both supply side and demand side, executives and so on.
The data validation involves the primary research from the industry experts belonging to:
- Leading Companies
- Suppliers & Distributors
- Manufacturers
- Consumers
- Industry/Strategic Consultants
Apart from the data validation the primary research also helps in performing the fill gap research, i.e. providing solutions for the unmet needs of the research which helps in enhancing the reports quality.
For more details about research methodology, kindly write to us at info@strategymrc.com
Frequently Asked Questions
In case of any queries regarding this report, you can contact the customer service by filing the “Inquiry Before Buy” form available on the right hand side. You may also contact us through email: info@strategymrc.com or phone: +1-301-202-5929
Yes, the samples are available for all the published reports. You can request them by filling the “Request Sample” option available in this page.
Yes, you can request a sample with your specific requirements. All the customized samples will be provided as per the requirement with the real data masked.
All our reports are available in Digital PDF format. In case if you require them in any other formats, such as PPT, Excel etc you can submit a request through “Inquiry Before Buy” form available on the right hand side. You may also contact us through email: info@strategymrc.com or phone: +1-301-202-5929
We offer a free 15% customization with every purchase. This requirement can be fulfilled for both pre and post sale. You may send your customization requirements through email at info@strategymrc.com or call us on +1-301-202-5929.
We have 3 different licensing options available in electronic format.
- Single User Licence: Allows one person, typically the buyer, to have access to the ordered product. The ordered product cannot be distributed to anyone else.
- 2-5 User Licence: Allows the ordered product to be shared among a maximum of 5 people within your organisation.
- Corporate License: Allows the product to be shared among all employees of your organisation regardless of their geographical location.
All our reports are typically be emailed to you as an attachment.
To order any available report you need to register on our website. The payment can be made either through CCAvenue or PayPal payments gateways which accept all international cards.
We extend our support to 6 months post sale. A post sale customization is also provided to cover your unmet needs in the report.
Request Customization
We offer complimentary customization of up to 15% with every purchase. To share your customization requirements, feel free to email us at info@strategymrc.com or call us on +1-301-202-5929. .
Please Note: Customization within the 15% threshold is entirely free of charge. If your request exceeds this limit, we will conduct a feasibility assessment. Following that, a detailed quote and timeline will be provided.
WHY CHOOSE US ?

Assured Quality
Best in class reports with high standard of research integrity

24X7 Research Support
Continuous support to ensure the best customer experience.

Free Customization
Adding more values to your product of interest.

Safe & Secure Access
Providing a secured environment for all online transactions.

Trusted by 600+ Brands
Serving the most reputed brands across the world.