
Aluminium Flat Products Market
Aluminium Flat Products - Global Market Outlook (2019-2027)
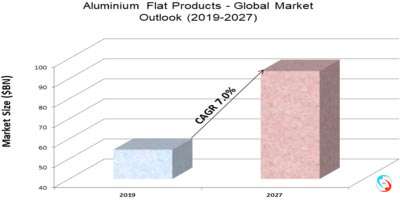
According to Stratistics MRC, the Global Aluminium Flat Products Market is accounted for $54.60 billion in 2019 and is expected to reach $93.81 billion by 2027 growing at a CAGR of 7.0% during the forecast period. Increasing demand in the construction industry, government guidelines to promote lightweight materials in the automotive industry, and increasing penetration of aluminium in vehicles on account of its lightweight properties are some of the factors propelling the growth of the market. However, volatility in raw material prices is hampering the growth of the market.
Aluminium and its various alloy products are lightweight in nature and also have characteristics such as corrosion resistance, ductility, and high strength. Aluminium flat products are produced from flat rolling processing method which turns an aluminium ingot known as slab into the thinner product or a plate. These aluminium flat products also show excellent flexibility and rigidity with a reduction in temperature.
Based on the end-user, the automotive & transportation segment is anticipated to hold considerable market share during the forecast period owing to the increasing use of these products in aircraft and vehicles on account of its lightweight properties and replacement of old models with modern and fuel-efficient models by many air transportation companies. By geography, Europe is expected to grow at a significant market share during the forecast period due to the growing penetration of electric vehicles to reduce greenhouse gas emission and contributing towards climate change and expansion of manufacturing units by the key players.
Some of the key players profiled in the Aluminium Flat Products Market include National Aluminum Company Limited (NALCO), Alcoa Corporation, UACJ Corporation Maharashtra Metal, Rusal, Novelis, Aleris Corporation, Logan Aluminum, Kaiser Aluminum, JW Aluminum, Hindalco Industries Limited, Granges Innovative Aluminum Engineering, Elvalhalcor Hellenic Copper and Aluminum Industry S.A., Constellium, Arconic, and Norsk Hydro.
Products Covered:
• Sheets
• Foil Stock
• Plates
• Fin Stock
• Circles
• Flat Bars
End Users Covered:
• Building & Infrastructure
• Packaging
• Equipment & Machinery
• Consumer Goods
• Automotive & Transportation
• Electrical & Electronics
Regions Covered:
• North America
o US
o Canada
o Mexico
• Europe
o Germany
o UK
o Italy
o France
o Spain
o Rest of Europe
• Asia Pacific
o Japan
o China
o India
o Australia
o New Zealand
o South Korea
o Rest of Asia Pacific
• South America
o Argentina
o Brazil
o Chile
o Rest of South America
• Middle East & Africa
o Saudi Arabia
o UAE
o Qatar
o South Africa
o Rest of Middle East & Africa
What our report offers:
- Market share assessments for the regional and country-level segments
- Strategic recommendations for the new entrants
- Covers Market data for the years 2018, 2019, 2020, 2024 and 2027
- Market Trends (Drivers, Constraints, Opportunities, Threats, Challenges, Investment Opportunities, and recommendations)
- Strategic recommendations in key business segments based on the market estimations
- Competitive landscaping mapping the key common trends
- Company profiling with detailed strategies, financials, and recent developments
- Supply chain trends mapping the latest technological advancements
Free Customization Offerings:
All the customers of this report will be entitled to receive one of the following free customization options:
• Company Profiling
o Comprehensive profiling of additional market players (up to 3)
o SWOT Analysis of key players (up to 3)
• Regional Segmentation
o Market estimations, Forecasts and CAGR of any prominent country as per the client's interest (Note: Depends on feasibility check)
• Competitive Benchmarking
o Benchmarking of key players based on product portfolio, geographical presence, and strategic alliances
Table of Contents
1 Executive Summary
2 Preface
2.1 Abstract
2.2 Stake Holders
2.3 Research Scope
2.4 Research Methodology
2.4.1 Data Mining
2.4.2 Data Analysis
2.4.3 Data Validation
2.4.4 Research Approach
2.5 Research Sources
2.5.1 Primary Research Sources
2.5.2 Secondary Research Sources
2.5.3 Assumptions
3 Market Trend Analysis
3.1 Introduction
3.2 Drivers
3.3 Restraints
3.4 Opportunities
3.5 Threats
3.6 Product Analysis
3.7 End User Analysis
3.8 Emerging Markets
3.9 Impact of Covid-19
4 Porters Five Force Analysis
4.1 Bargaining power of suppliers
4.2 Bargaining power of buyers
4.3 Threat of substitutes
4.4 Threat of new entrants
4.5 Competitive rivalry
5 Global Aluminium Flat Products Market, By Product
5.1 Introduction
5.2 Sheets
5.3 Foil Stock
5.4 Plates
5.5 Fin Stock
5.6 Circles
5.7 Flat Bars
6 Global Aluminium Flat Products Market, By End User
6.1 Introduction
6.2 Building & Infrastructure
6.2.1 Utilities
6.2.2 Transport Network
6.2.3 Residential
6.2.4 Commercial
6.3 Packaging
6.4 Equipment & Machinery
6.5 Consumer Goods
6.6 Automotive & Transportation
6.7 Electrical & Electronics
7 Global Aluminium Flat Products Market, By Geography
7.1 Introduction
7.2 North America
7.2.1 US
7.2.2 Canada
7.2.3 Mexico
7.3 Europe
7.3.1 Germany
7.3.2 UK
7.3.3 Italy
7.3.4 France
7.3.5 Spain
7.3.6 Rest of Europe
7.4 Asia Pacific
7.4.1 Japan
7.4.2 China
7.4.3 India
7.4.4 Australia
7.4.5 New Zealand
7.4.6 South Korea
7.4.7 Rest of Asia Pacific
7.5 South America
7.5.1 Argentina
7.5.2 Brazil
7.5.3 Chile
7.5.4 Rest of South America
7.6 Middle East & Africa
7.6.1 Saudi Arabia
7.6.2 UAE
7.6.3 Qatar
7.6.4 South Africa
7.6.5 Rest of Middle East & Africa
8 Key Developments
8.1 Agreements, Partnerships, Collaborations and Joint Ventures
8.2 Acquisitions & Mergers
8.3 New Product Launch
8.4 Expansions
8.5 Other Key Strategies
9 Company Profiling
9.1 National Aluminum Company Limited (NALCO)
9.2 Alcoa Corporation
9.3 UACJ Corporation Maharashtra Metal
9.4 Rusal
9.5 Novelis
9.6 Aleris Corporation
9.7 Logan Aluminum
9.8 Kaiser Aluminum
9.9 JW Aluminum
9.10 Hindalco Industries Limited
9.11 Granges Innovative Aluminum Engineering
9.12 Elvalhalcor Hellenic Copper and Aluminum Industry S.A.
9.13 Constellium
9.14 Arconic
9.15 Norsk Hydro
List of Tables
1 Global Aluminium Flat Products Market Outlook, By Region (2018-2027) ($MN)
2 Global Aluminium Flat Products Market Outlook, By Product (2018-2027) ($MN)
3 Global Aluminium Flat Products Market Outlook, By Sheets (2018-2027) ($MN)
4 Global Aluminium Flat Products Market Outlook, By Foil Stock (2018-2027) ($MN)
5 Global Aluminium Flat Products Market Outlook, By Plates (2018-2027) ($MN)
6 Global Aluminium Flat Products Market Outlook, By Fin Stock (2018-2027) ($MN)
7 Global Aluminium Flat Products Market Outlook, By Circles (2018-2027) ($MN)
8 Global Aluminium Flat Products Market Outlook, By Flat Bars (2018-2027) ($MN)
9 Global Aluminium Flat Products Market Outlook, By End User (2018-2027) ($MN)
10 Global Aluminium Flat Products Market Outlook, By Building & Infrastructure (2018-2027) ($MN)
11 Global Aluminium Flat Products Market Outlook, By Utilities (2018-2027) ($MN)
12 Global Aluminium Flat Products Market Outlook, By Transport Network (2018-2027) ($MN)
13 Global Aluminium Flat Products Market Outlook, By Residential (2018-2027) ($MN)
14 Global Aluminium Flat Products Market Outlook, By Commercial (2018-2027) ($MN)
15 Global Aluminium Flat Products Market Outlook, By Packaging (2018-2027) ($MN)
16 Global Aluminium Flat Products Market Outlook, By Equipment & Machinery (2018-2027) ($MN)
17 Global Aluminium Flat Products Market Outlook, By Consumer Goods (2018-2027) ($MN)
18 Global Aluminium Flat Products Market Outlook, By Automotive & Transportation (2018-2027) ($MN)
19 Global Aluminium Flat Products Market Outlook, By Electrical & Electronics (2018-2027) ($MN)
20 North America Aluminium Flat Products Market Outlook, By Country (2018-2027) ($MN)
21 North America Aluminium Flat Products Market Outlook, By Product (2018-2027) ($MN)
22 North America Aluminium Flat Products Market Outlook, By Sheets (2018-2027) ($MN)
23 North America Aluminium Flat Products Market Outlook, By Foil Stock (2018-2027) ($MN)
24 North America Aluminium Flat Products Market Outlook, By Plates (2018-2027) ($MN)
25 North America Aluminium Flat Products Market Outlook, By Fin Stock (2018-2027) ($MN)
26 North America Aluminium Flat Products Market Outlook, By Circles (2018-2027) ($MN)
27 North America Aluminium Flat Products Market Outlook, By Flat Bars (2018-2027) ($MN)
28 North America Aluminium Flat Products Market Outlook, By End User (2018-2027) ($MN)
29 North America Aluminium Flat Products Market Outlook, By Building & Infrastructure (2018-2027) ($MN)
30 North America Aluminium Flat Products Market Outlook, By Utilities (2018-2027) ($MN)
31 North America Aluminium Flat Products Market Outlook, By Transport Network (2018-2027) ($MN)
32 North America Aluminium Flat Products Market Outlook, By Residential (2018-2027) ($MN)
33 North America Aluminium Flat Products Market Outlook, By Commercial (2018-2027) ($MN)
34 North America Aluminium Flat Products Market Outlook, By Packaging (2018-2027) ($MN)
35 North America Aluminium Flat Products Market Outlook, By Equipment & Machinery (2018-2027) ($MN)
36 North America Aluminium Flat Products Market Outlook, By Consumer Goods (2018-2027) ($MN)
37 North America Aluminium Flat Products Market Outlook, By Automotive & Transportation (2018-2027) ($MN)
38 North America Aluminium Flat Products Market Outlook, By Electrical & Electronics (2018-2027) ($MN)
39 Europe Aluminium Flat Products Market Outlook, By Country (2018-2027) ($MN)
40 Europe Aluminium Flat Products Market Outlook, By Product (2018-2027) ($MN)
41 Europe Aluminium Flat Products Market Outlook, By Sheets (2018-2027) ($MN)
42 Europe Aluminium Flat Products Market Outlook, By Foil Stock (2018-2027) ($MN)
43 Europe Aluminium Flat Products Market Outlook, By Plates (2018-2027) ($MN)
44 Europe Aluminium Flat Products Market Outlook, By Fin Stock (2018-2027) ($MN)
45 Europe Aluminium Flat Products Market Outlook, By Circles (2018-2027) ($MN)
46 Europe Aluminium Flat Products Market Outlook, By Flat Bars (2018-2027) ($MN)
47 Europe Aluminium Flat Products Market Outlook, By End User (2018-2027) ($MN)
48 Europe Aluminium Flat Products Market Outlook, By Building & Infrastructure (2018-2027) ($MN)
49 Europe Aluminium Flat Products Market Outlook, By Utilities (2018-2027) ($MN)
50 Europe Aluminium Flat Products Market Outlook, By Transport Network (2018-2027) ($MN)
51 Europe Aluminium Flat Products Market Outlook, By Residential (2018-2027) ($MN)
52 Europe Aluminium Flat Products Market Outlook, By Commercial (2018-2027) ($MN)
53 Europe Aluminium Flat Products Market Outlook, By Packaging (2018-2027) ($MN)
54 Europe Aluminium Flat Products Market Outlook, By Equipment & Machinery (2018-2027) ($MN)
55 Europe Aluminium Flat Products Market Outlook, By Consumer Goods (2018-2027) ($MN)
56 Europe Aluminium Flat Products Market Outlook, By Automotive & Transportation (2018-2027) ($MN)
57 Europe Aluminium Flat Products Market Outlook, By Electrical & Electronics (2018-2027) ($MN)
58 Asia Pacific Aluminium Flat Products Market Outlook, By Country (2018-2027) ($MN)
59 Asia Pacific Aluminium Flat Products Market Outlook, By Product (2018-2027) ($MN)
60 Asia Pacific Aluminium Flat Products Market Outlook, By Sheets (2018-2027) ($MN)
61 Asia Pacific Aluminium Flat Products Market Outlook, By Foil Stock (2018-2027) ($MN)
62 Asia Pacific Aluminium Flat Products Market Outlook, By Plates (2018-2027) ($MN)
63 Asia Pacific Aluminium Flat Products Market Outlook, By Fin Stock (2018-2027) ($MN)
64 Asia Pacific Aluminium Flat Products Market Outlook, By Circles (2018-2027) ($MN)
65 Asia Pacific Aluminium Flat Products Market Outlook, By Flat Bars (2018-2027) ($MN)
66 Asia Pacific Aluminium Flat Products Market Outlook, By End User (2018-2027) ($MN)
67 Asia Pacific Aluminium Flat Products Market Outlook, By Building & Infrastructure (2018-2027) ($MN)
68 Asia Pacific Aluminium Flat Products Market Outlook, By Utilities (2018-2027) ($MN)
69 Asia Pacific Aluminium Flat Products Market Outlook, By Transport Network (2018-2027) ($MN)
70 Asia Pacific Aluminium Flat Products Market Outlook, By Residential (2018-2027) ($MN)
71 Asia Pacific Aluminium Flat Products Market Outlook, By Commercial (2018-2027) ($MN)
72 Asia Pacific Aluminium Flat Products Market Outlook, By Packaging (2018-2027) ($MN)
73 Asia Pacific Aluminium Flat Products Market Outlook, By Equipment & Machinery (2018-2027) ($MN)
74 Asia Pacific Aluminium Flat Products Market Outlook, By Consumer Goods (2018-2027) ($MN)
75 Asia Pacific Aluminium Flat Products Market Outlook, By Automotive & Transportation (2018-2027) ($MN)
76 Asia Pacific Aluminium Flat Products Market Outlook, By Electrical & Electronics (2018-2027) ($MN)
77 South America Aluminium Flat Products Market Outlook, By Country (2018-2027) ($MN)
78 South America Aluminium Flat Products Market Outlook, By Product (2018-2027) ($MN)
79 South America Aluminium Flat Products Market Outlook, By Sheets (2018-2027) ($MN)
80 South America Aluminium Flat Products Market Outlook, By Foil Stock (2018-2027) ($MN)
81 South America Aluminium Flat Products Market Outlook, By Plates (2018-2027) ($MN)
82 South America Aluminium Flat Products Market Outlook, By Fin Stock (2018-2027) ($MN)
83 South America Aluminium Flat Products Market Outlook, By Circles (2018-2027) ($MN)
84 South America Aluminium Flat Products Market Outlook, By Flat Bars (2018-2027) ($MN)
85 South America Aluminium Flat Products Market Outlook, By End User (2018-2027) ($MN)
86 South America Aluminium Flat Products Market Outlook, By Building & Infrastructure (2018-2027) ($MN)
87 South America Aluminium Flat Products Market Outlook, By Utilities (2018-2027) ($MN)
88 South America Aluminium Flat Products Market Outlook, By Transport Network (2018-2027) ($MN)
89 South America Aluminium Flat Products Market Outlook, By Residential (2018-2027) ($MN)
90 South America Aluminium Flat Products Market Outlook, By Commercial (2018-2027) ($MN)
91 South America Aluminium Flat Products Market Outlook, By Packaging (2018-2027) ($MN)
92 South America Aluminium Flat Products Market Outlook, By Equipment & Machinery (2018-2027) ($MN)
93 South America Aluminium Flat Products Market Outlook, By Consumer Goods (2018-2027) ($MN)
94 South America Aluminium Flat Products Market Outlook, By Automotive & Transportation (2018-2027) ($MN)
95 South America Aluminium Flat Products Market Outlook, By Electrical & Electronics (2018-2027) ($MN)
96 Middle East & Africa Aluminium Flat Products Market Outlook, By Country (2018-2027) ($MN)
97 Middle East & Africa Aluminium Flat Products Market Outlook, By Product (2018-2027) ($MN)
98 Middle East & Africa Aluminium Flat Products Market Outlook, By Sheets (2018-2027) ($MN)
99 Middle East & Africa Aluminium Flat Products Market Outlook, By Foil Stock (2018-2027) ($MN)
100 Middle East & Africa Aluminium Flat Products Market Outlook, By Plates (2018-2027) ($MN)
101 Middle East & Africa Aluminium Flat Products Market Outlook, By Fin Stock (2018-2027) ($MN)
102 Middle East & Africa Aluminium Flat Products Market Outlook, By Circles (2018-2027) ($MN)
103 Middle East & Africa Aluminium Flat Products Market Outlook, By Flat Bars (2018-2027) ($MN)
104 Middle East & Africa Aluminium Flat Products Market Outlook, By End User (2018-2027) ($MN)
105 Middle East & Africa Aluminium Flat Products Market Outlook, By Building & Infrastructure (2018-2027) ($MN)
106 Middle East & Africa Aluminium Flat Products Market Outlook, By Utilities (2018-2027) ($MN)
107 Middle East & Africa Aluminium Flat Products Market Outlook, By Transport Network (2018-2027) ($MN)
108 Middle East & Africa Aluminium Flat Products Market Outlook, By Residential (2018-2027) ($MN)
109 Middle East & Africa Aluminium Flat Products Market Outlook, By Commercial (2018-2027) ($MN)
110 Middle East & Africa Aluminium Flat Products Market Outlook, By Packaging (2018-2027) ($MN)
111 Middle East & Africa Aluminium Flat Products Market Outlook, By Equipment & Machinery (2018-2027) ($MN)
112 Middle East & Africa Aluminium Flat Products Market Outlook, By Consumer Goods (2018-2027) ($MN)
113 Middle East & Africa Aluminium Flat Products Market Outlook, By Automotive & Transportation (2018-2027) ($MN)
114 Middle East & Africa Aluminium Flat Products Market Outlook, By Electrical & Electronics (2018-2027) ($MN)
List of Figures
RESEARCH METHODOLOGY

We at ‘Stratistics’ opt for an extensive research approach which involves data mining, data validation, and data analysis. The various research sources include in-house repository, secondary research, competitor’s sources, social media research, client internal data, and primary research.
Our team of analysts prefers the most reliable and authenticated data sources in order to perform the comprehensive literature search. With access to most of the authenticated data bases our team highly considers the best mix of information through various sources to obtain extensive and accurate analysis.
Each report takes an average time of a month and a team of 4 industry analysts. The time may vary depending on the scope and data availability of the desired market report. The various parameters used in the market assessment are standardized in order to enhance the data accuracy.
Data Mining
The data is collected from several authenticated, reliable, paid and unpaid sources and is filtered depending on the scope & objective of the research. Our reports repository acts as an added advantage in this procedure. Data gathering from the raw material suppliers, distributors and the manufacturers is performed on a regular basis, this helps in the comprehensive understanding of the products value chain. Apart from the above mentioned sources the data is also collected from the industry consultants to ensure the objective of the study is in the right direction.
Market trends such as technological advancements, regulatory affairs, market dynamics (Drivers, Restraints, Opportunities and Challenges) are obtained from scientific journals, market related national & international associations and organizations.
Data Analysis
From the data that is collected depending on the scope & objective of the research the data is subjected for the analysis. The critical steps that we follow for the data analysis include:
- Product Lifecycle Analysis
- Competitor analysis
- Risk analysis
- Porters Analysis
- PESTEL Analysis
- SWOT Analysis
The data engineering is performed by the core industry experts considering both the Marketing Mix Modeling and the Demand Forecasting. The marketing mix modeling makes use of multiple-regression techniques to predict the optimal mix of marketing variables. Regression factor is based on a number of variables and how they relate to an outcome such as sales or profits.
Data Validation
The data validation is performed by the exhaustive primary research from the expert interviews. This includes telephonic interviews, focus groups, face to face interviews, and questionnaires to validate our research from all aspects. The industry experts we approach come from the leading firms, involved in the supply chain ranging from the suppliers, distributors to the manufacturers and consumers so as to ensure an unbiased analysis.
We are in touch with more than 15,000 industry experts with the right mix of consultants, CEO's, presidents, vice presidents, managers, experts from both supply side and demand side, executives and so on.
The data validation involves the primary research from the industry experts belonging to:
- Leading Companies
- Suppliers & Distributors
- Manufacturers
- Consumers
- Industry/Strategic Consultants
Apart from the data validation the primary research also helps in performing the fill gap research, i.e. providing solutions for the unmet needs of the research which helps in enhancing the reports quality.
For more details about research methodology, kindly write to us at info@strategymrc.com
Frequently Asked Questions
In case of any queries regarding this report, you can contact the customer service by filing the “Inquiry Before Buy” form available on the right hand side. You may also contact us through email: info@strategymrc.com or phone: +1-301-202-5929
Yes, the samples are available for all the published reports. You can request them by filling the “Request Sample” option available in this page.
Yes, you can request a sample with your specific requirements. All the customized samples will be provided as per the requirement with the real data masked.
All our reports are available in Digital PDF format. In case if you require them in any other formats, such as PPT, Excel etc you can submit a request through “Inquiry Before Buy” form available on the right hand side. You may also contact us through email: info@strategymrc.com or phone: +1-301-202-5929
We offer a free 15% customization with every purchase. This requirement can be fulfilled for both pre and post sale. You may send your customization requirements through email at info@strategymrc.com or call us on +1-301-202-5929.
We have 3 different licensing options available in electronic format.
- Single User Licence: Allows one person, typically the buyer, to have access to the ordered product. The ordered product cannot be distributed to anyone else.
- 2-5 User Licence: Allows the ordered product to be shared among a maximum of 5 people within your organisation.
- Corporate License: Allows the product to be shared among all employees of your organisation regardless of their geographical location.
All our reports are typically be emailed to you as an attachment.
To order any available report you need to register on our website. The payment can be made either through CCAvenue or PayPal payments gateways which accept all international cards.
We extend our support to 6 months post sale. A post sale customization is also provided to cover your unmet needs in the report.
Request Customization
We offer complimentary customization of up to 15% with every purchase. To share your customization requirements, feel free to email us at info@strategymrc.com or call us on +1-301-202-5929. .
Please Note: Customization within the 15% threshold is entirely free of charge. If your request exceeds this limit, we will conduct a feasibility assessment. Following that, a detailed quote and timeline will be provided.
WHY CHOOSE US ?

Assured Quality
Best in class reports with high standard of research integrity

24X7 Research Support
Continuous support to ensure the best customer experience.

Free Customization
Adding more values to your product of interest.

Safe & Secure Access
Providing a secured environment for all online transactions.

Trusted by 600+ Brands
Serving the most reputed brands across the world.