
Augmented Intelligence Market
Augmented Intelligence Market Forecasts to 2028 – Global Analysis By Type (Decision Support, Smart Products), Component (Hardware, Services), Technology, End User, and By Geography

|
Years Covered |
2020-2028 |
|
Estimated Year Value (2021) |
US $14.31 BN |
|
Projected Year Value (2028) |
US $61.32 BN |
|
CAGR (2021 - 2028) |
23.1% |
|
Regions Covered |
North America, Europe, Asia Pacific, South America, and Middle East & Africa |
|
Countries Covered |
US, Canada, Mexico, Germany, UK, Italy, France, Spain, Japan, China, India, Australia, New Zealand, South Korea, Rest of Asia Pacific, South America, Argentina, Brazil, Chile, Middle East & Africa, Saudi Arabia, UAE, Qatar, and South Africa |
|
Largest Market |
North America |
|
Fastest Growing Market |
Asia Pacific |
According to Stratistics MRC, the Global Augmented Intelligence Market is accounted for $14.31 billion in 2021 and is expected to reach $61.32 billion by 2028 growing at a CAGR of 23.1% during the forecast period. Augmented intelligence is an alternative form of artificial intelligence that focuses on AI's assistive role. Augmented intelligence refines human abilities of reasoning in software or robotic system that includes expectancy, recollection & sequencing, business outlook, and problem-solving.
Market Dynamics:
Driver:
Increase in use of advanced technologies
The rise in the adoption of artificial intelligence, machine learning, and natural language processing technologies for solving complex business problems and improving revenue is driving market growth. The generation of a massive amount of data and the need to analyze it in real-time has compelled organizations to adopt new technologies. These technologies have eased the whole process of gathering insights from data. Usually, data analysis was done through graphs and charts. The data analysis was not user-friendly, and there was a risk of misinterpretation and poor decision-making.
Restraint:
Data security concerns
The backbone of augmented intelligence solutions, data, is a significant feature that most businesses find difficult to manage. The inefficiency of managing exabytes and petabytes of data has increased the risk of security breaches and data losses. Organizations are gathering information through multiple touchpoints and measuring them virtually. Such data is utilized in support and communication and may include a variety of data types. With the increasing IoT-enabled systems, the security and privacy issues will also increase, and every endpoint, gateway, sensor, and smartphone will become a potential target for hackers.
Opportunity:
The rise in the use of digital technology
Digital technologies increase the speed of business growth as they let companies reach a wide audience and build lifelong relations with clients to boost brand reliability. Moreover, technology assists organizations to achieve numerous objectives which augment the growth of the market. Furthermore, the increase in the use of digital technology among business that works with distributors & suppliers, specialized & sub-contractor’s consultants for producing a varied range of products and services provide ample opportunities for the market.
Threat:
Integration of data from data silos
Extracting value from data has become the main thing for many organizations to successfully reduce risks, target valuable customers, and evaluate business performance. Monetizing these data assets needs the accessibility of enough amount of data. Though, data consolidation from distinct data sources into meaningful information can bring new challenges for organizations, particularly centralized business enterprises. Many augmented intelligence providers offer unified data aggregation and data analytics platforms that assist users in successfully aggregating and analyzing data from disparate data sources. As the need for data exchange increases, it needs to be balanced with risk mitigation capabilities.
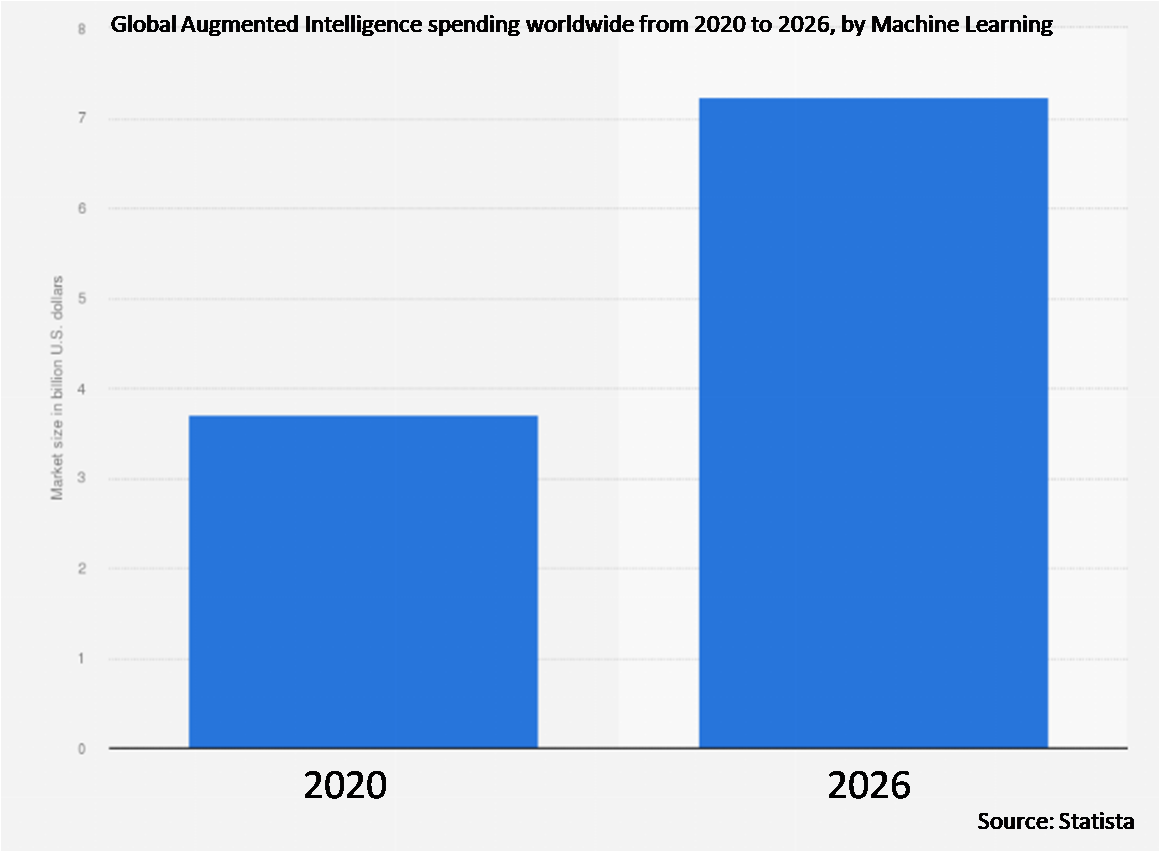
The machine learning segment is expected to be the largest during the forecast period
The machine learning segment is estimated to have a lucrative growth as machine learning helps in the transformation of knowledge into expertise and the extraction of significant patterns from huge amounts of data. Augmented intelligence along with machine learning systems can detect patterns utilizing aggregated data with precise unit characteristics of each instance and numerous variables to be employed, allowing predictive models to be built.
The large enterprises segment is expected to have the highest CAGR during the forecast period
The large enterprises segment is anticipated to witness the fastest CAGR growth during the forecast period owing to the high adoption of augmented intelligence and services among large enterprises as these enterprises use augmented intelligence solutions for specific use cases. They are faced with the troublesome task of effectively managing security because of the diverse nature of IT infrastructure, which is complex in nature.
Region with highest share:
North America is projected to hold the largest market share during the forecast period due to the increasing technological advancements, penetration of new industries and improvement in the economy, presence of a growing number of cloud augmented intelligence solution vendors, and the growing number of augmented intelligence players across regions.
Region with highest CAGR:
Asia Pacific is projected to have the highest CAGR over the forecast period as the region it is experiencing a lot of new entrepreneur setups, which would be looking forward to acquiring new customers and gaining customer trust by involving new paradigms of advanced analytics to have a competitive advantage over the established players and wide presence of small-and medium-scale enterprises, which are turning toward hosted augmented intelligence solutions to efficiently manage their business processes, particularly in developing countries such as China, India, and Singapore.

Key players in the market
Some of the key players profiled in the Augmented Intelligence Market include TIBCO, Stradigi AI, Lucidworks, Sisense, Dataiku, Cosmo Tech, Salesforce, QlikTech International AB, NEORIS, MicroStrategy, SAP, Jumio, IBM, Google, Squirro AG, Microsoft, CognitiveScale, AWS, SAS and Schlumberger.
Key Developments:
In March 2022, Schlumberger expanded its successful INNOVATION FACTORI network with the opening of a new center in Houston, Texas. INNOVATION FACTORI enables customers to accelerate the development and deployment of enterprise-scale AI and digital solutions, in the context of their unique business challenges, spanning exploration to production and new energy systems.
In April 2020, IBM released novel AI-powered technologies. IBM released novel AI-powered technologies to help the Health and Research Community accelerate the discovery of medical insights and treatments for COVID-19.
In June 2019, Salesforce acquired data visualization company Tableau Software. Along with Google Cloud's acquisition of Looker and Logi Analytics' purchase of Zoomdata, it's looking like the consolidation trend in big data and business analytics is back.
Types Covered:
• Decision Automation
• Decision Support
• Smart Products
Components Covered:
• Hardware
• Services
• Software
• Solution
Deployment Modes Covered:
• On-Premises
• Cloud
Organization Sizes Covered:
• Large Enterprises
• Small and Medium-Sized Enterprises
Technologies Covered:
• Natural Language Processing
• Machine Learning
• Computer Vision
• Other Technologies
Applications Covered:
• Residential
• Industrial
• Commercial
End Users Covered:
• Transportation & Logistics
• Retail & Consumer Goods
• Media & Entertainment
• Automotive
• IT & Telecom
• Human Resources
• Healthcare & Life Sciences
• Government & Defense
• Fintech
• Energy & Utilities
• Banking, Financial Services and Insurance (BFSI)
• Manufacturing
• Agriculture
• Other End Users
Regions Covered:
• North America
o US
o Canada
o Mexico
• Europe
o Germany
o UK
o Italy
o France
o Spain
o Rest of Europe
• Asia Pacific
o Japan
o China
o India
o Australia
o New Zealand
o South Korea
o Rest of Asia Pacific
• South America
o Argentina
o Brazil
o Chile
o Rest of South America
• Middle East & Africa
o Saudi Arabia
o UAE
o Qatar
o South Africa
o Rest of Middle East & Africa
What our report offers:
- Market share assessments for the regional and country-level segments
- Strategic recommendations for the new entrants
- Covers Market data for the years 2020, 2021, 2022, 2025, and 2028
- Market Trends (Drivers, Constraints, Opportunities, Threats, Challenges, Investment Opportunities, and recommendations)
- Strategic recommendations in key business segments based on the market estimations
- Competitive landscaping mapping the key common trends
- Company profiling with detailed strategies, financials, and recent developments
- Supply chain trends mapping the latest technological advancements
Free Customization Offerings:
All the customers of this report will be entitled to receive one of the following free customization options:
• Company Profiling
o Comprehensive profiling of additional market players (up to 3)
o SWOT Analysis of key players (up to 3)
• Regional Segmentation
o Market estimations, Forecasts and CAGR of any prominent country as per the client's interest (Note: Depends on feasibility check)
• Competitive Benchmarking
o Benchmarking of key players based on product portfolio, geographical presence, and strategic alliances
Table of Contents
1 Executive Summary
2 Preface
2.1 Abstract
2.2 Stake Holders
2.3 Research Scope
2.4 Research Methodology
2.4.1 Data Mining
2.4.2 Data Analysis
2.4.3 Data Validation
2.4.4 Research Approach
2.5 Research Sources
2.5.1 Primary Research Sources
2.5.2 Secondary Research Sources
2.5.3 Assumptions
3 Market Trend Analysis
3.1 Introduction
3.2 Drivers
3.3 Restraints
3.4 Opportunities
3.5 Threats
3.6 Technology Analysis
3.7 Application Analysis
3.8 End User Analysis
3.9 Emerging Markets
3.10 Impact of Covid-19
4 Porters Five Force Analysis
4.1 Bargaining power of suppliers
4.2 Bargaining power of buyers
4.3 Threat of substitutes
4.4 Threat of new entrants
4.5 Competitive rivalry
5 Global Augmented Intelligence Market, By Type
5.1 Introduction
5.2 Decision Automation
5.3 Decision Support
5.4 Smart Products
6 Global Augmented Intelligence Market, By Component
6.1 Introduction
6.2 Hardware
6.2.1 Processors
6.2.2 Network
6.2.3 Memory
6.3 Services
6.3.1 Support & Maintenance
6.3.2 Deployment & Integration
6.4 Software
6.5 Solution
7 Global Augmented Intelligence Market, By Deployment Mode
7.1 Introduction
7.2 On-Premises
7.3 Cloud
8 Global Augmented Intelligence Market, By Organization Size
8.1 Introduction
8.2 Large Enterprises
8.3 Small and Medium-Sized Enterprises
9 Global Augmented Intelligence Market, By Technology
9.1 Introduction
9.2 Natural Language Processing
9.3 Machine Learning
9.4 Computer Vision
9.5 Other Technologies
9.5.1 Spatial Navigation
9.5.2 Predictive Analytics
9.5.3 Logical Reasoning
9.5.4 Context-Aware Computing
9.5.5 Pattern Recognition
10 Global Augmented Intelligence Market, By Application
10.1 Introduction
10.2 Residential
10.3 Industrial
10.4 Commercial
11 Global Augmented Intelligence Market, By End User
11.1 Introduction
11.2 Transportation & Logistics
11.3 Retail & Consumer Goods
11.4 Media & Entertainment
11.5 Automotive
11.6 IT & Telecom
11.7 Human Resources
11.8 Healthcare & Life Sciences
11.9 Government & Defense
11.10 Fintech
11.11 Energy & Utilities
11.12 Banking, Financial Services and Insurance (BFSI)
11.13 Manufacturing
11.14 Agriculture
11.15 Other End Users
11.15.1 Travel
11.15.2 Research and Academia
11.15.3 Hospitality
11.15.4 Factory Automation
11.15.5 Business Analysis
11.15.6 Autopilot
12 Global Augmented Intelligence Market, By Geography
12.1 Introduction
12.2 North America
12.2.1 US
12.2.2 Canada
12.2.3 Mexico
12.3 Europe
12.3.1 Germany
12.3.2 UK
12.3.3 Italy
12.3.4 France
12.3.5 Spain
12.3.6 Rest of Europe
12.4 Asia Pacific
12.4.1 Japan
12.4.2 China
12.4.3 India
12.4.4 Australia
12.4.5 New Zealand
12.4.6 South Korea
12.4.7 Rest of Asia Pacific
12.5 South America
12.5.1 Argentina
12.5.2 Brazil
12.5.3 Chile
12.5.4 Rest of South America
12.6 Middle East & Africa
12.6.1 Saudi Arabia
12.6.2 UAE
12.6.3 Qatar
12.6.4 South Africa
12.6.5 Rest of Middle East & Africa
13 Key Developments
13.1 Agreements, Partnerships, Collaborations and Joint Ventures
13.2 Acquisitions & Mergers
13.3 New Product Launch
13.4 Expansions
13.5 Other Key Strategies
14 Company Profiling
14.1 TIBCO
14.2 Stradigi AI
14.3 Lucidworks
14.4 Sisense
14.5 Dataiku
14.6 Cosmo Tech
14.7 Salesforce
14.8 QlikTech International AB
14.9 NEORIS
14.10 MicroStrategy
14.11 SAP
14.12 Jumio
14.13 IBM
14.14 Google
14.15 Squirro AG
14.16 Microsoft
14.17 CognitiveScale
14.18 AWS
14.19 SAS
14.20 Schlumberger
List of Tables
1 Global Augmented Intelligence Market Outlook, By Region (2020-2028) ($MN)
2 Global Augmented Intelligence Market Outlook, By Type (2020-2028) ($MN)
3 Global Augmented Intelligence Market Outlook, By Decision Automation (2020-2028) ($MN)
4 Global Augmented Intelligence Market Outlook, By Decision Support (2020-2028) ($MN)
5 Global Augmented Intelligence Market Outlook, By Smart Products (2020-2028) ($MN)
6 Global Augmented Intelligence Market Outlook, By Component (2020-2028) ($MN)
7 Global Augmented Intelligence Market Outlook, By Hardware (2020-2028) ($MN)
8 Global Augmented Intelligence Market Outlook, By Processors (2020-2028) ($MN)
9 Global Augmented Intelligence Market Outlook, By Network (2020-2028) ($MN)
10 Global Augmented Intelligence Market Outlook, By Memory (2020-2028) ($MN)
11 Global Augmented Intelligence Market Outlook, By Services (2020-2028) ($MN)
12 Global Augmented Intelligence Market Outlook, By Support & Maintenance (2020-2028) ($MN)
13 Global Augmented Intelligence Market Outlook, By Deployment & Integration (2020-2028) ($MN)
14 Global Augmented Intelligence Market Outlook, By Software (2020-2028) ($MN)
15 Global Augmented Intelligence Market Outlook, By Solution (2020-2028) ($MN)
16 Global Augmented Intelligence Market Outlook, By Deployment Mode (2020-2028) ($MN)
17 Global Augmented Intelligence Market Outlook, By On-Premises (2020-2028) ($MN)
18 Global Augmented Intelligence Market Outlook, By Cloud (2020-2028) ($MN)
19 Global Augmented Intelligence Market Outlook, By Organization Size (2020-2028) ($MN)
20 Global Augmented Intelligence Market Outlook, By Large Enterprises (2020-2028) ($MN)
21 Global Augmented Intelligence Market Outlook, By Small and Medium-Sized Enterprises (2020-2028) ($MN)
22 Global Augmented Intelligence Market Outlook, By Technology (2020-2028) ($MN)
23 Global Augmented Intelligence Market Outlook, By Natural Language Processing (2020-2028) ($MN)
24 Global Augmented Intelligence Market Outlook, By Machine Learning (2020-2028) ($MN)
25 Global Augmented Intelligence Market Outlook, By Computer Vision (2020-2028) ($MN)
26 Global Augmented Intelligence Market Outlook, By Other Technologies (2020-2028) ($MN)
27 Global Augmented Intelligence Market Outlook, By Spatial Navigation (2020-2028) ($MN)
28 Global Augmented Intelligence Market Outlook, By Predictive Analytics (2020-2028) ($MN)
29 Global Augmented Intelligence Market Outlook, By Logical Reasoning (2020-2028) ($MN)
30 Global Augmented Intelligence Market Outlook, By Context-Aware Computing (2020-2028) ($MN)
31 Global Augmented Intelligence Market Outlook, By Pattern Recognition (2020-2028) ($MN)
32 Global Augmented Intelligence Market Outlook, By Application (2020-2028) ($MN)
33 Global Augmented Intelligence Market Outlook, By Residential (2020-2028) ($MN)
34 Global Augmented Intelligence Market Outlook, By Industrial (2020-2028) ($MN)
35 Global Augmented Intelligence Market Outlook, By Commercial (2020-2028) ($MN)
36 Global Augmented Intelligence Market Outlook, By End User (2020-2028) ($MN)
37 Global Augmented Intelligence Market Outlook, By Transportation & Logistics (2020-2028) ($MN)
38 Global Augmented Intelligence Market Outlook, By Retail & Consumer Goods (2020-2028) ($MN)
39 Global Augmented Intelligence Market Outlook, By Media & Entertainment (2020-2028) ($MN)
40 Global Augmented Intelligence Market Outlook, By Automotive (2020-2028) ($MN)
41 Global Augmented Intelligence Market Outlook, By IT & Telecom (2020-2028) ($MN)
42 Global Augmented Intelligence Market Outlook, By Human Resources (2020-2028) ($MN)
43 Global Augmented Intelligence Market Outlook, By Healthcare & Life Sciences (2020-2028) ($MN)
44 Global Augmented Intelligence Market Outlook, By Government & Defense (2020-2028) ($MN)
45 Global Augmented Intelligence Market Outlook, By Fintech (2020-2028) ($MN)
46 Global Augmented Intelligence Market Outlook, By Energy & Utilities (2020-2028) ($MN)
47 Global Augmented Intelligence Market Outlook, By Banking, Financial Services and Insurance (BFSI) (2020-2028) ($MN)
48 Global Augmented Intelligence Market Outlook, By Manufacturing (2020-2028) ($MN)
49 Global Augmented Intelligence Market Outlook, By Agriculture (2020-2028) ($MN)
50 Global Augmented Intelligence Market Outlook, By Other End Users (2020-2028) ($MN)
51 Global Augmented Intelligence Market Outlook, By Travel (2020-2028) ($MN)
52 Global Augmented Intelligence Market Outlook, By Research and Academia (2020-2028) ($MN)
53 Global Augmented Intelligence Market Outlook, By Hospitality (2020-2028) ($MN)
54 Global Augmented Intelligence Market Outlook, By Factory Automation (2020-2028) ($MN)
55 Global Augmented Intelligence Market Outlook, By Business Analysis (2020-2028) ($MN)
56 Global Augmented Intelligence Market Outlook, By Autopilot (2020-2028) ($MN)
Note: Tables for North America, Europe, APAC, South America, and Middle East & Africa Regions are also represented in the same manner as above.
List of Figures
RESEARCH METHODOLOGY

We at ‘Stratistics’ opt for an extensive research approach which involves data mining, data validation, and data analysis. The various research sources include in-house repository, secondary research, competitor’s sources, social media research, client internal data, and primary research.
Our team of analysts prefers the most reliable and authenticated data sources in order to perform the comprehensive literature search. With access to most of the authenticated data bases our team highly considers the best mix of information through various sources to obtain extensive and accurate analysis.
Each report takes an average time of a month and a team of 4 industry analysts. The time may vary depending on the scope and data availability of the desired market report. The various parameters used in the market assessment are standardized in order to enhance the data accuracy.
Data Mining
The data is collected from several authenticated, reliable, paid and unpaid sources and is filtered depending on the scope & objective of the research. Our reports repository acts as an added advantage in this procedure. Data gathering from the raw material suppliers, distributors and the manufacturers is performed on a regular basis, this helps in the comprehensive understanding of the products value chain. Apart from the above mentioned sources the data is also collected from the industry consultants to ensure the objective of the study is in the right direction.
Market trends such as technological advancements, regulatory affairs, market dynamics (Drivers, Restraints, Opportunities and Challenges) are obtained from scientific journals, market related national & international associations and organizations.
Data Analysis
From the data that is collected depending on the scope & objective of the research the data is subjected for the analysis. The critical steps that we follow for the data analysis include:
- Product Lifecycle Analysis
- Competitor analysis
- Risk analysis
- Porters Analysis
- PESTEL Analysis
- SWOT Analysis
The data engineering is performed by the core industry experts considering both the Marketing Mix Modeling and the Demand Forecasting. The marketing mix modeling makes use of multiple-regression techniques to predict the optimal mix of marketing variables. Regression factor is based on a number of variables and how they relate to an outcome such as sales or profits.
Data Validation
The data validation is performed by the exhaustive primary research from the expert interviews. This includes telephonic interviews, focus groups, face to face interviews, and questionnaires to validate our research from all aspects. The industry experts we approach come from the leading firms, involved in the supply chain ranging from the suppliers, distributors to the manufacturers and consumers so as to ensure an unbiased analysis.
We are in touch with more than 15,000 industry experts with the right mix of consultants, CEO's, presidents, vice presidents, managers, experts from both supply side and demand side, executives and so on.
The data validation involves the primary research from the industry experts belonging to:
- Leading Companies
- Suppliers & Distributors
- Manufacturers
- Consumers
- Industry/Strategic Consultants
Apart from the data validation the primary research also helps in performing the fill gap research, i.e. providing solutions for the unmet needs of the research which helps in enhancing the reports quality.
For more details about research methodology, kindly write to us at info@strategymrc.com
Frequently Asked Questions
In case of any queries regarding this report, you can contact the customer service by filing the “Inquiry Before Buy” form available on the right hand side. You may also contact us through email: info@strategymrc.com or phone: +1-301-202-5929
Yes, the samples are available for all the published reports. You can request them by filling the “Request Sample” option available in this page.
Yes, you can request a sample with your specific requirements. All the customized samples will be provided as per the requirement with the real data masked.
All our reports are available in Digital PDF format. In case if you require them in any other formats, such as PPT, Excel etc you can submit a request through “Inquiry Before Buy” form available on the right hand side. You may also contact us through email: info@strategymrc.com or phone: +1-301-202-5929
We offer a free 15% customization with every purchase. This requirement can be fulfilled for both pre and post sale. You may send your customization requirements through email at info@strategymrc.com or call us on +1-301-202-5929.
We have 3 different licensing options available in electronic format.
- Single User Licence: Allows one person, typically the buyer, to have access to the ordered product. The ordered product cannot be distributed to anyone else.
- 2-5 User Licence: Allows the ordered product to be shared among a maximum of 5 people within your organisation.
- Corporate License: Allows the product to be shared among all employees of your organisation regardless of their geographical location.
All our reports are typically be emailed to you as an attachment.
To order any available report you need to register on our website. The payment can be made either through CCAvenue or PayPal payments gateways which accept all international cards.
We extend our support to 6 months post sale. A post sale customization is also provided to cover your unmet needs in the report.
Request Customization
We offer complimentary customization of up to 15% with every purchase. To share your customization requirements, feel free to email us at info@strategymrc.com or call us on +1-301-202-5929. .
Please Note: Customization within the 15% threshold is entirely free of charge. If your request exceeds this limit, we will conduct a feasibility assessment. Following that, a detailed quote and timeline will be provided.
WHY CHOOSE US ?

Assured Quality
Best in class reports with high standard of research integrity

24X7 Research Support
Continuous support to ensure the best customer experience.

Free Customization
Adding more values to your product of interest.

Safe & Secure Access
Providing a secured environment for all online transactions.

Trusted by 600+ Brands
Serving the most reputed brands across the world.