
Automated Border Control Market
Automated Border Control Market Forecasts to 2028 – Global Analysis By Type ((ABC) E-Gate, (ABC) Kiosk), Component (Hardware, Software), Application (Airport, Seaport) and By Geography

|
Years Covered |
2020-2028 |
|
Estimated Year Value (2021) |
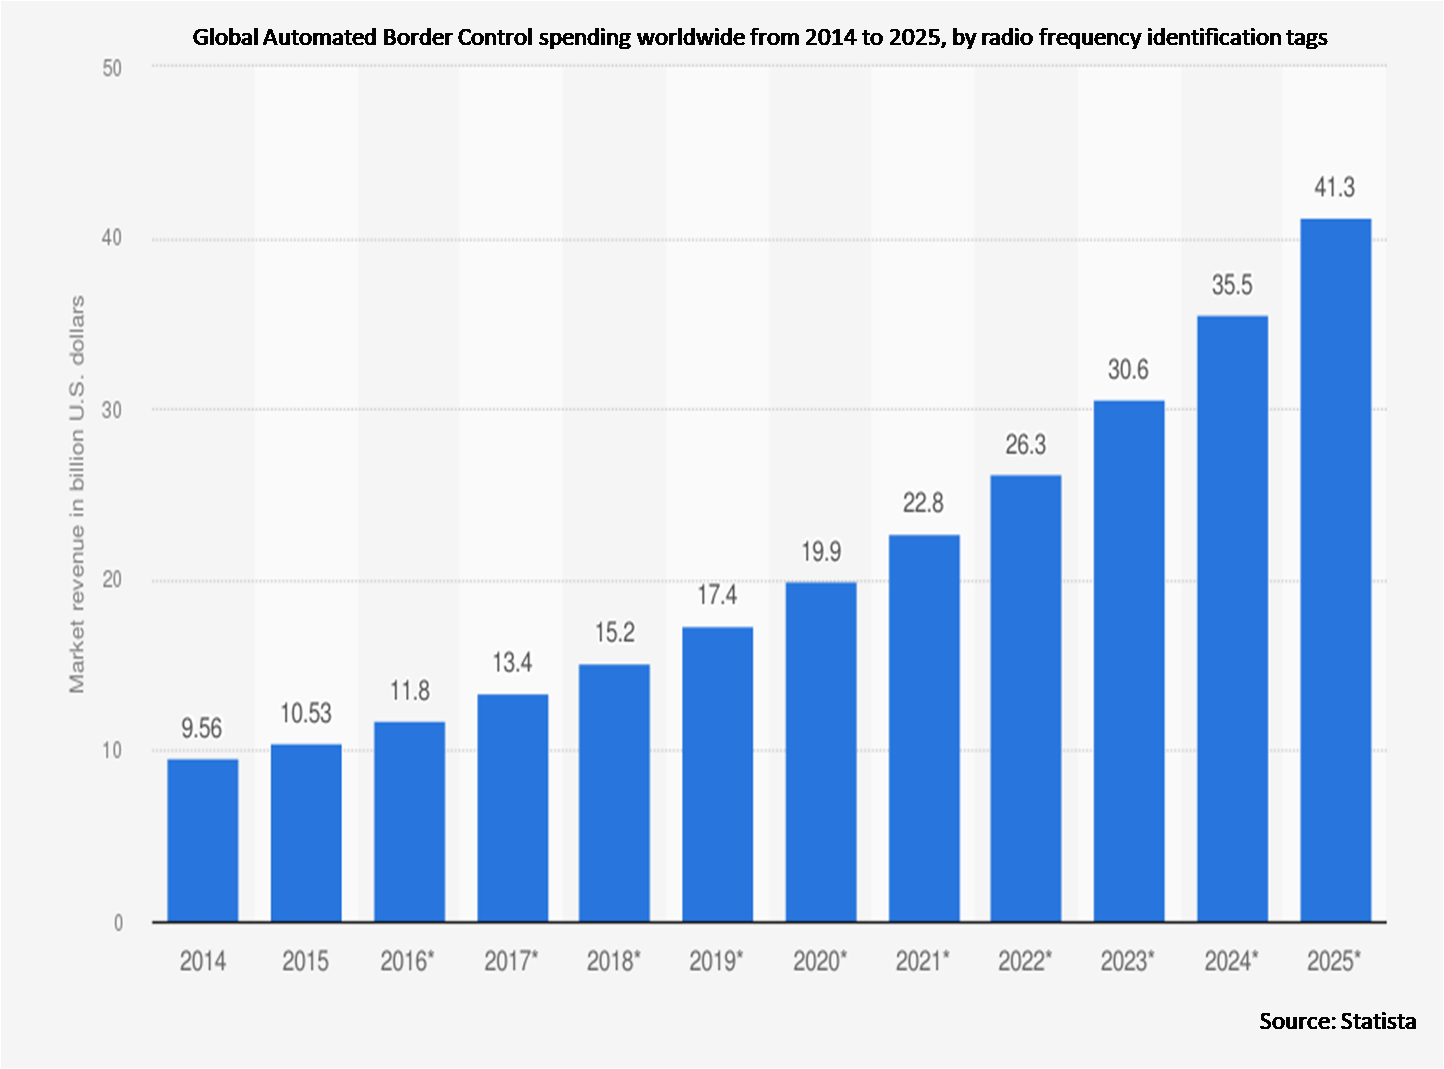
US $1053.06 MN |
|
Projected Year Value (2028) |
US $3643.21 MN |
|
CAGR (2021 - 2028) |
19.4% |
|
Regions Covered |
North America, Europe, Asia Pacific, South America, and Middle East & Africa |
|
Countries Covered |
US, Canada, Mexico, Germany, UK, Italy, France, Spain, Japan, China, India, Australia, New Zealand, South Korea, Rest of Asia Pacific, South America, Argentina, Brazil, Chile, Middle East & Africa, Saudi Arabia, UAE, Qatar, and South Africa |
|
Largest Market |
Asia Pacific |
|
Highest Growing Market |
Europe |
According to Stratistics MRC, the Global Automated Border Control Market is accounted for $1053.06 million in 2021 and is expected to reach $3643.21 million by 2028 growing at a CAGR of 19.4% during the forecast period. Automated border control is a barrier that initiates processing as soon as the traveller enters and assures that the passenger is the rightful holder of the document. It uses the data stored in the chip in the biometric passport to verify the user’s identity that involves different verifications that include fingerprint, biometric, face and iris recognition, or a combination of any of the above.
Market Dynamics:
Driver:
Rising Number of Travelers
With the increase in air traveling and the number of passengers, airports have to handle a lot of passengers at a time. The increase in air travel is a result of factors like an increase in the number of people traveling abroad for higher education and career opportunities, decrease in the cost of air travel, increase in the mobility of people, and rising wealth of HNWI (high-net-worth individual) individuals is one of the factors driving the market growth.
Restraint:
Lack of Trained People
The underdeveloped or developing areas do not have efficient manpower of skilled labor to operate technologies like this. The e-Gates and cabins used to maintain border security require a group of trained people who can handle the security infrastructure in case of failure in passport scanning, biometric algorithms, problems during scanning of documents, database processing, or any other technical issue. Technical skills are also required to maintain data security and prevent intruders from hacking the database.
Opportunity:
Emergence of Multimodal Biometrics
Multimodal biometrics features a combination of two or more biometric technologies for verification. Multimodal biometrics provides more accuracy because it identifies an individual using two or more biometric technologies for authentication. These biometric systems are accurate, reliable, and secure, which is why they are widely adopted for border control. Some multimodal biometrics is available with both fingerprint and finger vein recognition technology in a single device. It is observed that fingerprint and facial recognition are the leading biometric technologies used in regions. While fingerprint recognition is preferred in the US, the Middle East prefers iris recognition. The airports planning the installation of e-gates should consider the geographic diversity of citizens, and the e-gates may need to be multimodal to provide the necessary flexibility and support a range of biometric options.
Threat:
Identity Theft
The occurrence of cases of identity theft is the factor that could affect the growth of the market. Identity (ID) theft happens when someone steals your personal information to commit fraud. The identity thief may use your information to apply for credit, file taxes, or get medical services. These acts can damage credit status, and cost, time and money to restore your good name.
Automated Border Control (ABC) E-Gate segment is expected to be the largest during the forecast period
The increasing demand for automation, as well as increased passenger traffic, can be attributable to growth of segment. Although, an anticipated downside to the scenario can be the large capital required to build the infrastructure automated border control system. Automated border control systems (ABC) or eGates are automated self-service barriers which use data stored in a chip in biometric passports along with a photo or fingerprint taken at the time of entering the eGates to verify the passport holder's identity.
The Hardware segment is expected to have the highest CAGR during the forecast period
Hardware component holds the highest share of the market owing to the increasing need for biometric verification technology in the border control process. Moreover, biometric verification is the most accurate and authenticated validation technology suggested by transport authorities globally.
Region with highest share:
The Asia Pacific is projected to hold the highest market share, due to government support for installation of it to improve security at airports and land ports in countries in this province is a key factor fuelling growth of the target market. The market's expansion can be linked to China's and India's increased investments in airport infrastructure. China's government is putting a greater emphasis on airport security by requiring a high level of passport verification to confirm travel papers. The government of India, on the other hand, is driving the market growth by carefully enforcing the background check process for registered tourists.
Region with highest CAGR:
Europe is projected to have the highest CAGR, owing to the presence of prominent players, coupled with government funding for automated border control are major factors driving the growth of the target market in this province. The major reason behind the growth of the market in this region is that most of the automation companies are based in Europe and possess a strong technical base in the region. Moreover, the European Union's focus on improving the automated border control e-gates further drives the market's growth. Most of the busiest airports in Europe are already equipped with automated border control gates. Moreover, the rising number of mergers and acquisitions in the region drives the growth of the market. For instance, In January 2020, FacePhi, a software company based in Spain, acquired Ecertic, a Spanish document recognition specialist, to improve its digital onboarding services. The latter’s technology is compliant with the latest EIDAS regulations in Europe.

Key players in the market:
Some of the key players profiled in the Automated Border Control Market include Thales Group Accenture PLC, SITA, Indra Sistemas, S.A. , Secunet Security Networks AG , IDEMIA , Vision-Box , Gunnebo AB , NEC Corporation, Cross Match Technologies, Inc.
Key developments:
In January 2020: In France, Idemia and Sopra Steria signed a agreement to provide a new biometric border control system. To improve border control operations, the Idemia firm provided a standard border control system underpinned by biometric technologies.
In May 2020: NEC corporation announced that it has completed the development of a biometric authentication terminal, which can provide high levels of authentication accuracy and convenience for users within a wide range of environments. This new solution also incorporates a face recognition system that increases the efficiency of the system and offers a cost-effective solution to its customers.
In April 2018: Thales Group announced that it inaugurated its new office in India. The establishment of the new office enabled the company to strengthen its supply chain network and expand its customer base in the Indian market.
Types Covered:
• Automated Border Control (ABC) E-Gate
• Automated Border Control (ABC) Kiosk
Components Covered:
• Hardware
• Software
• Services
Applications Covered:
• Airport
• Equipment Tracking
• Facility Management
• Funding Management
• Land Port/Land Borders
• Mandate Compliance
• Seaport
• Tool Tracking
• Warehouse Management
End Users Covered:
• Banking, Financial Services and Insurance (BFSI)
• Chemical
• Education
• Energy & Utilities
• Government
• Healthcare
• Hospitality
• Information Technology (IT) & Telecom
• Manufacturing
• Oil & Gas
• Retail
• Transportation and Logistics
Regions Covered:
• North America
o US
o Canada
o Mexico
• Europe
o Germany
o UK
o Italy
o France
o Spain
o Rest of Europe
• Asia Pacific
o Japan
o China
o India
o Australia
o New Zealand
o South Korea
o Rest of Asia Pacific
• South America
o Argentina
o Brazil
o Chile
o Rest of South America
• Middle East & Africa
o Saudi Arabia
o UAE
o Qatar
o South Africa
o Rest of Middle East & Africa
What our report offers:
- Market share assessments for the regional and country-level segments
- Strategic recommendations for the new entrants
- Covers Market data for the years 2020, 2021, 2022, 2025 and 2028
- Market Trends (Drivers, Constraints, Opportunities, Threats, Challenges, Investment Opportunities, and recommendations)
- Strategic recommendations in key business segments based on the market estimations
- Competitive landscaping mapping the key common trends
- Company profiling with detailed strategies, financials, and recent developments
- Supply chain trends mapping the latest technological advancements
Free Customization Offerings:
All the customers of this report will be entitled to receive one of the following free customization options:
• Company Profiling
o Comprehensive profiling of additional market players (up to 3)
o SWOT Analysis of key players (up to 3)
• Regional Segmentation
o Market estimations, Forecasts and CAGR of any prominent country as per the client's interest (Note: Depends on feasibility check)
• Competitive Benchmarking
o Benchmarking of key players based on product portfolio, geographical presence, and strategic alliances
Table of Contents
1 Executive Summary
2 Preface
2.1 Abstract
2.2 Stake Holders
2.3 Research Scope
2.4 Research Methodology
2.4.1 Data Mining
2.4.2 Data Analysis
2.4.3 Data Validation
2.4.4 Research Approach
2.5 Research Sources
2.5.1 Primary Research Sources
2.5.2 Secondary Research Sources
2.5.3 Assumptions
3 Market Trend Analysis
3.1 Introduction
3.2 Drivers
3.3 Restraints
3.4 Opportunities
3.5 Threats
3.6 Application Analysis
3.7 End User Analysis
3.8 Emerging Markets
3.9 Impact of Covid-19
4 Porters Five Force Analysis
4.1 Bargaining power of suppliers
4.2 Bargaining power of buyers
4.3 Threat of substitutes
4.4 Threat of new entrants
4.5 Competitive rivalry
5 Global Automated Border Control Market, By Type
5.1 Introduction
5.2 Automated Border Control (ABC) E-Gate
5.3 Automated Border Control (ABC) Kiosk
6 Global Automated Border Control Market, By Component
6.1 Introduction
6.2 Hardware
6.2.1 Document Authentication System (DAS)
6.2.2 Biometric Verification System (BVS)
6.2.2.1 Face Recognition
6.2.2.2 Fingerprint Recognition
6.2.2.3 Intelligent Roadway Information System (IRIS) Recognition
6.2.2.4 Palm and Vein Recognition
6.2.3 Barcode Printers
6.2.4 Barcode Stickers
6.2.5 Barcode Scanners
6.2.6 Radio Frequency Identification (RFID) Tags
6.2.7 Global Positioning System (GPS)
6.2.8 Other Hardwares
6.2.8.1 Baggage Scanner
6.2.8.2 Signature Scanner
6.3 Software
6.3.1 Cloud-Based
6.3.2 On-Premise
6.4 Services
6.4.1 Consulting & Training
6.4.2 Implementation & Integration
6.4.3 Installation
6.4.4 Operation & Maintenance
7 Global Automated Border Control Market, By Application
7.1 Introduction
7.2 Airport
7.3 Equipment Tracking
7.4 Facility Management
7.5 Funding Management
7.6 Land Port/Land Borders
7.7 Mandate Compliance
7.8 Seaport
7.9 Tool Tracking
7.10 Warehouse Management
8 Global Automated Border Control Market, By End User
8.1 Introduction
8.2 Banking, Financial Services and Insurance (BFSI)
8.3 Chemical
8.4 Education
8.5 Energy & Utilities
8.6 Government
8.7 Healthcare
8.8 Hospitality
8.9 Information Technology (IT) & Telecom
8.10 Manufacturing
8.11 Oil & Gas
8.12 Retail
8.13 Transportation and Logistics
9 Global Automated Border Control Market, By Geography
9.1 Introduction
9.2 North America
9.2.1 US
9.2.2 Canada
9.2.3 Mexico
9.3 Europe
9.3.1 Germany
9.3.2 UK
9.3.3 Italy
9.3.4 France
9.3.5 Spain
9.3.6 Rest of Europe
9.4 Asia Pacific
9.4.1 Japan
9.4.2 China
9.4.3 India
9.4.4 Australia
9.4.5 New Zealand
9.4.6 South Korea
9.4.7 Rest of Asia Pacific
9.5 South America
9.5.1 Argentina
9.5.2 Brazil
9.5.3 Chile
9.5.4 Rest of South America
9.6 Middle East & Africa
9.6.1 Saudi Arabia
9.6.2 UAE
9.6.3 Qatar
9.6.4 South Africa
9.6.5 Rest of Middle East & Africa
10 Key Developments
10.1 Agreements, Partnerships, Collaborations and Joint Ventures
10.2 Acquisitions & Mergers
10.3 New Product Launch
10.4 Expansions
10.5 Other Key Strategies
11 Company Profiling
11.1 Thales Group
11.2 Accenture PLC
11.3 SITA
11.4 Indra Sistemas, S.A.
11.5 Secunet Security Networks AG
11.6 IDEMIA
11.7 Vision-Box
11.8 Gunnebo AB
11.9 NEC Corporation
11.10 Cross Match Technologies, Inc.
List of Tables
1 Global Automated Border Control Market Outlook, By Region (2020-2028) (US $MN)
2 Global Automated Border Control Market Outlook, By Type (2020-2028) (US $MN)
3 Global Automated Border Control Market Outlook, By Automated Border Control (ABC) E-Gate (2020-2028) (US $MN)
4 Global Automated Border Control Market Outlook, By Automated Border Control (ABC) Kiosk (2020-2028) (US $MN)
5 Global Automated Border Control Market Outlook, By Component (2020-2028) (US $MN)
6 Global Automated Border Control Market Outlook, By Hardware (2020-2028) (US $MN)
7 Global Automated Border Control Market Outlook, By Document Authentication System (DAS) (2020-2028) (US $MN)
8 Global Automated Border Control Market Outlook, By Biometric Verification System (BVS (2020-2028) (US $MN)
9 Global Automated Border Control Market Outlook, By Barcode Printers (2020-2028) (US $MN)
10 Global Automated Border Control Market Outlook, By Barcode Stickers (2020-2028) (US $MN)
11 Global Automated Border Control Market Outlook, By Barcode Scanners (2020-2028) (US $MN)
12 Global Automated Border Control Market Outlook, By Radio Frequency Identification (RFID) Tags (2020-2028) (US $MN)
13 Global Automated Border Control Market Outlook, By Global Positioning System (GPS) (2020-2028) (US $MN)
14 Global Automated Border Control Market Outlook, By Other Hardwares (2020-2028) (US $MN)
15 Global Automated Border Control Market Outlook, By Software (2020-2028) (US $MN)
16 Global Automated Border Control Market Outlook, By Cloud-Based (2020-2028) (US $MN)
17 Global Automated Border Control Market Outlook, By On-Premise (2020-2028) (US $MN)
18 Global Automated Border Control Market Outlook, By Services (2020-2028) (US $MN)
19 Global Automated Border Control Market Outlook, By Consulting & Training (2020-2028) (US $MN)
20 Global Automated Border Control Market Outlook, By Implementation & Integration (2020-2028) (US $MN)
21 Global Automated Border Control Market Outlook, By Installation (2020-2028) (US $MN)
22 Global Automated Border Control Market Outlook, By Operation & Maintenance (2020-2028) (US $MN)
23 Global Automated Border Control Market Outlook, By Application (2020-2028) (US $MN)
24 Global Automated Border Control Market Outlook, By Airport (2020-2028) (US $MN)
25 Global Automated Border Control Market Outlook, By Equipment Tracking (2020-2028) (US $MN)
26 Global Automated Border Control Market Outlook, By Facility Management (2020-2028) (US $MN)
27 Global Automated Border Control Market Outlook, By Funding Management (2020-2028) (US $MN)
28 Global Automated Border Control Market Outlook, By Land Port/Land Borders (2020-2028) (US $MN)
29 Global Automated Border Control Market Outlook, By Mandate Compliance (2020-2028) (US $MN)
30 Global Automated Border Control Market Outlook, By Seaport (2020-2028) (US $MN)
31 Global Automated Border Control Market Outlook, By Tool Tracking (2020-2028) (US $MN)
32 Global Automated Border Control Market Outlook, By Warehouse Management (2020-2028) (US $MN)
33 Global Automated Border Control Market Outlook, By End User (2020-2028) (US $MN)
34 Global Automated Border Control Market Outlook, By Banking, Financial Services and Insurance (BFSI) (2020-2028) (US $MN)
35 Global Automated Border Control Market Outlook, By Chemical (2020-2028) (US $MN)
36 Global Automated Border Control Market Outlook, By Education (2020-2028) (US $MN)
37 Global Automated Border Control Market Outlook, By Energy & Utilities (2020-2028) (US $MN)
38 Global Automated Border Control Market Outlook, By Government (2020-2028) (US $MN)
39 Global Automated Border Control Market Outlook, By Healthcare (2020-2028) (US $MN)
40 Global Automated Border Control Market Outlook, By Hospitality (2020-2028) (US $MN)
41 Global Automated Border Control Market Outlook, By Information Technology (IT) & Telecom (2020-2028) (US $MN)
42 Global Automated Border Control Market Outlook, By Manufacturing (2020-2028) (US $MN)
43 Global Automated Border Control Market Outlook, By Oil & Gas (2020-2028) (US $MN)
44 Global Automated Border Control Market Outlook, By Retail (2020-2028) (US $MN)
45 Global Automated Border Control Market Outlook, By Transportation and Logistics (2020-2028) (US $MN)
Note- Tables for North America, Europe, APAC, South America, and Middle East & Africa Regions are also represented in the same manner as above.
List of Figures
RESEARCH METHODOLOGY

We at ‘Stratistics’ opt for an extensive research approach which involves data mining, data validation, and data analysis. The various research sources include in-house repository, secondary research, competitor’s sources, social media research, client internal data, and primary research.
Our team of analysts prefers the most reliable and authenticated data sources in order to perform the comprehensive literature search. With access to most of the authenticated data bases our team highly considers the best mix of information through various sources to obtain extensive and accurate analysis.
Each report takes an average time of a month and a team of 4 industry analysts. The time may vary depending on the scope and data availability of the desired market report. The various parameters used in the market assessment are standardized in order to enhance the data accuracy.
Data Mining
The data is collected from several authenticated, reliable, paid and unpaid sources and is filtered depending on the scope & objective of the research. Our reports repository acts as an added advantage in this procedure. Data gathering from the raw material suppliers, distributors and the manufacturers is performed on a regular basis, this helps in the comprehensive understanding of the products value chain. Apart from the above mentioned sources the data is also collected from the industry consultants to ensure the objective of the study is in the right direction.
Market trends such as technological advancements, regulatory affairs, market dynamics (Drivers, Restraints, Opportunities and Challenges) are obtained from scientific journals, market related national & international associations and organizations.
Data Analysis
From the data that is collected depending on the scope & objective of the research the data is subjected for the analysis. The critical steps that we follow for the data analysis include:
- Product Lifecycle Analysis
- Competitor analysis
- Risk analysis
- Porters Analysis
- PESTEL Analysis
- SWOT Analysis
The data engineering is performed by the core industry experts considering both the Marketing Mix Modeling and the Demand Forecasting. The marketing mix modeling makes use of multiple-regression techniques to predict the optimal mix of marketing variables. Regression factor is based on a number of variables and how they relate to an outcome such as sales or profits.
Data Validation
The data validation is performed by the exhaustive primary research from the expert interviews. This includes telephonic interviews, focus groups, face to face interviews, and questionnaires to validate our research from all aspects. The industry experts we approach come from the leading firms, involved in the supply chain ranging from the suppliers, distributors to the manufacturers and consumers so as to ensure an unbiased analysis.
We are in touch with more than 15,000 industry experts with the right mix of consultants, CEO's, presidents, vice presidents, managers, experts from both supply side and demand side, executives and so on.
The data validation involves the primary research from the industry experts belonging to:
- Leading Companies
- Suppliers & Distributors
- Manufacturers
- Consumers
- Industry/Strategic Consultants
Apart from the data validation the primary research also helps in performing the fill gap research, i.e. providing solutions for the unmet needs of the research which helps in enhancing the reports quality.
For more details about research methodology, kindly write to us at info@strategymrc.com
Frequently Asked Questions
In case of any queries regarding this report, you can contact the customer service by filing the “Inquiry Before Buy” form available on the right hand side. You may also contact us through email: info@strategymrc.com or phone: +1-301-202-5929
Yes, the samples are available for all the published reports. You can request them by filling the “Request Sample” option available in this page.
Yes, you can request a sample with your specific requirements. All the customized samples will be provided as per the requirement with the real data masked.
All our reports are available in Digital PDF format. In case if you require them in any other formats, such as PPT, Excel etc you can submit a request through “Inquiry Before Buy” form available on the right hand side. You may also contact us through email: info@strategymrc.com or phone: +1-301-202-5929
We offer a free 15% customization with every purchase. This requirement can be fulfilled for both pre and post sale. You may send your customization requirements through email at info@strategymrc.com or call us on +1-301-202-5929.
We have 3 different licensing options available in electronic format.
- Single User Licence: Allows one person, typically the buyer, to have access to the ordered product. The ordered product cannot be distributed to anyone else.
- 2-5 User Licence: Allows the ordered product to be shared among a maximum of 5 people within your organisation.
- Corporate License: Allows the product to be shared among all employees of your organisation regardless of their geographical location.
All our reports are typically be emailed to you as an attachment.
To order any available report you need to register on our website. The payment can be made either through CCAvenue or PayPal payments gateways which accept all international cards.
We extend our support to 6 months post sale. A post sale customization is also provided to cover your unmet needs in the report.
Request Customization
We offer complimentary customization of up to 15% with every purchase. To share your customization requirements, feel free to email us at info@strategymrc.com or call us on +1-301-202-5929. .
Please Note: Customization within the 15% threshold is entirely free of charge. If your request exceeds this limit, we will conduct a feasibility assessment. Following that, a detailed quote and timeline will be provided.
WHY CHOOSE US ?

Assured Quality
Best in class reports with high standard of research integrity

24X7 Research Support
Continuous support to ensure the best customer experience.

Free Customization
Adding more values to your product of interest.

Safe & Secure Access
Providing a secured environment for all online transactions.

Trusted by 600+ Brands
Serving the most reputed brands across the world.