
Biomethane Market
Biomethane Market Forecasts to 2028 - Global Analysis By Feedstock Energy Crops, Animal Manure and Other Products), Production Method (Fermentation and Gasification), Application and By Geography

|
Years Covered |
2020-2028 |
|
Estimated Year Value (2022) |
US $2.25 BN |
|
Projected Year Value (2028) |
US $3.75 BN |
|
CAGR (2022 - 2028) |
8.9% |
|
Regions Covered |
North America, Europe, Asia Pacific, South America, and Middle East & Africa |
|
Countries Covered |
US, Canada, Mexico, Germany, UK, Italy, France, Spain, Japan, China, India, Australia, New Zealand, South Korea, Rest of Asia Pacific, South America, Argentina, Brazil, Chile, Middle East & Africa, Saudi Arabia, UAE, Qatar, and South Africa |
|
Largest Market |
North America |
|
Highest Growing Market |
Europe |
According to Stratistics MRC, the Global Biomethane Market is accounted for $2.25 billion in 2022 and is expected to reach $3.75 billion by 2028 growing at a CAGR of 8.9% during the forecast period. Anaerobic respiration or gasification of organic matter, including plant and animal waste, sewage, manure, industrial waste, and green waste, results in the production of biomethane, a natural gas. Biomethane is created by extracting methane from biogas that has a high calorific value. The power generation used in the car industry could benefit from the usage of biomethane, which also lowers greenhouse gas emissions. There are no additional production costs because biomethane is produced utilising the same infrastructure as natural gas. Rising environmental concerns are one of the key factors propelling the growth of the biomethane market.
According to the International Energy Agency, the global energy demand is expected to witness a year-on-year growth rate of 9% till 2030. According to the World Biogas Association (WBA), Biogas can reduce global GHG emissions by 10-13% and provide renewable energy from the world's food waste, industrial production wastes, feedstocks from agriculture, and sewage.
Market Dynamics:
Driver:
Rising environmental concerns
The fact that biomethane contributes to a decrease in greenhouse gas emissions is one of its major drivers. One of bio methane's most major environmental advantages is without a doubt the effect it has on the planet's atmosphere. Because carbon dioxide and other gases that contribute to the greenhouse effect are released during the breakdown of organic matter, unlike conventional energy sources, biomethane does not raise the concentration of greenhouse gases. In other words, biomethane is one of the best solutions to meet the rising energy demand without causing global warming, which puts all life on Earth in danger, including humans.
Restraint:
High Combustible Nature of Biomethane
Methane (CH4) is a colourless, odourless gas that is also very explosive. Water vapour and carbon dioxide are released during combustion. It can be produced synthetically or organically. Natural gas is the primary fuel used to generate heat and energy throughout the world. Chemical procedures are used to create the chemical compound carbon black, which is found in some types of tyre rubber. This is a limiting element because biomethane synthesis and transportation require a lot of care and attention.
Opportunity:
Rise in demand for green and clean fuel in automotive sector
In order to meet the energy demands of developing nations worldwide, traditional energy production operations are gradually being diversified to include renewable energy sources. The recent Climate Change Summit in Paris has encouraged several nations to adopt more renewable energy and cleaner fuels. According to projections, the automobile sector will account for a sizable amount of the world's demand for biomethane. Given that the automobile industry is a major source of greenhouse gas emissions, using biomethane as a vehicle fuel is anticipated to immediately benefit the environment through reduced emissions. Because biomethane and natural gas have comparable characteristics, the latter can be used in place of the former.
Threat:
Enormous Financial Investments
Capital requirements are the main barrier to the production of renewable natural gas. A production unit, trash collection, gas transportation, and distribution lines must all be established by the industry. Additionally, a lot of initiatives require government assistance, yet the government also contributes a certain amount of funds. The inefficiency of the methods utilised to produce biogas and the presence of pollutants in the finished product are further problems that could limit the market's expansion.
Covid-19 Impact
The global biomethane market is impacted by COVID-19, much like other industries. Businesses were shut down and there was a lockdown, which disrupted the value chain. Despite the fact that the coronavirus pandemic has weakened every industry in the biomethane market, producers are opening up new possibilities due to the growing number of applications for biomethane. For producers in the biomethane industry, the increased demand for environmentally acceptable biomethane in automotive and power production applications is generating revenue streams. Manufacturers are making efforts to make up for losses resulting from the COVID-19 epidemic and are looking into other opportunities to address market difficulties with biomethane.
The agricultural waste segment is expected to be the largest during the forecast period
The agricultural waste segment is estimated to have a lucrative growth. Agricultural plants use the organic waste found on farms to produce biogas, a renewable fuel source. The energy crops that have been bred especially for usage in agricultural wastes can be taken by these plants. Goober gas plants are another name for biogas facilities. Farmers that practise mixed farming use both plantation and cattle land. Furthermore, regional differences in the characteristics of cattle are significant. Due to the many cultures and religions present in some areas, different livestock pairings exist.
The automotive segment is expected to have the highest CAGR during the forecast period
The automotive segment is anticipated to witness the fastest CAGR growth during the forecast period. The use of biomethane as an automotive fuel is likely to immediately benefit the environment in terms of lower emissions because the automotive industry is responsible for a sizable volume of greenhouse gas emissions. Natural gas and biomethane have similar qualities, allowing the former to be used in place of the latter. As a result, biomethane can be added to natural gas grids and utilised as part of the fuel mix for vehicles.
Region with highest share:
North America is projected to hold the largest market share during the forecast period. Increasing demand for biogas for power generation applications, technical developments, and growing environmental awareness are some of the main factors propelling regional market expansion. Rising urbanisation and sectorial growth and development are further factors contributing to the region's significant market share. The biomethane market is anticipated to rise as a result of increased investments in biogas technology and increased regional government support.
Region with highest CAGR:
Europe is projected to have the highest CAGR over the forecast period, owing to the increased environmental awareness, technical developments, and demand for biogas, there has been an increase in the market for biogas for power-generating applications. Additionally, the region's primary market share is influenced by industry growth and development as well as fast urbanisation. Due to growing investments in biogas technology and increased support from regional governments, it is anticipated that the biomethane market in Europe will grow throughout the forecast period.

Key players in the market
Some of the key players profiled in the Biomethane Market include EnviTec Biogas AG, Future Biogas Limited, Ameresco, RENERGON International AG, Quantum Green, Storm Fisher, Scandinavian Biogas, Planet Biogas Global GmbH, AB Holding SPA, WELTEC BIOPOWER GMBH, Magne Gas, VERBIO, SoCalGas
Key Developments:
In October 2021, WELTEC BIOPOWER, an RNG plant manufacturer, announced a service partnership agreement with Bristola, a company based in the U.S. The main purpose of this partnership is to promote renewable energies by service and by building efficient biogas plant expansion.
In July 2021, Weber Green Tech, a partner and investor in Renergon International AG, invests in advanced biogas technology to support the global sustainability goals of energy conversion. This merger creates a new major player in operation and construction of organic waste processing plants.
In June 2021, Liquind 24/7 and EnviTec announced signing an agreement for the sale of Bio-LNG. A new liquefaction plant will produce this bio-LNG, and EnviTec will construct this plant in Pomerania, Germany, by EnviTec. The transport and distribution of bio-LNG to heavy-duty customers at its truck fueling stations will be organized by Liquind.
In May 2021, LIQVIS GmbH and EnviTec signed a contract for the supply of bio-LNG. EnviTec will start supplying bio-LNG in the third quarter of 2022, and this bio-LNG will be produced from the biogas plant in Gustrow.
In May 2021, Weltec Biopower GmbH is building a biomethane plant for the Spanish dairy cattle farm Torre Santamaria. The farm has already secured contractually sales of biomethane at an early stage.
Feedstock’s Covered:
• Energy Crops
• Animal Manure
• Sewage Sludge
• Agricultural Waste
• Organic Household Waste
• Industrial Food Processing Waste
• Waste Derived
• Other Feedstock’s
Production Methods Covered:
• Fermentation
• Gasification
Applications Covered:
• Automotive
• Power Generation
• Other Applications
Regions Covered:
• North America
o US
o Canada
o Mexico
• Europe
o Germany
o UK
o Italy
o France
o Spain
o Rest of Europe
• Asia Pacific
o Japan
o China
o India
o Australia
o New Zealand
o South Korea
o Rest of Asia Pacific
• South America
o Argentina
o Brazil
o Chile
o Rest of South America
• Middle East & Africa
o Saudi Arabia
o UAE
o Qatar
o South Africa
o Rest of Middle East & Africa
What our report offers:
- Market share assessments for the regional and country-level segments
- Strategic recommendations for the new entrants
- Covers Market data for the years 2020, 2021, 2022, 2025, and 2028
- Market Trends (Drivers, Constraints, Opportunities, Threats, Challenges, Investment Opportunities, and recommendations)
- Strategic recommendations in key business segments based on the market estimations
- Competitive landscaping mapping the key common trends
- Company profiling with detailed strategies, financials, and recent developments
- Supply chain trends mapping the latest technological advancements
Free Customization Offerings:
All the customers of this report will be entitled to receive one of the following free customization options:
• Company Profiling
o Comprehensive profiling of additional market players (up to 3)
o SWOT Analysis of key players (up to 3)
• Regional Segmentation
o Market estimations, Forecasts and CAGR of any prominent country as per the client's interest (Note: Depends on feasibility check)
• Competitive Benchmarking
o Benchmarking of key players based on product portfolio, geographical presence, and strategic alliances
Table of Contents
1 Executive Summary
2 Preface
2.1 Abstract
2.2 Stake Holders
2.3 Research Scope
2.4 Research Methodology
2.4.1 Data Mining
2.4.2 Data Analysis
2.4.3 Data Validation
2.4.4 Research Approach
2.5 Research Sources
2.5.1 Primary Research Sources
2.5.2 Secondary Research Sources
2.5.3 Assumptions
3 Market Trend Analysis
3.1 Introduction
3.2 Drivers
3.3 Restraints
3.4 Opportunities
3.5 Threats
3.6 Application Analysis
3.7 Emerging Markets
3.8 Impact of Covid-19
4 Porters Five Force Analysis
4.1 Bargaining power of suppliers
4.2 Bargaining power of buyers
4.3 Threat of substitutes
4.4 Threat of new entrants
4.5 Competitive rivalry
5 Global Biomethane Market, By Feedstock
5.1 Introduction
5.2 Energy Crops
5.3 Animal Manure
5.4 Sewage Sludge
5.5 Agricultural Waste
5.6 Organic Household Waste
5.7 Industrial Food Processing Waste
5.8 Waste Derived
5.9 Other Feedstocks
6 Global Biomethane Market, By Production Method
6.1 Introduction
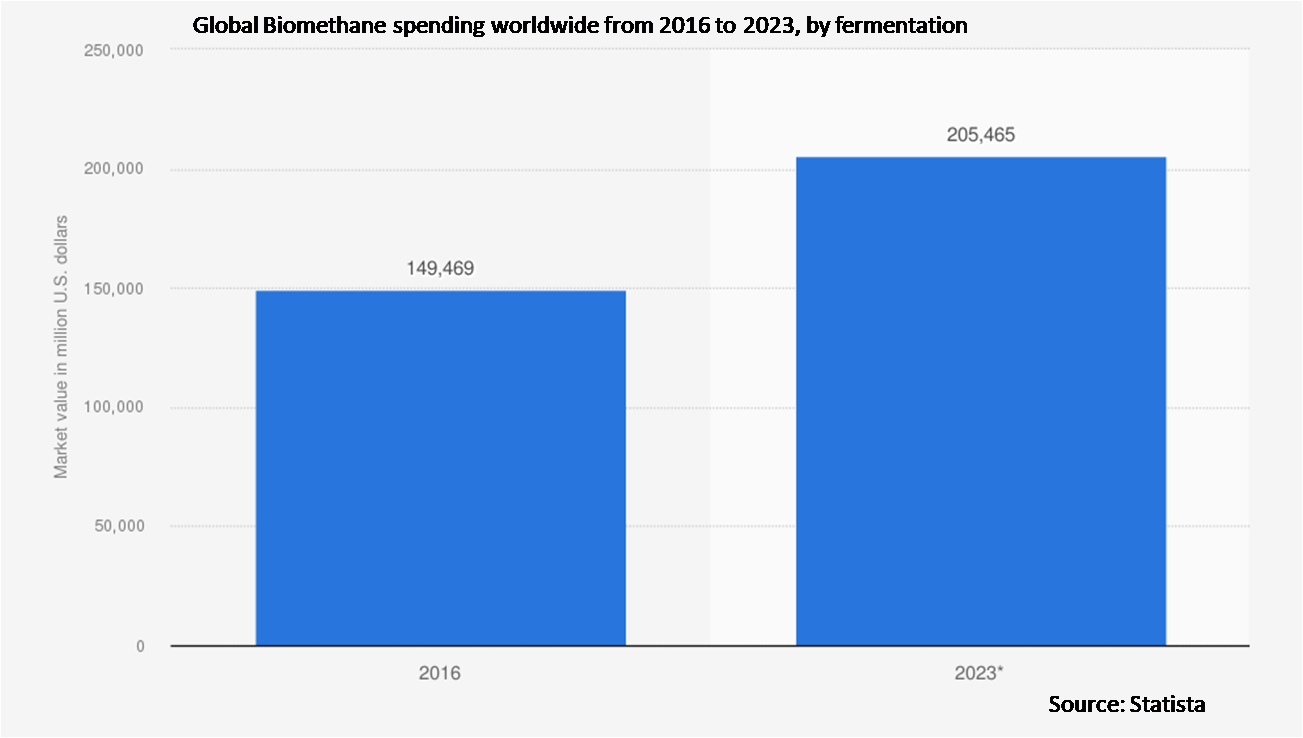
6.2 Fermentation
6.3 Gasification
7 Global Biomethane Market, By Application
7.1 Introduction
7.2 Automotive
7.3 Power Generation
7.4 Other Applications
8 Global Biomethane Market, By Geography
8.1 Introduction
8.2 North America
8.2.1 US
8.2.2 Canada
8.2.3 Mexico
8.3 Europe
8.3.1 Germany
8.3.2 UK
8.3.3 Italy
8.3.4 France
8.3.5 Spain
8.3.6 Rest of Europe
8.4 Asia Pacific
8.4.1 Japan
8.4.2 China
8.4.3 India
8.4.4 Australia
8.4.5 New Zealand
8.4.6 South Korea
8.4.7 Rest of Asia Pacific
8.5 South America
8.5.1 Argentina
8.5.2 Brazil
8.5.3 Chile
8.5.4 Rest of South America
8.6 Middle East & Africa
8.6.1 Saudi Arabia
8.6.2 UAE
8.6.3 Qatar
8.6.4 South Africa
8.6.5 Rest of Middle East & Africa
9 Key Developments
9.1 Agreements, Partnerships, Collaborations and Joint Ventures
9.2 Acquisitions & Mergers
9.3 New Product Launch
9.4 Expansions
9.5 Other Key Strategies
10 Company Profiling
10.1 EnviTec Biogas AG
10.2 Future Biogas Limited
10.3 Ameresco
10.4 RENERGON International AG
10.5 Quantum Green
10.6 StormFisher
10.7 Scandinavian Biogas
10.8 PlanET Biogas Global GmbH
10.9 AB Holding SPA
10.10 WELTEC BIOPOWER GMBH
10.11 Magne Gas
10.12 VERBIO
10.13 SoCalGas
List of Tables
1 Global Biomethane Market Outlook, By Region (2020-2028) ($MN)
2 Global Biomethane Market Outlook, By Feedstock (2020-2028) ($MN)
3 Global Biomethane Market Outlook, By Energy Crops (2020-2028) ($MN)
4 Global Biomethane Market Outlook, By Animal Manure (2020-2028) ($MN)
5 Global Biomethane Market Outlook, By Sewage Sludge (2020-2028) ($MN)
6 Global Biomethane Market Outlook, By Agricultural Waste (2020-2028) ($MN)
7 Global Biomethane Market Outlook, By Organic Household Waste (2020-2028) ($MN)
8 Global Biomethane Market Outlook, By Industrial Food Processing Waste (2020-2028) ($MN)
9 Global Biomethane Market Outlook, By Waste Derived (2020-2028) ($MN)
10 Global Biomethane Market Outlook, By Other Feedstocks (2020-2028) ($MN)
11 Global Biomethane Market Outlook, By Production Method (2020-2028) ($MN)
12 Global Biomethane Market Outlook, By Fermentation (2020-2028) ($MN)
13 Global Biomethane Market Outlook, By Gasification (2020-2028) ($MN)
14 Global Biomethane Market Outlook, By Application (2020-2028) ($MN)
15 Global Biomethane Market Outlook, By Automotive (2020-2028) ($MN)
16 Global Biomethane Market Outlook, By Power Generation (2020-2028) ($MN)
17 Global Biomethane Market Outlook, By Other Applications (2020-2028) ($MN)
18 North America Biomethane Market Outlook, By Country (2020-2028) ($MN)
19 North America Biomethane Market Outlook, By Feedstock (2020-2028) ($MN)
20 North America Biomethane Market Outlook, By Energy Crops (2020-2028) ($MN)
21 North America Biomethane Market Outlook, By Animal Manure (2020-2028) ($MN)
22 North America Biomethane Market Outlook, By Sewage Sludge (2020-2028) ($MN)
23 North America Biomethane Market Outlook, By Agricultural Waste (2020-2028) ($MN)
24 North America Biomethane Market Outlook, By Organic Household Waste (2020-2028) ($MN)
25 North America Biomethane Market Outlook, By Industrial Food Processing Waste (2020-2028) ($MN)
26 North America Biomethane Market Outlook, By Waste Derived (2020-2028) ($MN)
27 North America Biomethane Market Outlook, By Other Feedstocks (2020-2028) ($MN)
28 North America Biomethane Market Outlook, By Production Method (2020-2028) ($MN)
29 North America Biomethane Market Outlook, By Fermentation (2020-2028) ($MN)
30 North America Biomethane Market Outlook, By Gasification (2020-2028) ($MN)
31 North America Biomethane Market Outlook, By Application (2020-2028) ($MN)
32 North America Biomethane Market Outlook, By Automotive (2020-2028) ($MN)
33 North America Biomethane Market Outlook, By Power Generation (2020-2028) ($MN)
34 North America Biomethane Market Outlook, By Other Applications (2020-2028) ($MN)
35 Europe Biomethane Market Outlook, By Country (2020-2028) ($MN)
36 Europe Biomethane Market Outlook, By Feedstock (2020-2028) ($MN)
37 Europe Biomethane Market Outlook, By Energy Crops (2020-2028) ($MN)
38 Europe Biomethane Market Outlook, By Animal Manure (2020-2028) ($MN)
39 Europe Biomethane Market Outlook, By Sewage Sludge (2020-2028) ($MN)
40 Europe Biomethane Market Outlook, By Agricultural Waste (2020-2028) ($MN)
41 Europe Biomethane Market Outlook, By Organic Household Waste (2020-2028) ($MN)
42 Europe Biomethane Market Outlook, By Industrial Food Processing Waste (2020-2028) ($MN)
43 Europe Biomethane Market Outlook, By Waste Derived (2020-2028) ($MN)
44 Europe Biomethane Market Outlook, By Other Feedstocks (2020-2028) ($MN)
45 Europe Biomethane Market Outlook, By Production Method (2020-2028) ($MN)
46 Europe Biomethane Market Outlook, By Fermentation (2020-2028) ($MN)
47 Europe Biomethane Market Outlook, By Gasification (2020-2028) ($MN)
48 Europe Biomethane Market Outlook, By Application (2020-2028) ($MN)
49 Europe Biomethane Market Outlook, By Automotive (2020-2028) ($MN)
50 Europe Biomethane Market Outlook, By Power Generation (2020-2028) ($MN)
51 Europe Biomethane Market Outlook, By Other Applications (2020-2028) ($MN)
52 Asia Pacific Biomethane Market Outlook, By Country (2020-2028) ($MN)
53 Asia Pacific Biomethane Market Outlook, By Feedstock (2020-2028) ($MN)
54 Asia Pacific Biomethane Market Outlook, By Energy Crops (2020-2028) ($MN)
55 Asia Pacific Biomethane Market Outlook, By Animal Manure (2020-2028) ($MN)
56 Asia Pacific Biomethane Market Outlook, By Sewage Sludge (2020-2028) ($MN)
57 Asia Pacific Biomethane Market Outlook, By Agricultural Waste (2020-2028) ($MN)
58 Asia Pacific Biomethane Market Outlook, By Organic Household Waste (2020-2028) ($MN)
59 Asia Pacific Biomethane Market Outlook, By Industrial Food Processing Waste (2020-2028) ($MN)
60 Asia Pacific Biomethane Market Outlook, By Waste Derived (2020-2028) ($MN)
61 Asia Pacific Biomethane Market Outlook, By Other Feedstocks (2020-2028) ($MN)
62 Asia Pacific Biomethane Market Outlook, By Production Method (2020-2028) ($MN)
63 Asia Pacific Biomethane Market Outlook, By Fermentation (2020-2028) ($MN)
64 Asia Pacific Biomethane Market Outlook, By Gasification (2020-2028) ($MN)
65 Asia Pacific Biomethane Market Outlook, By Application (2020-2028) ($MN)
66 Asia Pacific Biomethane Market Outlook, By Automotive (2020-2028) ($MN)
67 Asia Pacific Biomethane Market Outlook, By Power Generation (2020-2028) ($MN)
68 Asia Pacific Biomethane Market Outlook, By Other Applications (2020-2028) ($MN)
69 South America Biomethane Market Outlook, By Country (2020-2028) ($MN)
70 South America Biomethane Market Outlook, By Feedstock (2020-2028) ($MN)
71 South America Biomethane Market Outlook, By Energy Crops (2020-2028) ($MN)
72 South America Biomethane Market Outlook, By Animal Manure (2020-2028) ($MN)
73 South America Biomethane Market Outlook, By Sewage Sludge (2020-2028) ($MN)
74 South America Biomethane Market Outlook, By Agricultural Waste (2020-2028) ($MN)
75 South America Biomethane Market Outlook, By Organic Household Waste (2020-2028) ($MN)
76 South America Biomethane Market Outlook, By Industrial Food Processing Waste (2020-2028) ($MN)
77 South America Biomethane Market Outlook, By Waste Derived (2020-2028) ($MN)
78 South America Biomethane Market Outlook, By Other Feedstocks (2020-2028) ($MN)
79 South America Biomethane Market Outlook, By Production Method (2020-2028) ($MN)
80 South America Biomethane Market Outlook, By Fermentation (2020-2028) ($MN)
81 South America Biomethane Market Outlook, By Gasification (2020-2028) ($MN)
82 South America Biomethane Market Outlook, By Application (2020-2028) ($MN)
83 South America Biomethane Market Outlook, By Automotive (2020-2028) ($MN)
84 South America Biomethane Market Outlook, By Power Generation (2020-2028) ($MN)
85 South America Biomethane Market Outlook, By Other Applications (2020-2028) ($MN)
86 Middle East & Africa Biomethane Market Outlook, By Country (2020-2028) ($MN)
87 Middle East & Africa Biomethane Market Outlook, By Feedstock (2020-2028) ($MN)
88 Middle East & Africa Biomethane Market Outlook, By Energy Crops (2020-2028) ($MN)
89 Middle East & Africa Biomethane Market Outlook, By Animal Manure (2020-2028) ($MN)
90 Middle East & Africa Biomethane Market Outlook, By Sewage Sludge (2020-2028) ($MN)
91 Middle East & Africa Biomethane Market Outlook, By Agricultural Waste (2020-2028) ($MN)
92 Middle East & Africa Biomethane Market Outlook, By Organic Household Waste (2020-2028) ($MN)
93 Middle East & Africa Biomethane Market Outlook, By Industrial Food Processing Waste (2020-2028) ($MN)
94 Middle East & Africa Biomethane Market Outlook, By Waste Derived (2020-2028) ($MN)
95 Middle East & Africa Biomethane Market Outlook, By Other Feedstocks (2020-2028) ($MN)
96 Middle East & Africa Biomethane Market Outlook, By Production Method (2020-2028) ($MN)
97 Middle East & Africa Biomethane Market Outlook, By Fermentation (2020-2028) ($MN)
98 Middle East & Africa Biomethane Market Outlook, By Gasification (2020-2028) ($MN)
99 Middle East & Africa Biomethane Market Outlook, By Application (2020-2028) ($MN)
100 Middle East & Africa Biomethane Market Outlook, By Automotive (2020-2028) ($MN)
101 Middle East & Africa Biomethane Market Outlook, By Power Generation (2020-2028) ($MN)
102 Middle East & Africa Biomethane Market Outlook, By Other Applications (2020-2028) ($MN)
List of Figures
RESEARCH METHODOLOGY

We at ‘Stratistics’ opt for an extensive research approach which involves data mining, data validation, and data analysis. The various research sources include in-house repository, secondary research, competitor’s sources, social media research, client internal data, and primary research.
Our team of analysts prefers the most reliable and authenticated data sources in order to perform the comprehensive literature search. With access to most of the authenticated data bases our team highly considers the best mix of information through various sources to obtain extensive and accurate analysis.
Each report takes an average time of a month and a team of 4 industry analysts. The time may vary depending on the scope and data availability of the desired market report. The various parameters used in the market assessment are standardized in order to enhance the data accuracy.
Data Mining
The data is collected from several authenticated, reliable, paid and unpaid sources and is filtered depending on the scope & objective of the research. Our reports repository acts as an added advantage in this procedure. Data gathering from the raw material suppliers, distributors and the manufacturers is performed on a regular basis, this helps in the comprehensive understanding of the products value chain. Apart from the above mentioned sources the data is also collected from the industry consultants to ensure the objective of the study is in the right direction.
Market trends such as technological advancements, regulatory affairs, market dynamics (Drivers, Restraints, Opportunities and Challenges) are obtained from scientific journals, market related national & international associations and organizations.
Data Analysis
From the data that is collected depending on the scope & objective of the research the data is subjected for the analysis. The critical steps that we follow for the data analysis include:
- Product Lifecycle Analysis
- Competitor analysis
- Risk analysis
- Porters Analysis
- PESTEL Analysis
- SWOT Analysis
The data engineering is performed by the core industry experts considering both the Marketing Mix Modeling and the Demand Forecasting. The marketing mix modeling makes use of multiple-regression techniques to predict the optimal mix of marketing variables. Regression factor is based on a number of variables and how they relate to an outcome such as sales or profits.
Data Validation
The data validation is performed by the exhaustive primary research from the expert interviews. This includes telephonic interviews, focus groups, face to face interviews, and questionnaires to validate our research from all aspects. The industry experts we approach come from the leading firms, involved in the supply chain ranging from the suppliers, distributors to the manufacturers and consumers so as to ensure an unbiased analysis.
We are in touch with more than 15,000 industry experts with the right mix of consultants, CEO's, presidents, vice presidents, managers, experts from both supply side and demand side, executives and so on.
The data validation involves the primary research from the industry experts belonging to:
- Leading Companies
- Suppliers & Distributors
- Manufacturers
- Consumers
- Industry/Strategic Consultants
Apart from the data validation the primary research also helps in performing the fill gap research, i.e. providing solutions for the unmet needs of the research which helps in enhancing the reports quality.
For more details about research methodology, kindly write to us at info@strategymrc.com
Frequently Asked Questions
In case of any queries regarding this report, you can contact the customer service by filing the “Inquiry Before Buy” form available on the right hand side. You may also contact us through email: info@strategymrc.com or phone: +1-301-202-5929
Yes, the samples are available for all the published reports. You can request them by filling the “Request Sample” option available in this page.
Yes, you can request a sample with your specific requirements. All the customized samples will be provided as per the requirement with the real data masked.
All our reports are available in Digital PDF format. In case if you require them in any other formats, such as PPT, Excel etc you can submit a request through “Inquiry Before Buy” form available on the right hand side. You may also contact us through email: info@strategymrc.com or phone: +1-301-202-5929
We offer a free 15% customization with every purchase. This requirement can be fulfilled for both pre and post sale. You may send your customization requirements through email at info@strategymrc.com or call us on +1-301-202-5929.
We have 3 different licensing options available in electronic format.
- Single User Licence: Allows one person, typically the buyer, to have access to the ordered product. The ordered product cannot be distributed to anyone else.
- 2-5 User Licence: Allows the ordered product to be shared among a maximum of 5 people within your organisation.
- Corporate License: Allows the product to be shared among all employees of your organisation regardless of their geographical location.
All our reports are typically be emailed to you as an attachment.
To order any available report you need to register on our website. The payment can be made either through CCAvenue or PayPal payments gateways which accept all international cards.
We extend our support to 6 months post sale. A post sale customization is also provided to cover your unmet needs in the report.
Request Customization
We offer complimentary customization of up to 15% with every purchase. To share your customization requirements, feel free to email us at info@strategymrc.com or call us on +1-301-202-5929. .
Please Note: Customization within the 15% threshold is entirely free of charge. If your request exceeds this limit, we will conduct a feasibility assessment. Following that, a detailed quote and timeline will be provided.
WHY CHOOSE US ?

Assured Quality
Best in class reports with high standard of research integrity

24X7 Research Support
Continuous support to ensure the best customer experience.

Free Customization
Adding more values to your product of interest.

Safe & Secure Access
Providing a secured environment for all online transactions.

Trusted by 600+ Brands
Serving the most reputed brands across the world.