
Digital Map Market
Digital Map Market Forecasts to 2028 – Global Analysis By Functionality (Computerized, Global Positioning System (GPS) Navigation, Scientific), Mapping Type (Outdoor Mapping, Indoor Mapping, 3D and 4D Metaverse), and By Geography

|
Years Covered |
2020-2028 |
|
Estimated Year Value (2021) |
US $18.80 BN |
|
Projected Year Value (2028) |
US $48.51BN |
|
CAGR (2021 - 2028) |
14.5% |
|
Regions Covered |
North America, Europe, Asia Pacific, South America, and Middle East & Africa |
|
Countries Covered |
US, Canada, Mexico, Germany, UK, Italy, France, Spain, Japan, China, India, Australia, New Zealand, South Korea, Rest of Asia Pacific, South America, Argentina, Brazil, Chile, Middle East & Africa, Saudi Arabia, UAE, Qatar, and South Africa |
|
Largest Market |
Asia Pacific |
|
Highest Growing Market |
North America |
According to Stratistics MRC, the Global Digital Map Market is accounted for $18.80 billion in 2021 and is expected to reach $48.51 billion by 2028 growing at a CAGR of 14.5% during the forecast period. The digital map also termed as cartography is an electronic map, which operation is based on a combination of graphic elements assigned to it in the form of electronic information. Digital mapping is a process of collection and compilation of data to form a virtual image. It is based on naturally harvested and processed into digital cartographic data. The compiled data is used to produce digital maps that exactly represent a particular geographical area or feature, including major roads, rivers, and important landmarks such as airports, hospitals, and so on.
Market Dynamics:
Driver:
Rising user friendly technological advancements
There are a lot of technological advancements in digital maps such as landmarks, updated places of interest, traffic updates, road blocks, and others that make the digital maps more user-friendly. Moreover, the increase in competition among the providers of digital map technology is prompting the vendors to increase their product portfolios and to enhance their technology to offer more user-friendly maps to the customers. For example, Snapchat has launched a new user-friendly feature called "Snap Map", which allows users to see location of their friends and when they post their most recent snaps.
Restraint:
Security concerns and user privacy
With the increased usage of mobile application based navigation services that are integrated with digital maps, there is a dire need to adopt best practices for data security, app security and privacy of the user. While developing these types of applications, the developers often overlook certain standards that later fail to attain the required security levels. In these cases, the hackers can successfully perform phishing attacks and lead to damage. Hence, these issues are currently hampering the digital map market growth and are set to continue during the forecast period.
Opportunity:
Rising utilization of geospatial information
Geo-spatial information is experiencing a boom in recent years as it is utilized in a wide range of applications covering a spectrum of sectors and businesses such as infrastructure management, urban planning, risk and emergency management, marketing, resource management (mining, oil, gas, etc.), business planning, logistics, and more. Geo-information is also a foundation of future applications as it makes it possible to establish location, which is one of the key dimensions of context. For instance, Atos SE use geographic information system (GIS) platforms with location-based services (LBS) to offer services to businesses involved in supply chain management, data centers, infrastructure development, risk and emergency management, urban planning, healthcare, and navigation. In addition, technologies based on augmented reality utilize GIS information and 3D platforms to provide virtual information about users and their surroundings. This information helps enterprises understand the needs of users and send targeted advertisements to them.
Threat:
Lack of knowledge
The lack of appropriate knowledge and awareness has been a barrier in digital mapping solutions and acts as a factor responsible for the slow adoption of the technology. Most of the organizations that use location-based solutions and analytics struggle to optimally utilize the full potential of digital mapping technologies, as they lack expertise and well-skilled technicians who can deal with digital spatial data and the occurring issues. Hence, increasing knowledge-sharing and awareness among customers through different means, such as company blogs, forums, RoI analysis, and industry conferences, could help in fueling the market adoption and growth of the digital maps market, globally.
The automotive segment is expected to be the largest during the forecast period
The automotive segment is estimated to have a lucrative growth. With the rising demand for autonomous vehicles and usage of digital maps for navigation is further elevating the digital map market. In addition, the significant developments in the digital map technologies that facilitate autonomous vehicles with exact location, environment and drivable path, with high levels of accuracy, robustness, reliability and other factors are impacting the growth of the digital map market. The increase in collaborations and partnerships of major companies such as Nissans partnership with Tom Tom Internatinal BV., and so on are further boosting the market. Moreover, in 2019, Nissan has launched Nissan LEAF, a connected electric car with the digital maps and traffic from Tom Tom. Therefore the increase in the developments from the automotive sector is boosting up the Digital Map market during the forecast period.
The digital orthophotography segment is expected to have the highest CAGR during the forecast period
The digital orthophotography segment is anticipated to witness the fastest CAGR growth during the forecast period due to the growth of image-processing, data analysis technology, and the increasing applications in multiple end-use segments such as automotive and mobile devices. Orthophotography combines the image characteristics of an aerial photograph with the geometric qualities of a map. Digital Orthophotography technology avails farmers with digital farm management services that help in analyzing the high & low fertile area of the farm and many other factors that supports farmers in making decisions based on concrete data.
Region with highest share:
Asia Pacific is projected to hold the largest market share during the forecast period owing to the increased utilization of digital map solutions for mobile data coverage, e-commerce applications, supply chain & logistics management, environmental monitoring, and urban planning, in all the Asian countries. Countries including India, China, Singapore, Japan, Australia, and South Korea have seen a major shift in technological adoption in recent years. Additionally, increased automobile applications for digital maps are influencing the market growth in the region. The recent partnership between TomTom International B.V. and Nissan Motor Co., Ltd. (Japan) for the autonomous connected system is expected to create potential space for digital map solutions in the coming years. As developing economies, China and India are building their road network to reciprocate the logistic demand for the fast movement of goods and raw materials.
Region with highest CAGR:
North America is projected to have the highest CAGR over the forecast period owing to he growing number of digital map players across region. Key factors favouring the growth of the digital map market in North America include the increasing technological advancements in the region. The existence of significant competitors in the market, as well as the simplicity with which digital mapping solutions for the automobile, transport & distribution, and construction sectors are made available, are helping to further grow the market in North America.

Key players in the market
Some of the key players profiled in the Digital Map Market include Alibaba Group, Apple, ESRI, Google, HERE Technologies, Inpixon, INRIX, LightBox, MapQuest, META, Nearmap, ServiceNow, and TomTom.
Key Developments:
In February 2021, Inpixon launched RTLS Anchor board, a platform which was aimed to promote the deployment of sizable, real-time location systems (RTLS) in mainstream market operations.
In February 2020, ServiceNow launched Kiosk which turns any iPad tablet into an interactive kiosk with this app. It works both online and offline and provides features that offer great experience.
Functionalities Covered:
• Computerized
• Global Positioning System (GPS) Navigation
• Scientific
Mapping Types Covered:
• Outdoor Mapping
• Indoor Mapping
• 3D and 4D Metaverse
Components Covered:
• Solutions
• Services
Technologies Covered:
• Aerial Photography
• Digital Orthophotography
• Geographic Information System
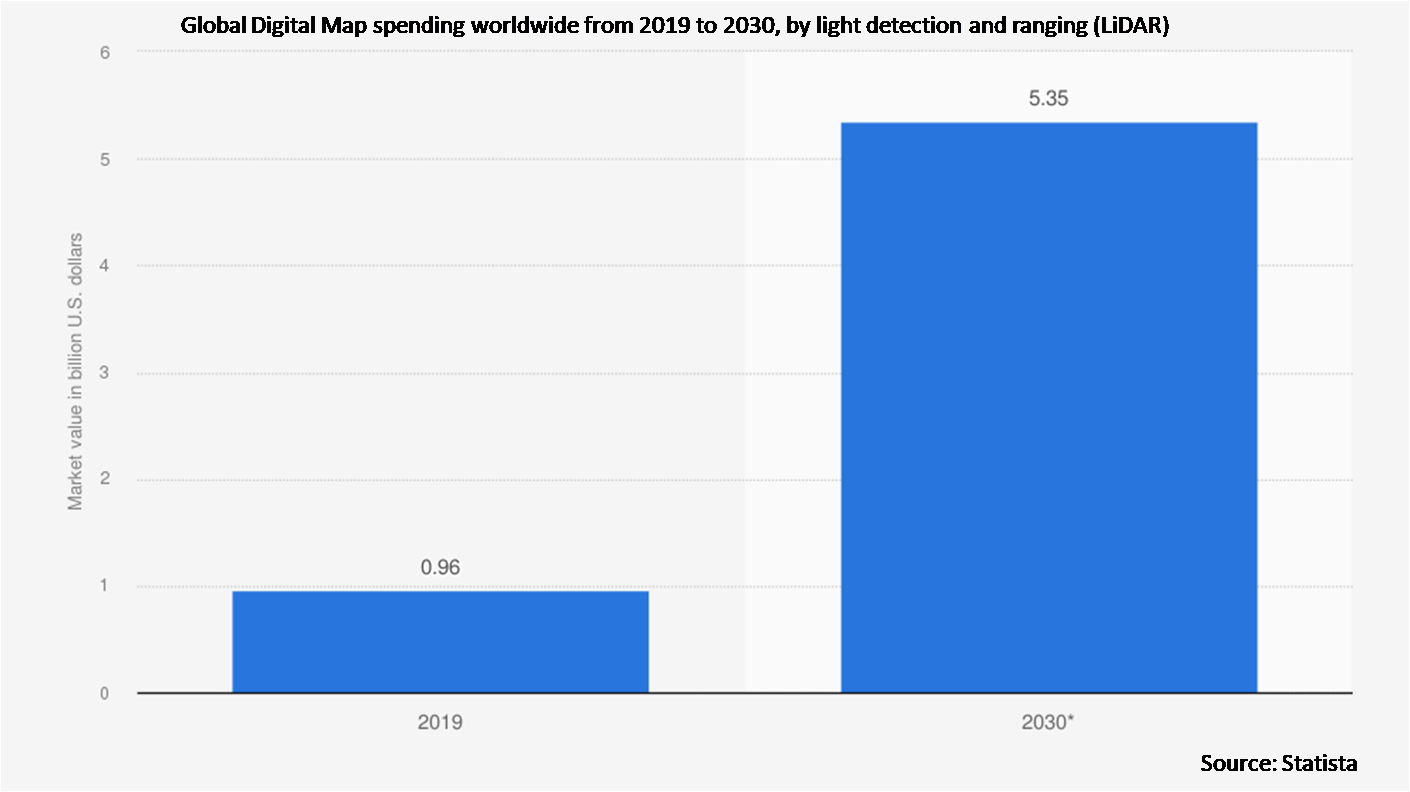
• Light Detection and Ranging (LiDAR)
Deployments Covered:
• On-Premise
• Cloud
Applications Covered:
• Asset Tracking
• Catchment Analysis
• Geocoding and Geo-positioning
• Real-Time Location Data Management
• Reverse Geocoding
• Risk Assessment & Disaster Management
• Routing and Navigation
• Tracking & Telematics
End Users Covered:
• Agriculture, Oil and Gas, and Other Natural Resources
• Automotive
• Energy & Utilities
• Government and Homeland Security
• Infrastructure Development and Construction
• Logistics, Travel, and Transportation
• Military & Defense
• Mobile Devices
• Telecommunication
Regions Covered:
• North America
o US
o Canada
o Mexico
• Europe
o Germany
o UK
o Italy
o France
o Spain
o Rest of Europe
• Asia Pacific
o Japan
o China
o India
o Australia
o New Zealand
o South Korea
o Rest of Asia Pacific
• South America
o Argentina
o Brazil
o Chile
o Rest of South America
• Middle East & Africa
o Saudi Arabia
o UAE
o Qatar
o South Africa
o Rest of Middle East & Africa
What our report offers:
- Market share assessments for the regional and country-level segments
- Strategic recommendations for the new entrants
- Covers Market data for the years 2020, 2021, 2022, 2025, and 2028
- Market Trends (Drivers, Constraints, Opportunities, Threats, Challenges, Investment Opportunities, and recommendations)
- Strategic recommendations in key business segments based on the market estimations
- Competitive landscaping mapping the key common trends
- Company profiling with detailed strategies, financials, and recent developments
- Supply chain trends mapping the latest technological advancements
Free Customization Offerings:
All the customers of this report will be entitled to receive one of the following free customization options:
• Company Profiling
o Comprehensive profiling of additional market players (up to 3)
o SWOT Analysis of key players (up to 3)
• Regional Segmentation
o Market estimations, Forecasts and CAGR of any prominent country as per the client's interest (Note: Depends on feasibility check)
• Competitive Benchmarking
o Benchmarking of key players based on product portfolio, geographical presence, and strategic alliances
Table of Contents
1 Executive Summary
2 Preface
2.1 Abstract
2.2 Stake Holders
2.3 Research Scope
2.4 Research Methodology
2.4.1 Data Mining
2.4.2 Data Analysis
2.4.3 Data Validation
2.4.4 Research Approach
2.5 Research Sources
2.5.1 Primary Research Sources
2.5.2 Secondary Research Sources
2.5.3 Assumptions
3 Market Trend Analysis
3.1 Introduction
3.2 Drivers
3.3 Restraints
3.4 Opportunities
3.5 Threats
3.6 Technology Analysis
3.7 Application Analysis
3.8 End User Analysis
3.9 Emerging Markets
3.10 Impact of Covid-19
4 Porters Five Force Analysis
4.1 Bargaining power of suppliers
4.2 Bargaining power of buyers
4.3 Threat of substitutes
4.4 Threat of new entrants
4.5 Competitive rivalry
5 Global Digital Map Market, By Functionality
5.1 Introduction
5.2 Computerized
5.3 Global Positioning System (GPS) Navigation
5.4 Scientific
6 Global Digital Map Market, By Mapping Type
6.1 Introduction
6.2 Outdoor Mapping
6.2.1 Automotive Navigation
6.2.2 Mobile and The internet
6.2.3 Public Sector Agencies and Enterprise
6.3 Indoor Mapping
6.3.1 Airports
6.3.2 Departmental Stores
6.3.3 Malls
6.4 3D and 4D Metaverse
7 Global Digital Map Market, By Component
7.1 Introduction
7.2 Solutions
7.2.1 Mapping Data
7.2.2 Web Mapping
7.3 Services
7.3.1 Consulting
7.3.2 Cross-Platform Support
7.3.3 Deployment and Integration
8 Global Digital Map Market, By Technology
8.1 Introduction
8.2 Aerial Photography
8.3 Digital Orthophotography
8.4 Geographic Information System
8.5 Light Detection and Ranging (LiDAR)
9 Global Digital Map Market, By Deployment
9.1 Introduction
9.2 On-Premise
9.3 Cloud
10 Global Digital Map Market, By Application
10.1 Introduction
10.2 Asset Tracking
10.3 Catchment Analysis
10.4 Geocoding and Geo-positioning
10.5 Real-Time Location Data Management
10.6 Reverse Geocoding
10.7 Risk Assessment & Disaster Management
10.8 Routing and Navigation
10.9 Tracking & Telematics
11 Global Digital Map Market, By End User
11.1 Introduction
11.2 Agriculture, Oil and Gas, and Other Natural Resources
11.3 Automotive
11.3.1 Non-Autonomous
11.3.2 Semi-Autonomous
11.4 Energy & Utilities
11.5 Government and Homeland Security
11.6 Infrastructure Development and Construction
11.7 Logistics, Travel, and Transportation
11.8 Military & Defense
11.9 Mobile Devices
11.10 Telecommunication
12 Global Digital Map Market, By Geography
12.1 Introduction
12.2 North America
12.2.1 US
12.2.2 Canada
12.2.3 Mexico
12.3 Europe
12.3.1 Germany
12.3.2 UK
12.3.3 Italy
12.3.4 France
12.3.5 Spain
12.3.6 Rest of Europe
12.4 Asia Pacific
12.4.1 Japan
12.4.2 China
12.4.3 India
12.4.4 Australia
12.4.5 New Zealand
12.4.6 South Korea
12.4.7 Rest of Asia Pacific
12.5 South America
12.5.1 Argentina
12.5.2 Brazil
12.5.3 Chile
12.5.4 Rest of South America
12.6 Middle East & Africa
12.6.1 Saudi Arabia
12.6.2 UAE
12.6.3 Qatar
12.6.4 South Africa
12.6.5 Rest of Middle East & Africa
13 Key Developments
13.1 Agreements, Partnerships, Collaborations and Joint Ventures
13.2 Acquisitions & Mergers
13.3 New Product Launch
13.4 Expansions
13.5 Other Key Strategies
14 Company Profiling
14.1 Alibaba Group
14.2 Apple
14.3 ESRI
14.4 Google
14.5 HERE Technologies
14.6 Inpixon
14.7 INRIX
14.8 LightBox
14.9 MapQuest
14.10 META
14.11 Nearmap
14.12 ServiceNow
14.13 TomTom
List of Tables
1 Global Digital Map Market Outlook, By Region (2020-2028) ($MN)
2 Global Digital Map Market Outlook, By Functionality (2020-2028) ($MN)
3 Global Digital Map Market Outlook, By Computerized (2020-2028) ($MN)
4 Global Digital Map Market Outlook, By Global Positioning System (GPS) Navigation (2020-2028) ($MN)
5 Global Digital Map Market Outlook, By Scientific (2020-2028) ($MN)
6 Global Digital Map Market Outlook, By Mapping Type (2020-2028) ($MN)
7 Global Digital Map Market Outlook, By Outdoor Mapping (2020-2028) ($MN)
8 Global Digital Map Market Outlook, By Automotive Navigation (2020-2028) ($MN)
9 Global Digital Map Market Outlook, By Mobile and The internet (2020-2028) ($MN)
10 Global Digital Map Market Outlook, By Public Sector Agencies and Enterprise (2020-2028) ($MN)
11 Global Digital Map Market Outlook, By Indoor Mapping (2020-2028) ($MN)
12 Global Digital Map Market Outlook, By Airports (2020-2028) ($MN)
13 Global Digital Map Market Outlook, By Departmental Stores (2020-2028) ($MN)
14 Global Digital Map Market Outlook, By Malls (2020-2028) ($MN)
15 Global Digital Map Market Outlook, By 3D and 4D Metaverse (2020-2028) ($MN)
16 Global Digital Map Market Outlook, By Component (2020-2028) ($MN)
17 Global Digital Map Market Outlook, By Solutions (2020-2028) ($MN)
18 Global Digital Map Market Outlook, By Mapping Data (2020-2028) ($MN)
19 Global Digital Map Market Outlook, By Web Mapping (2020-2028) ($MN)
20 Global Digital Map Market Outlook, By Services (2020-2028) ($MN)
21 Global Digital Map Market Outlook, By Consulting (2020-2028) ($MN)
22 Global Digital Map Market Outlook, By Cross-Platform Support (2020-2028) ($MN)
23 Global Digital Map Market Outlook, By Deployment and Integration (2020-2028) ($MN)
24 Global Digital Map Market Outlook, By Technology (2020-2028) ($MN)
25 Global Digital Map Market Outlook, By Aerial Photography (2020-2028) ($MN)
26 Global Digital Map Market Outlook, By Digital Orthophotography (2020-2028) ($MN)
27 Global Digital Map Market Outlook, By Geographic Information System (2020-2028) ($MN)
28 Global Digital Map Market Outlook, By Light Detection and Ranging (LiDAR) (2020-2028) ($MN)
29 Global Digital Map Market Outlook, By Deployment (2020-2028) ($MN)
30 Global Digital Map Market Outlook, By On-Premise (2020-2028) ($MN)
31 Global Digital Map Market Outlook, By Cloud (2020-2028) ($MN)
32 Global Digital Map Market Outlook, By Application (2020-2028) ($MN)
33 Global Digital Map Market Outlook, By Asset Tracking (2020-2028) ($MN)
34 Global Digital Map Market Outlook, By Catchment Analysis (2020-2028) ($MN)
35 Global Digital Map Market Outlook, By Geocoding and Geo-positioning (2020-2028) ($MN)
36 Global Digital Map Market Outlook, By Real-Time Location Data Management (2020-2028) ($MN)
37 Global Digital Map Market Outlook, By Reverse Geocoding (2020-2028) ($MN)
38 Global Digital Map Market Outlook, By Risk Assessment & Disaster Management (2020-2028) ($MN)
39 Global Digital Map Market Outlook, By Routing and Navigation (2020-2028) ($MN)
40 Global Digital Map Market Outlook, By Tracking & Telematics (2020-2028) ($MN)
41 Global Digital Map Market Outlook, By End User (2020-2028) ($MN)
42 Global Digital Map Market Outlook, By Agriculture, Oil and Gas, and Other Natural Resources (2020-2028) ($MN)
43 Global Digital Map Market Outlook, By Automotive (2020-2028) ($MN)
44 Global Digital Map Market Outlook, By Non-Autonomous (2020-2028) ($MN)
45 Global Digital Map Market Outlook, By Semi-Autonomous (2020-2028) ($MN)
46 Global Digital Map Market Outlook, By Energy & Utilities (2020-2028) ($MN)
47 Global Digital Map Market Outlook, By Government and Homeland Security (2020-2028) ($MN)
48 Global Digital Map Market Outlook, By Infrastructure Development and Construction (2020-2028) ($MN)
49 Global Digital Map Market Outlook, By Logistics, Travel, and Transportation (2020-2028) ($MN)
50 Global Digital Map Market Outlook, By Military & Defense (2020-2028) ($MN)
51 Global Digital Map Market Outlook, By Mobile Devices (2020-2028) ($MN)
52 Global Digital Map Market Outlook, By Telecommunication (2020-2028) ($MN)
Note: Tables for North America, Europe, APAC, South America, and Middle East & Africa Regions are also represented in the same manner as above.
List of Figures
RESEARCH METHODOLOGY

We at ‘Stratistics’ opt for an extensive research approach which involves data mining, data validation, and data analysis. The various research sources include in-house repository, secondary research, competitor’s sources, social media research, client internal data, and primary research.
Our team of analysts prefers the most reliable and authenticated data sources in order to perform the comprehensive literature search. With access to most of the authenticated data bases our team highly considers the best mix of information through various sources to obtain extensive and accurate analysis.
Each report takes an average time of a month and a team of 4 industry analysts. The time may vary depending on the scope and data availability of the desired market report. The various parameters used in the market assessment are standardized in order to enhance the data accuracy.
Data Mining
The data is collected from several authenticated, reliable, paid and unpaid sources and is filtered depending on the scope & objective of the research. Our reports repository acts as an added advantage in this procedure. Data gathering from the raw material suppliers, distributors and the manufacturers is performed on a regular basis, this helps in the comprehensive understanding of the products value chain. Apart from the above mentioned sources the data is also collected from the industry consultants to ensure the objective of the study is in the right direction.
Market trends such as technological advancements, regulatory affairs, market dynamics (Drivers, Restraints, Opportunities and Challenges) are obtained from scientific journals, market related national & international associations and organizations.
Data Analysis
From the data that is collected depending on the scope & objective of the research the data is subjected for the analysis. The critical steps that we follow for the data analysis include:
- Product Lifecycle Analysis
- Competitor analysis
- Risk analysis
- Porters Analysis
- PESTEL Analysis
- SWOT Analysis
The data engineering is performed by the core industry experts considering both the Marketing Mix Modeling and the Demand Forecasting. The marketing mix modeling makes use of multiple-regression techniques to predict the optimal mix of marketing variables. Regression factor is based on a number of variables and how they relate to an outcome such as sales or profits.
Data Validation
The data validation is performed by the exhaustive primary research from the expert interviews. This includes telephonic interviews, focus groups, face to face interviews, and questionnaires to validate our research from all aspects. The industry experts we approach come from the leading firms, involved in the supply chain ranging from the suppliers, distributors to the manufacturers and consumers so as to ensure an unbiased analysis.
We are in touch with more than 15,000 industry experts with the right mix of consultants, CEO's, presidents, vice presidents, managers, experts from both supply side and demand side, executives and so on.
The data validation involves the primary research from the industry experts belonging to:
- Leading Companies
- Suppliers & Distributors
- Manufacturers
- Consumers
- Industry/Strategic Consultants
Apart from the data validation the primary research also helps in performing the fill gap research, i.e. providing solutions for the unmet needs of the research which helps in enhancing the reports quality.
For more details about research methodology, kindly write to us at info@strategymrc.com
Frequently Asked Questions
In case of any queries regarding this report, you can contact the customer service by filing the “Inquiry Before Buy” form available on the right hand side. You may also contact us through email: info@strategymrc.com or phone: +1-301-202-5929
Yes, the samples are available for all the published reports. You can request them by filling the “Request Sample” option available in this page.
Yes, you can request a sample with your specific requirements. All the customized samples will be provided as per the requirement with the real data masked.
All our reports are available in Digital PDF format. In case if you require them in any other formats, such as PPT, Excel etc you can submit a request through “Inquiry Before Buy” form available on the right hand side. You may also contact us through email: info@strategymrc.com or phone: +1-301-202-5929
We offer a free 15% customization with every purchase. This requirement can be fulfilled for both pre and post sale. You may send your customization requirements through email at info@strategymrc.com or call us on +1-301-202-5929.
We have 3 different licensing options available in electronic format.
- Single User Licence: Allows one person, typically the buyer, to have access to the ordered product. The ordered product cannot be distributed to anyone else.
- 2-5 User Licence: Allows the ordered product to be shared among a maximum of 5 people within your organisation.
- Corporate License: Allows the product to be shared among all employees of your organisation regardless of their geographical location.
All our reports are typically be emailed to you as an attachment.
To order any available report you need to register on our website. The payment can be made either through CCAvenue or PayPal payments gateways which accept all international cards.
We extend our support to 6 months post sale. A post sale customization is also provided to cover your unmet needs in the report.
Request Customization
We offer complimentary customization of up to 15% with every purchase. To share your customization requirements, feel free to email us at info@strategymrc.com or call us on +1-301-202-5929. .
Please Note: Customization within the 15% threshold is entirely free of charge. If your request exceeds this limit, we will conduct a feasibility assessment. Following that, a detailed quote and timeline will be provided.
WHY CHOOSE US ?

Assured Quality
Best in class reports with high standard of research integrity

24X7 Research Support
Continuous support to ensure the best customer experience.

Free Customization
Adding more values to your product of interest.

Safe & Secure Access
Providing a secured environment for all online transactions.

Trusted by 600+ Brands
Serving the most reputed brands across the world.