
Optical Wavelength Services Market
Optical Wavelength Services Market Forecasts to 2028 - Global Analysis By Bandwidth (Less than 10Gbps, 40 Gbps, 100 Gbps and More Than 100 Gbps), Fiber Channel Interface (Ethernet, Sonet and OTN), Organization Size (Small Sized Enterprises, Medium Sized Enterprises and Large Enterprises) and By Geography

|
Years Covered |
2020-2028 |
|
Estimated Year Value (2022) |
US $4.91 BN |
|
Projected Year Value (2028) |
US $8.95 BN |
|
CAGR (2022 - 2028) |
10.5% |
|
Regions Covered |
North America, Europe, Asia Pacific, South America, and Middle East & Africa |
|
Countries Covered |
US, Canada, Mexico, Germany, UK, Italy, France, Spain, Japan, China, India, Australia, New Zealand, South Korea, Rest of Asia Pacific, South America, Argentina, Brazil, Chile, Middle East & Africa, Saudi Arabia, UAE, Qatar, and South Africa |
|
Largest Market |
Asia Pacific |
|
Highest Growing Market |
Europe |
According to Stratistics MRC, the Global Optical Wavelength Services Market is accounted for $4.91 billion in 2022 and is expected to reach $8.95 billion by 2028 growing at a CAGR of 10.5% during the forecast period. Optical wavelength service is a point-to-point delivery service with a high bandwidth based on fibre optics. The optical wavelength services are high-speed internet and data services that are widely used and requested by the telecommunications industry. Data centre interconnection, high resolution, video streaming, credit card processing, and other financial applications can all benefit from optical wavelength services.
According to Cisco Systems Inc., on average, a smartphone is expected to generate 11 GB data traffic per month by 2022, which may be more than a four and a half-fold jump over the 2017 average of 2 GB data per month. The increase in mobile traffic is anticipated to create an extensive opportunity for the optical transport network market.
Market Dynamics:
Driver:
Rising Demand for Internet
Increasing internet demand is projected to drive the expansion of the optical communication and networking industry in the future. The demand for the internet is increasing as a result of increased digital media and a shift towards working from home situations. Optical communications and networking technologies are becoming increasingly significant in integrating a wide range of IT resources across globally distributed autonomous network systems to enable cost-effective information transmission and processing.
Restraint:
Increase in the adoption of virtual connectivity
Many virtual network products that perform the functions of traditional network equipment such as switches, routers, and firewalls have lately been available. Cisco Systems and Verizon have worked together to provide a flexible networking infrastructure. Businesses throughout the world are focusing on developing a digitally ready infrastructure at the edge in order to accelerate attempts at digital transformation which has been hampering the optical wavelength services market.
Opportunity:
Growing applications with high bandwidth
Because of the rise in bandwidth-intensive applications such as video and web conferencing, cloud storage, audio, video streaming, gaming, and others, the need for optical wavelength services with more capacity has increased. Furthermore, as video and online conferencing have grown in popularity, so has the demand for optical wavelength services. Microsoft Teams Zoom, Skype, and Google Meet, for example, may require more bandwidth to perform properly. Good Meet, for example, requires up to 4 Mbps for HD video conversations with groups. Owing to the prevalence of remote and hybrid work and learning during the epidemic, such applications have been widely used to assist people and organisations in remaining durable.
Threat:
Less incremental bandwidth options
An incremental backup operation copies only the data that has changed since the previous backup operation of any kind. An organisation normally compares the changed time stamp on files to the time stamp of the most recent backup. Backup software monitor and record the date and time of backup activities in order to track files that have been updated since these actions, in general, differential backups take longer to complete than incremental backups. When it comes to retrieving backup files, however, the tides change: differential restores are faster than incremental restorations because they require fewer data pieces to complete the recovery process.
Covid-19 Impact
The demand for optical wavelength services increased significantly in reaction to the COVID-19 epidemic, which posed a significant burden to the global economy and several enterprises worldwide. This can be linked to the growing acceptability of work-from-home models, as well as greater efforts by corporations to provide improved signal quality and services during the outbreak.
The 100 Gbps segment is expected to be the largest during the forecast period
The 100 Gbps segment is estimated to have a lucrative growth; due to the optical wavelength of 100 Gbps provides a considerable speed advantage. Faster data transfer speeds provide for faster file access within the company network. The standard is most useful in data centre networks and server rooms. Backward compatibility exists for 100 Gbps items such as switches and other networking equipment. By installing new transceivers or modules, existing cabling can be reused. This convergence of cabling simplifies deployment, decreases power and space needs, and keeps costs down. The 100 Gbps standards is suited for switch-to-switch communication across long distances thus enhancing the market.
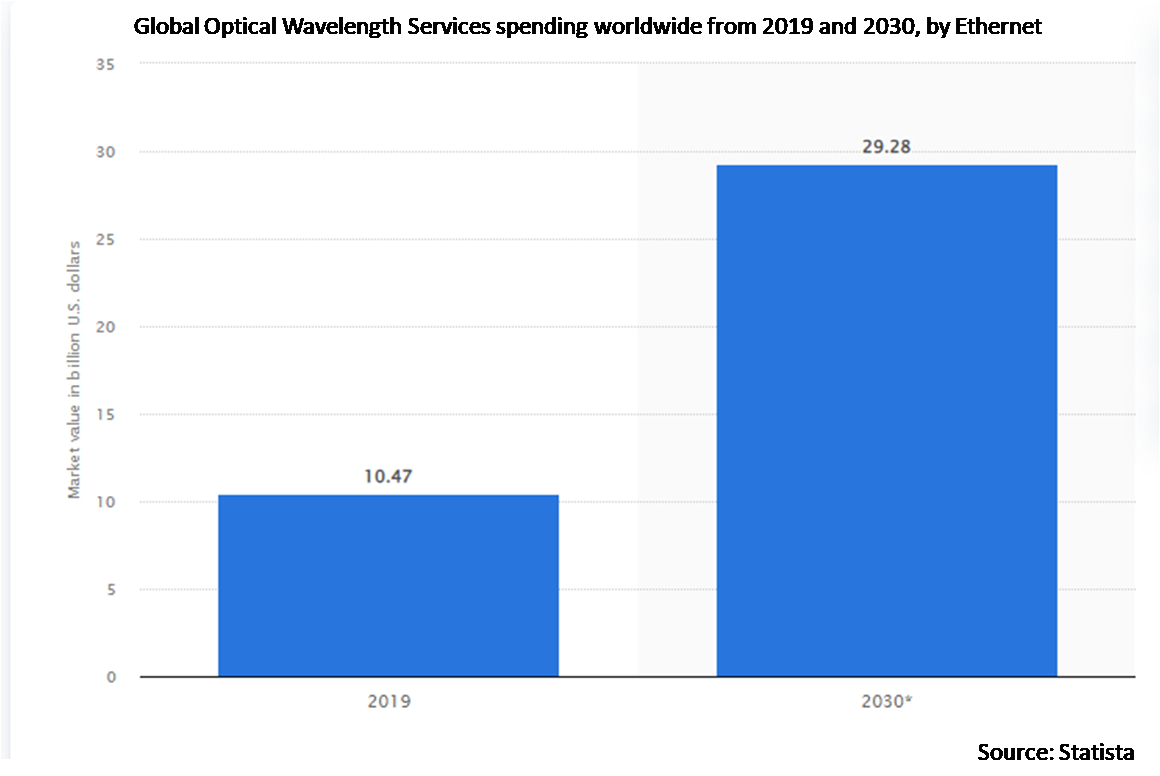
The Ethernet segment is expected to have the highest CAGR during the forecast period
The Ethernet segment is anticipated to witness the fastest CAGR growth during the forecast period, due to technology that uses the common network language protocol to connect wired local area networks (LANs). Fiber Optics Ethernet employs optical fibres with tremendous bandwidth and the ability to travel long distances. Carriers Ethernet facilities and enterprise networks can be quickly and readily connected using the External Network to Network Interface (ENNI) standard. This enables speedier deployment and better visibility across virtualized network connections. Ethernet Private Line (EPL), Ethernet Virtual Private Line (EVPL), and Ethernet Local Area Network (ELAN) are services that enable high-speed data transmission between many sites which further drives the market.
Region with largest share:
Asia Pacific is projected to hold the largest market share during the forecast period owing to rapidly upgrading communication technology infrastructure. Numerous IT enterprises in the area, as well as increased need for end-to-end wavelength services, are propelling the growth of this sector. The rising LAN and WAN connectivity, high utilisation in financial data transfer, and offset backup data all contribute to the area's growth over the anticipated time. Many governments in developing nations are taking steps to stimulate the development of communication infrastructure in their individual countries, which is fueling the expansion of the optical wavelength service market.
Region with highest CAGR:
Europe is projected to have the highest CAGR over the forecast period, owing to the increased need for and use of high-speed networking and communication in the industrial sector. The strong presence of some well-known sector actors, together with the growing need for financial data transfer services, will promote regional growth. This is because developing economies are rapidly upgrading their communication technologies. The presence of a significant number of IT enterprises is also boosting market expansion in this region.

Key players in the market
Some of the key players profiled in the Optical Wavelength Services Market include Zayo Group Holdings, Inc, Nokia Corporation, AT&T Inc, Lumen Technologies Inc., Verizon Communications Inc., T-Mobile US Inc., Charter Communications, Comcast Corporation, Crown Castle Inc., Colt Technology Services Group Limited, Windstream Holdings, Inc., CarrierBid Communications, Jaguar Network SAS, Cox Communications, CarrierBid Communications, CenturyLink and Sprint
Key Developments:
In March 2023, Nokia partners with Netplus to deliver future-proof and world-class broadband services in India; Netplus has operations spread across 400 plus cities and towns in several states in Northern India, with the biggest in Punjab.
In Feb 2023, Nokia launches anyRAN to drive CloudRAN partnerships enabling flexibility for mobile network operators and enterprises #MWC23 Nokia anyRAN is designed to help mobile operators and enterprises extend their options for building and evolving their radio access networks.
In Oct 2022, Zayo Group Holdings, Inc., announced the expansion of its infrastructure and Tier 1 IP network into the key border cities of McAllen and Laredo, Texas with two new 100G IP points of presence (PoPs) and 400G Wavelengths capabilities.
In Aug 2022, Zayo Launches API Developer Portal to Accelerate Enterprise Digital Transformation providing customers with a single online platform to explore, on-board and test live environments with existing API offerings, and stay informed about upcoming developments.
Bandwidths Covered:
• Less than 10 Gbps
• 40 Gbps
• 100 Gbps
• More Than 100 Gbps
Fiber Channel Interfaces Covered:
• Ethernet
• Sonet
• Optical Transport Network (OTN)
Organization Sizes Covered:
• Small Sized Enterprises
• Medium Sized Enterprises
• Large Enterprises
Applications Covered:
• Short Haul
• Long Haul
• Metro
Regions Covered:
• North America
o US
o Canada
o Mexico
• Europe
o Germany
o UK
o Italy
o France
o Spain
o Rest of Europe
• Asia Pacific
o Japan
o China
o India
o Australia
o New Zealand
o South Korea
o Rest of Asia Pacific
• South America
o Argentina
o Brazil
o Chile
o Rest of South America
• Middle East & Africa
o Saudi Arabia
o UAE
o Qatar
o South Africa
o Rest of Middle East & Africa
What our report offers:
- Market share assessments for the regional and country-level segments
- Strategic recommendations for the new entrants
- Covers Market data for the years 2020, 2021, 2022, 2025, and 2028
- Market Trends (Drivers, Constraints, Opportunities, Threats, Challenges, Investment Opportunities, and recommendations)
- Strategic recommendations in key business segments based on the market estimations
- Competitive landscaping mapping the key common trends
- Company profiling with detailed strategies, financials, and recent developments
- Supply chain trends mapping the latest technological advancements
Free Customization Offerings:
All the customers of this report will be entitled to receive one of the following free customization options:
• Company Profiling
o Comprehensive profiling of additional market players (up to 3)
o SWOT Analysis of key players (up to 3)
• Regional Segmentation
o Market estimations, Forecasts and CAGR of any prominent country as per the client's interest (Note: Depends on feasibility check)
• Competitive Benchmarking
o Benchmarking of key players based on product portfolio, geographical presence, and strategic alliances
Table of Contents
1 Executive Summary
2 Preface
2.1 Abstract
2.2 Stake Holders
2.3 Research Scope
2.4 Research Methodology
2.4.1 Data Mining
2.4.2 Data Analysis
2.4.3 Data Validation
2.4.4 Research Approach
2.5 Research Sources
2.5.1 Primary Research Sources
2.5.2 Secondary Research Sources
2.5.3 Assumptions
3 Market Trend Analysis
3.1 Introduction
3.2 Drivers
3.3 Restraints
3.4 Opportunities
3.5 Threats
3.6 Application Analysis
3.7 Emerging Markets
3.8 Impact of Covid-19
4 Porters Five Force Analysis
4.1 Bargaining power of suppliers
4.2 Bargaining power of buyers
4.3 Threat of substitutes
4.4 Threat of new entrants
4.5 Competitive rivalry
5 Global Optical Wavelength Services Market, By Bandwidth
5.1 Introduction
5.2 Less than 10 Gbps
5.3 40 Gbps
5.4 100 Gbps
5.5 More Than 100 Gbps
6 Global Optical Wavelength Services Market, By Fiber Channel Interface
6.1 Introduction
6.2 Ethernet
6.3 Sonet
6.4 Optical Transport Network (OTN)
7 Global Optical Wavelength Services Market, By Organization Size
7.1 Introduction
7.2 Small Sized Enterprises
7.3 Medium Sized Enterprises
7.4 Large Enterprises
8 Global Optical Wavelength Services Market, By Application
8.1 Introduction
8.2 Short Haul
8.3 Long Haul
8.4 Metro
9 Global Optical Wavelength Services Market, By Geography
9.1 Introduction
9.2 North America
9.2.1 US
9.2.2 Canada
9.2.3 Mexico
9.3 Europe
9.3.1 Germany
9.3.2 UK
9.3.3 Italy
9.3.4 France
9.3.5 Spain
9.3.6 Rest of Europe
9.4 Asia Pacific
9.4.1 Japan
9.4.2 China
9.4.3 India
9.4.4 Australia
9.4.5 New Zealand
9.4.6 South Korea
9.4.7 Rest of Asia Pacific
9.5 South America
9.5.1 Argentina
9.5.2 Brazil
9.5.3 Chile
9.5.4 Rest of South America
9.6 Middle East & Africa
9.6.1 Saudi Arabia
9.6.2 UAE
9.6.3 Qatar
9.6.4 South Africa
9.6.5 Rest of Middle East & Africa
10 Key Developments
10.1 Agreements, Partnerships, Collaborations and Joint Ventures
10.2 Acquisitions & Mergers
10.3 New Product Launch
10.4 Expansions
10.5 Other Key Strategies
11 Company Profiling
11.1 Zayo Group Holdings, Inc.
11.2 Nokia Corporation
11.3 AT&T Inc.
11.4 Lumen Technologies Inc.
11.5 Verizon Communications Inc.
11.6 T-Mobile US Inc.
11.7 Charter Communications
11.8 Comcast Corporation
11.9 Crown Castle Inc.
11.10 Colt Technology Services Group Limited
11.11 Windstream Holdings, Inc.
11.12 CarrierBid Communications
11.13 Jaguar Network SAS
11.14 Cox Communications
11.15 CarrierBid Communications
11.16 CenturyLink
11.17 Sprint
List of Tables
1 Global Optical Wavelength Services Market Outlook, By Region (2020-2028) ($MN)
2 Global Optical Wavelength Services Market Outlook, By Bandwidth (2020-2028) ($MN)
3 Global Optical Wavelength Services Market Outlook, By Less than 10 Gbps (2020-2028) ($MN)
4 Global Optical Wavelength Services Market Outlook, By 40 Gbps (2020-2028) ($MN)
5 Global Optical Wavelength Services Market Outlook, By 100 Gbps (2020-2028) ($MN)
6 Global Optical Wavelength Services Market Outlook, By More Than 100 Gbps (2020-2028) ($MN)
7 Global Optical Wavelength Services Market Outlook, By Fiber Channel Interface (2020-2028) ($MN)
8 Global Optical Wavelength Services Market Outlook, By Ethernet (2020-2028) ($MN)
9 Global Optical Wavelength Services Market Outlook, By Sonet (2020-2028) ($MN)
10 Global Optical Wavelength Services Market Outlook, By Optical Transport Network (OTN) (2020-2028) ($MN)
11 Global Optical Wavelength Services Market Outlook, By Organization Size (2020-2028) ($MN)
12 Global Optical Wavelength Services Market Outlook, By Small Sized Enterprises (2020-2028) ($MN)
13 Global Optical Wavelength Services Market Outlook, By Medium Sized Enterprises (2020-2028) ($MN)
14 Global Optical Wavelength Services Market Outlook, By Large Enterprises (2020-2028) ($MN)
15 Global Optical Wavelength Services Market Outlook, By Application (2020-2028) ($MN)
16 Global Optical Wavelength Services Market Outlook, By Short Haul (2020-2028) ($MN)
17 Global Optical Wavelength Services Market Outlook, By Long Haul (2020-2028) ($MN)
18 Global Optical Wavelength Services Market Outlook, By Metro (2020-2028) ($MN)
19 North America Optical Wavelength Services Market Outlook, By Country (2020-2028) ($MN)
20 North America Optical Wavelength Services Market Outlook, By Bandwidth (2020-2028) ($MN)
21 North America Optical Wavelength Services Market Outlook, By Less than 10 Gbps (2020-2028) ($MN)
22 North America Optical Wavelength Services Market Outlook, By 40 Gbps (2020-2028) ($MN)
23 North America Optical Wavelength Services Market Outlook, By 100 Gbps (2020-2028) ($MN)
24 North America Optical Wavelength Services Market Outlook, By More Than 100 Gbps (2020-2028) ($MN)
25 North America Optical Wavelength Services Market Outlook, By Fiber Channel Interface (2020-2028) ($MN)
26 North America Optical Wavelength Services Market Outlook, By Ethernet (2020-2028) ($MN)
27 North America Optical Wavelength Services Market Outlook, By Sonet (2020-2028) ($MN)
28 North America Optical Wavelength Services Market Outlook, By Optical Transport Network (OTN) (2020-2028) ($MN)
29 North America Optical Wavelength Services Market Outlook, By Organization Size (2020-2028) ($MN)
30 North America Optical Wavelength Services Market Outlook, By Small Sized Enterprises (2020-2028) ($MN)
31 North America Optical Wavelength Services Market Outlook, By Medium Sized Enterprises (2020-2028) ($MN)
32 North America Optical Wavelength Services Market Outlook, By Large Enterprises (2020-2028) ($MN)
33 North America Optical Wavelength Services Market Outlook, By Application (2020-2028) ($MN)
34 North America Optical Wavelength Services Market Outlook, By Short Haul (2020-2028) ($MN)
35 North America Optical Wavelength Services Market Outlook, By Long Haul (2020-2028) ($MN)
36 North America Optical Wavelength Services Market Outlook, By Metro (2020-2028) ($MN)
37 Europe Optical Wavelength Services Market Outlook, By Country (2020-2028) ($MN)
38 Europe Optical Wavelength Services Market Outlook, By Bandwidth (2020-2028) ($MN)
39 Europe Optical Wavelength Services Market Outlook, By Less than 10 Gbps (2020-2028) ($MN)
40 Europe Optical Wavelength Services Market Outlook, By 40 Gbps (2020-2028) ($MN)
41 Europe Optical Wavelength Services Market Outlook, By 100 Gbps (2020-2028) ($MN)
42 Europe Optical Wavelength Services Market Outlook, By More Than 100 Gbps (2020-2028) ($MN)
43 Europe Optical Wavelength Services Market Outlook, By Fiber Channel Interface (2020-2028) ($MN)
44 Europe Optical Wavelength Services Market Outlook, By Ethernet (2020-2028) ($MN)
45 Europe Optical Wavelength Services Market Outlook, By Sonet (2020-2028) ($MN)
46 Europe Optical Wavelength Services Market Outlook, By Optical Transport Network (OTN) (2020-2028) ($MN)
47 Europe Optical Wavelength Services Market Outlook, By Organization Size (2020-2028) ($MN)
48 Europe Optical Wavelength Services Market Outlook, By Small Sized Enterprises (2020-2028) ($MN)
49 Europe Optical Wavelength Services Market Outlook, By Medium Sized Enterprises (2020-2028) ($MN)
50 Europe Optical Wavelength Services Market Outlook, By Large Enterprises (2020-2028) ($MN)
51 Europe Optical Wavelength Services Market Outlook, By Application (2020-2028) ($MN)
52 Europe Optical Wavelength Services Market Outlook, By Short Haul (2020-2028) ($MN)
53 Europe Optical Wavelength Services Market Outlook, By Long Haul (2020-2028) ($MN)
54 Europe Optical Wavelength Services Market Outlook, By Metro (2020-2028) ($MN)
55 Asia Pacific Optical Wavelength Services Market Outlook, By Country (2020-2028) ($MN)
56 Asia Pacific Optical Wavelength Services Market Outlook, By Bandwidth (2020-2028) ($MN)
57 Asia Pacific Optical Wavelength Services Market Outlook, By Less than 10 Gbps (2020-2028) ($MN)
58 Asia Pacific Optical Wavelength Services Market Outlook, By 40 Gbps (2020-2028) ($MN)
59 Asia Pacific Optical Wavelength Services Market Outlook, By 100 Gbps (2020-2028) ($MN)
60 Asia Pacific Optical Wavelength Services Market Outlook, By More Than 100 Gbps (2020-2028) ($MN)
61 Asia Pacific Optical Wavelength Services Market Outlook, By Fiber Channel Interface (2020-2028) ($MN)
62 Asia Pacific Optical Wavelength Services Market Outlook, By Ethernet (2020-2028) ($MN)
63 Asia Pacific Optical Wavelength Services Market Outlook, By Sonet (2020-2028) ($MN)
64 Asia Pacific Optical Wavelength Services Market Outlook, By Optical Transport Network (OTN) (2020-2028) ($MN)
65 Asia Pacific Optical Wavelength Services Market Outlook, By Organization Size (2020-2028) ($MN)
66 Asia Pacific Optical Wavelength Services Market Outlook, By Small Sized Enterprises (2020-2028) ($MN)
67 Asia Pacific Optical Wavelength Services Market Outlook, By Medium Sized Enterprises (2020-2028) ($MN)
68 Asia Pacific Optical Wavelength Services Market Outlook, By Large Enterprises (2020-2028) ($MN)
69 Asia Pacific Optical Wavelength Services Market Outlook, By Application (2020-2028) ($MN)
70 Asia Pacific Optical Wavelength Services Market Outlook, By Short Haul (2020-2028) ($MN)
71 Asia Pacific Optical Wavelength Services Market Outlook, By Long Haul (2020-2028) ($MN)
72 Asia Pacific Optical Wavelength Services Market Outlook, By Metro (2020-2028) ($MN)
73 South America Optical Wavelength Services Market Outlook, By Country (2020-2028) ($MN)
74 South America Optical Wavelength Services Market Outlook, By Bandwidth (2020-2028) ($MN)
75 South America Optical Wavelength Services Market Outlook, By Less than 10 Gbps (2020-2028) ($MN)
76 South America Optical Wavelength Services Market Outlook, By 40 Gbps (2020-2028) ($MN)
77 South America Optical Wavelength Services Market Outlook, By 100 Gbps (2020-2028) ($MN)
78 South America Optical Wavelength Services Market Outlook, By More Than 100 Gbps (2020-2028) ($MN)
79 South America Optical Wavelength Services Market Outlook, By Fiber Channel Interface (2020-2028) ($MN)
80 South America Optical Wavelength Services Market Outlook, By Ethernet (2020-2028) ($MN)
81 South America Optical Wavelength Services Market Outlook, By Sonet (2020-2028) ($MN)
82 South America Optical Wavelength Services Market Outlook, By Optical Transport Network (OTN) (2020-2028) ($MN)
83 South America Optical Wavelength Services Market Outlook, By Organization Size (2020-2028) ($MN)
84 South America Optical Wavelength Services Market Outlook, By Small Sized Enterprises (2020-2028) ($MN)
85 South America Optical Wavelength Services Market Outlook, By Medium Sized Enterprises (2020-2028) ($MN)
86 South America Optical Wavelength Services Market Outlook, By Large Enterprises (2020-2028) ($MN)
87 South America Optical Wavelength Services Market Outlook, By Application (2020-2028) ($MN)
88 South America Optical Wavelength Services Market Outlook, By Short Haul (2020-2028) ($MN)
89 South America Optical Wavelength Services Market Outlook, By Long Haul (2020-2028) ($MN)
90 South America Optical Wavelength Services Market Outlook, By Metro (2020-2028) ($MN)
91 Middle East & Africa Optical Wavelength Services Market Outlook, By Country (2020-2028) ($MN)
92 Middle East & Africa Optical Wavelength Services Market Outlook, By Bandwidth (2020-2028) ($MN)
93 Middle East & Africa Optical Wavelength Services Market Outlook, By Less than 10 Gbps (2020-2028) ($MN)
94 Middle East & Africa Optical Wavelength Services Market Outlook, By 40 Gbps (2020-2028) ($MN)
95 Middle East & Africa Optical Wavelength Services Market Outlook, By 100 Gbps (2020-2028) ($MN)
96 Middle East & Africa Optical Wavelength Services Market Outlook, By More Than 100 Gbps (2020-2028) ($MN)
97 Middle East & Africa Optical Wavelength Services Market Outlook, By Fiber Channel Interface (2020-2028) ($MN)
98 Middle East & Africa Optical Wavelength Services Market Outlook, By Ethernet (2020-2028) ($MN)
99 Middle East & Africa Optical Wavelength Services Market Outlook, By Sonet (2020-2028) ($MN)
100 Middle East & Africa Optical Wavelength Services Market Outlook, By Optical Transport Network (OTN) (2020-2028) ($MN)
101 Middle East & Africa Optical Wavelength Services Market Outlook, By Organization Size (2020-2028) ($MN)
102 Middle East & Africa Optical Wavelength Services Market Outlook, By Small Sized Enterprises (2020-2028) ($MN)
103 Middle East & Africa Optical Wavelength Services Market Outlook, By Medium Sized Enterprises (2020-2028) ($MN)
104 Middle East & Africa Optical Wavelength Services Market Outlook, By Large Enterprises (2020-2028) ($MN)
105 Middle East & Africa Optical Wavelength Services Market Outlook, By Application (2020-2028) ($MN)
106 Middle East & Africa Optical Wavelength Services Market Outlook, By Short Haul (2020-2028) ($MN)
107 Middle East & Africa Optical Wavelength Services Market Outlook, By Long Haul (2020-2028) ($MN)
108 Middle East & Africa Optical Wavelength Services Market Outlook, By Metro (2020-2028) ($MN)
List of Figures
RESEARCH METHODOLOGY

We at ‘Stratistics’ opt for an extensive research approach which involves data mining, data validation, and data analysis. The various research sources include in-house repository, secondary research, competitor’s sources, social media research, client internal data, and primary research.
Our team of analysts prefers the most reliable and authenticated data sources in order to perform the comprehensive literature search. With access to most of the authenticated data bases our team highly considers the best mix of information through various sources to obtain extensive and accurate analysis.
Each report takes an average time of a month and a team of 4 industry analysts. The time may vary depending on the scope and data availability of the desired market report. The various parameters used in the market assessment are standardized in order to enhance the data accuracy.
Data Mining
The data is collected from several authenticated, reliable, paid and unpaid sources and is filtered depending on the scope & objective of the research. Our reports repository acts as an added advantage in this procedure. Data gathering from the raw material suppliers, distributors and the manufacturers is performed on a regular basis, this helps in the comprehensive understanding of the products value chain. Apart from the above mentioned sources the data is also collected from the industry consultants to ensure the objective of the study is in the right direction.
Market trends such as technological advancements, regulatory affairs, market dynamics (Drivers, Restraints, Opportunities and Challenges) are obtained from scientific journals, market related national & international associations and organizations.
Data Analysis
From the data that is collected depending on the scope & objective of the research the data is subjected for the analysis. The critical steps that we follow for the data analysis include:
- Product Lifecycle Analysis
- Competitor analysis
- Risk analysis
- Porters Analysis
- PESTEL Analysis
- SWOT Analysis
The data engineering is performed by the core industry experts considering both the Marketing Mix Modeling and the Demand Forecasting. The marketing mix modeling makes use of multiple-regression techniques to predict the optimal mix of marketing variables. Regression factor is based on a number of variables and how they relate to an outcome such as sales or profits.
Data Validation
The data validation is performed by the exhaustive primary research from the expert interviews. This includes telephonic interviews, focus groups, face to face interviews, and questionnaires to validate our research from all aspects. The industry experts we approach come from the leading firms, involved in the supply chain ranging from the suppliers, distributors to the manufacturers and consumers so as to ensure an unbiased analysis.
We are in touch with more than 15,000 industry experts with the right mix of consultants, CEO's, presidents, vice presidents, managers, experts from both supply side and demand side, executives and so on.
The data validation involves the primary research from the industry experts belonging to:
- Leading Companies
- Suppliers & Distributors
- Manufacturers
- Consumers
- Industry/Strategic Consultants
Apart from the data validation the primary research also helps in performing the fill gap research, i.e. providing solutions for the unmet needs of the research which helps in enhancing the reports quality.
For more details about research methodology, kindly write to us at info@strategymrc.com
Frequently Asked Questions
In case of any queries regarding this report, you can contact the customer service by filing the “Inquiry Before Buy” form available on the right hand side. You may also contact us through email: info@strategymrc.com or phone: +1-301-202-5929
Yes, the samples are available for all the published reports. You can request them by filling the “Request Sample” option available in this page.
Yes, you can request a sample with your specific requirements. All the customized samples will be provided as per the requirement with the real data masked.
All our reports are available in Digital PDF format. In case if you require them in any other formats, such as PPT, Excel etc you can submit a request through “Inquiry Before Buy” form available on the right hand side. You may also contact us through email: info@strategymrc.com or phone: +1-301-202-5929
We offer a free 15% customization with every purchase. This requirement can be fulfilled for both pre and post sale. You may send your customization requirements through email at info@strategymrc.com or call us on +1-301-202-5929.
We have 3 different licensing options available in electronic format.
- Single User Licence: Allows one person, typically the buyer, to have access to the ordered product. The ordered product cannot be distributed to anyone else.
- 2-5 User Licence: Allows the ordered product to be shared among a maximum of 5 people within your organisation.
- Corporate License: Allows the product to be shared among all employees of your organisation regardless of their geographical location.
All our reports are typically be emailed to you as an attachment.
To order any available report you need to register on our website. The payment can be made either through CCAvenue or PayPal payments gateways which accept all international cards.
We extend our support to 6 months post sale. A post sale customization is also provided to cover your unmet needs in the report.
Request Customization
We offer complimentary customization of up to 15% with every purchase. To share your customization requirements, feel free to email us at info@strategymrc.com or call us on +1-301-202-5929. .
Please Note: Customization within the 15% threshold is entirely free of charge. If your request exceeds this limit, we will conduct a feasibility assessment. Following that, a detailed quote and timeline will be provided.
WHY CHOOSE US ?

Assured Quality
Best in class reports with high standard of research integrity

24X7 Research Support
Continuous support to ensure the best customer experience.

Free Customization
Adding more values to your product of interest.

Safe & Secure Access
Providing a secured environment for all online transactions.

Trusted by 600+ Brands
Serving the most reputed brands across the world.