
Power Grid System Market
Power Grid System Market Forecasts to 2028 – Global Analysis By Depth (Deepwater, Shallow Water), Component (Transformers, Switchgears, Cables), Application, and By Geography

|
Years Covered |
2020-2028 |
|
Estimated Year Value (2021) |
US $8.26 BN |
|
Projected Year Value (2028) |
US $18.48 BN |
|
CAGR (2021 - 2028) |
12.2% |
|
Regions Covered |
North America, Europe, Asia Pacific, South America, and Middle East & Africa |
|
Countries Covered |
US, Canada, Mexico, Germany, UK, Italy, France, Spain, Japan, China, India, Australia, New Zealand, South Korea, Rest of Asia Pacific, South America, Argentina, Brazil, Chile, Middle East & Africa, Saudi Arabia, UAE, Qatar, and South Africa |
|
Largest Market |
Europe |
|
Highest Growing Market |
Asia Pacific |
According to Stratistics MRC, the Global Power Grid System Market is accounted for $8.26 billion in 2021 and is expected to reach $18.48 billion by 2028 growing at a CAGR of 12.2% during the forecast period. Power grid systems in subsea play an important role in the offshore power supply network. The subsea power grid comprises numerous components such as cables, transformers, variable speed drives, switchgear, and others used for various applications.
Market Dynamics:
Driver:
Increased deepwater oil and gas exploration activities
Advancements in technologies used in deepwater exploration and production activities, depleting onshore fossil fuel reserves, and the commercial feasibility of offshore projects are the factors encouraging E&P operators for deepwater exploration. Moreover, discoveries of offshore oil deposits in many countries signify the future oil production opportunities in offshore fields, thereby creating power grid requirements to transport electricity and supply power to subsea and offshore production facilities.
Restraint:
High operational and technological risks
The high initial investment for commissioning a subsea power grid system and the maintenance costs are very high, restricting new players from entering the market. The cost of installing subsea components depends on factors such as the nature of the seabed, the depth of the site, the number of landings, as well as voltage needs. There are only a handful of players that hold a major share of the global market. The investment required for new subsea power grid systems is significantly higher than upgrading the existing systems.
Opportunity:
Easy access of wind turbine technology
As demand for energy is rising, major countries and companies across the globe are turning toward the adoption of renewable energy as it can provide clean energy. The adoption of offshore wind energy with advanced technology attracted countries and companies for high investment. With the advancement in wind turbine capacity, many countries introduced wind turbines. The new turbines will enhance the productivity of offshore wind farms by generating more power.
Threat:
Low cost of onshore electricity generation
The cost of electricity generation from onshore wind power plants, geothermal and hydropower plants, and biomass power plants is equivalent to or lower than the cost of power generation. Furthermore, the cost of electricity produced by land-based wind turbines and solar PVs has gone down, and it is more economical to generate electricity using solar and wind energy. Additionally, the cost of producing electricity from conventional resources, including coal, gas, and diesel, is quite lower than the power generation within offshore oil and gas production plants. All these factors are likely to negatively impact the offshore market and, subsequently, the power grid system market in subsea.
The cables segment is expected to be the largest during the forecast period
The cables segment is estimated to have a lucrative growth as the adoption of subsea power cables is driven by the HV power transmission and offshore oil & gas industries. Subsea power cables are extensively used to link shore-based power grids. These cables carry power from one country to another, as well as from one offshore platform to another, and transfer power from offshore renewable energy generation plants.
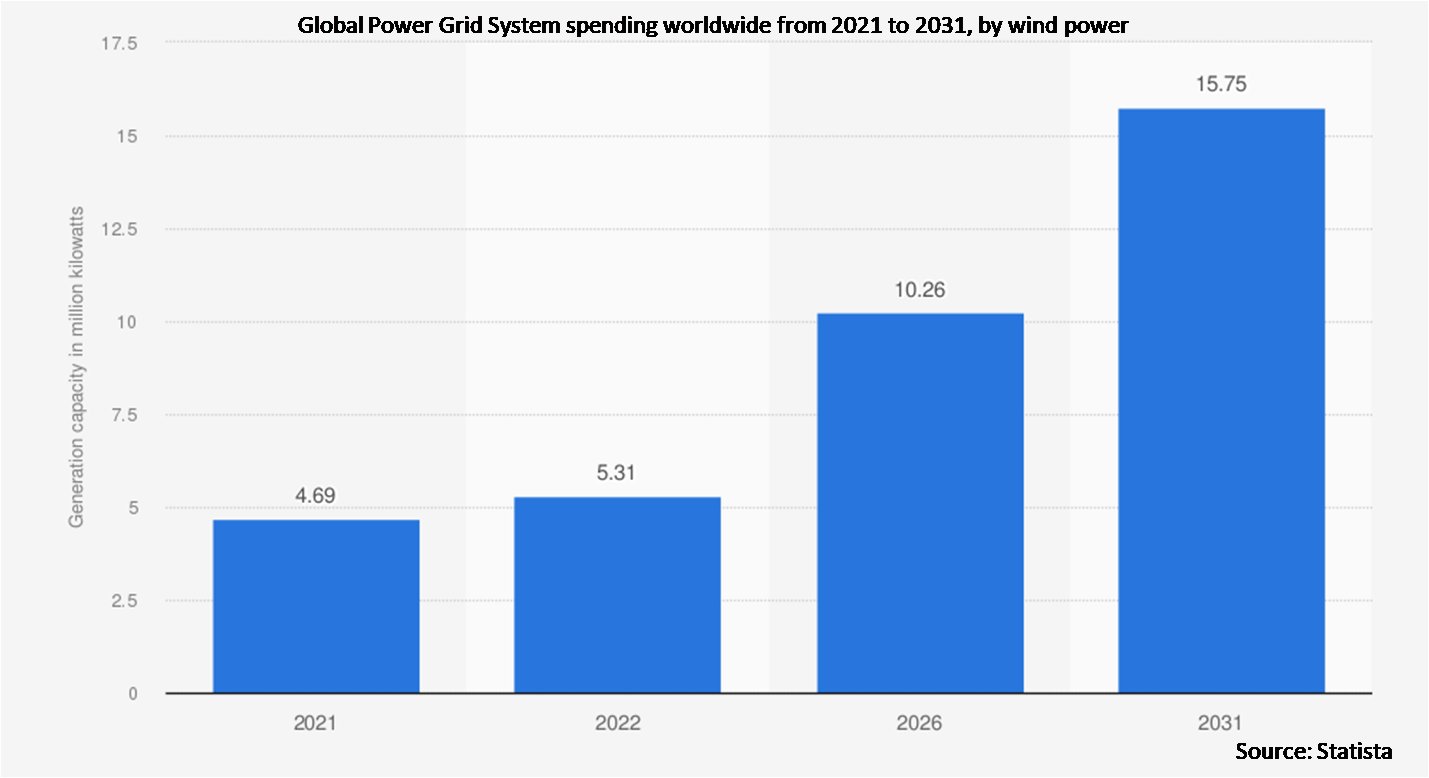
The wind power segment is expected to have the highest CAGR during the forecast period
The wind power segment is anticipated to witness the fastest CAGR growth during the forecast period owing to the increase in the use of subsea power cables in long-distance HV power transmission applications, countries planning to invest significantly to expand and develop their regional offshore wind energy industry.
Region with highest share:
Europe is projected to hold the largest market share during the forecast period due to the strong demand for renewable energy sources and favorable government policies in these regions. The growth of the power grid system market subsea is supported by the European Wind Initiative (EWI), a wind energy R&D program developed to take the wind industry to the next level in Europe.
Region with highest CAGR:
Asia Pacific is projected to have the highest CAGR over the forecast period owing to significant development in offshore fields, increasing demand from the commercial, residential, and industrial sectors in countries, strong demand for renewable energy sources and favorable government policies in these regions.

Key players in the market
Some of the key players profiled in the Power Grid System Market include LS Cable & System, NKT, Sumitomo Electric Industries, Ltd., Aker Solutions ASA, Teledyne Marine, Schlumberger, Prysmian Group, Oceaneering International, SSG Cable, Nexans, TE Connectivity, Intertek, Hitachi Energy, General Electric, DEME, Baker Hughes, TechnipFMC, ABB, and Siemens Energy.
Key Developments:
In Feb 2022, Prysmian Group announced that is moving ahead with its project for a new submarine power cable plant in the United States. Prysmian Group and CDC Commercial Development Company announces the signing of the contract for the purchase by Prysmian of the site identified in Brayton Point (Massachusetts). The final acquisition of the site is subject to securing state permits for the construction of the new plant.
In Feb 2022, ABB signed an agreement with OneSubsea to support its subsea multiphase compression system for Shell’s Ormen Lange field. According to this agreement, ABB is expected to supply variable-speed drives and subsea transformers to power subsea compressors.
Depths Covered:
• Deepwater
• Shallow Water
Components Covered:
• Variable Speed Drives
• Transformers
• Switchgears
• Cables
• Other Components
Applications Covered:
• Wind Power
• Captive Generation
• Other Applications
Regions Covered:
• North America
o US
o Canada
o Mexico
• Europe
o Germany
o UK
o Italy
o France
o Spain
o Rest of Europe
• Asia Pacific
o Japan
o China
o India
o Australia
o New Zealand
o South Korea
o Rest of Asia Pacific
• South America
o Argentina
o Brazil
o Chile
o Rest of South America
• Middle East & Africa
o Saudi Arabia
o UAE
o Qatar
o South Africa
o Rest of Middle East & Africa
What our report offers:
- Market share assessments for the regional and country-level segments
- Strategic recommendations for the new entrants
- Covers Market data for the years 2020, 2021, 2022, 2025, and 2028
- Market Trends (Drivers, Constraints, Opportunities, Threats, Challenges, Investment Opportunities, and recommendations)
- Strategic recommendations in key business segments based on the market estimations
- Competitive landscaping mapping the key common trends
- Company profiling with detailed strategies, financials, and recent developments
- Supply chain trends mapping the latest technological advancements
Free Customization Offerings:
All the customers of this report will be entitled to receive one of the following free customization options:
• Company Profiling
o Comprehensive profiling of additional market players (up to 3)
o SWOT Analysis of key players (up to 3)
• Regional Segmentation
o Market estimations, Forecasts and CAGR of any prominent country as per the client's interest (Note: Depends on feasibility check)
• Competitive Benchmarking
o Benchmarking of key players based on product portfolio, geographical presence, and strategic alliances
Table of Contents
1 Executive Summary
2 Preface
2.1 Abstract
2.2 Stake Holders
2.3 Research Scope
2.4 Research Methodology
2.4.1 Data Mining
2.4.2 Data Analysis
2.4.3 Data Validation
2.4.4 Research Approach
2.5 Research Sources
2.5.1 Primary Research Sources
2.5.2 Secondary Research Sources
2.5.3 Assumptions
3 Market Trend Analysis
3.1 Introduction
3.2 Drivers
3.3 Restraints
3.4 Opportunities
3.5 Threats
3.6 Application Analysis
3.7 Emerging Markets
3.8 Impact of Covid-19
4 Porters Five Force Analysis
4.1 Bargaining power of suppliers
4.2 Bargaining power of buyers
4.3 Threat of substitutes
4.4 Threat of new entrants
4.5 Competitive rivalry
5 Global Power Grid System Market, By Depth
5.1 Introduction
5.2 Deepwater
5.3 Shallow Water
6 Global Power Grid System Market, By Component
6.1 Introduction
6.2 Variable Speed Drives
6.3 Transformers
6.4 Switchgears
6.5 Cables
6.6 Other Components
6.6.1 Actuators
6.6.2 Connectors
6.6.3 Penetrators
6.6.4 Sensors
7 Global Power Grid System Market, By Application
7.1 Introduction
7.2 Wind Power
7.3 Captive Generation
7.4 Other Applications
7.4.1 Diesel & Gas based Floating Power Plants
7.4.2 Solar Power
7.4.3 Tidal Power
8 Global Power Grid System Market, By Geography
8.1 Introduction
8.2 North America
8.2.1 US
8.2.2 Canada
8.2.3 Mexico
8.3 Europe
8.3.1 Germany
8.3.2 UK
8.3.3 Italy
8.3.4 France
8.3.5 Spain
8.3.6 Rest of Europe
8.4 Asia Pacific
8.4.1 Japan
8.4.2 China
8.4.3 India
8.4.4 Australia
8.4.5 New Zealand
8.4.6 South Korea
8.4.7 Rest of Asia Pacific
8.5 South America
8.5.1 Argentina
8.5.2 Brazil
8.5.3 Chile
8.5.4 Rest of South America
8.6 Middle East & Africa
8.6.1 Saudi Arabia
8.6.2 UAE
8.6.3 Qatar
8.6.4 South Africa
8.6.5 Rest of Middle East & Africa
9 Key Developments
9.1 Agreements, Partnerships, Collaborations and Joint Ventures
9.2 Acquisitions & Mergers
9.3 New Product Launch
9.4 Expansions
9.5 Other Key Strategies
10 Company Profiling
10.1 LS Cable & System
10.2 NKT
10.3 Sumitomo Electric Industries, Ltd.
10.4 Aker Solutions ASA
10.5 Teledyne Marine
10.6 Schlumberger
10.7 Prysmian Group
10.8 Oceaneering International
10.9 SSG Cable
10.10 Nexans
10.11 TE Connectivity
10.12 Intertek
10.13 Hitachi Energy
10.14 General Electric
10.15 DEME
10.16 Baker Hughes
10.17 TechnipFMC
10.18 ABB
10.19 Siemens Energy
List of Tables
1 Global Power Grid System Market Outlook, By Region (2020-2028) ($MN)
2 Global Power Grid System Market Outlook, By Depth (2020-2028) ($MN)
3 Global Power Grid System Market Outlook, By Deepwater (2020-2028) ($MN)
4 Global Power Grid System Market Outlook, By Shallow Water (2020-2028) ($MN)
5 Global Power Grid System Market Outlook, By Component (2020-2028) ($MN)
6 Global Power Grid System Market Outlook, By Variable Speed Drives (2020-2028) ($MN)
7 Global Power Grid System Market Outlook, By Transformers (2020-2028) ($MN)
8 Global Power Grid System Market Outlook, By Switchgears (2020-2028) ($MN)
9 Global Power Grid System Market Outlook, By Cables (2020-2028) ($MN)
10 Global Power Grid System Market Outlook, By Other Components (2020-2028) ($MN)
11 Global Power Grid System Market Outlook, By Actuators (2020-2028) ($MN)
12 Global Power Grid System Market Outlook, By Connectors (2020-2028) ($MN)
13 Global Power Grid System Market Outlook, By Penetrators (2020-2028) ($MN)
14 Global Power Grid System Market Outlook, By Sensors (2020-2028) ($MN)
15 Global Power Grid System Market Outlook, By Application (2020-2028) ($MN)
16 Global Power Grid System Market Outlook, By Wind Power (2020-2028) ($MN)
17 Global Power Grid System Market Outlook, By Captive Generation (2020-2028) ($MN)
18 Global Power Grid System Market Outlook, By Other Applications (2020-2028) ($MN)
19 Global Power Grid System Market Outlook, By Diesel & Gas based Floating Power Plants (2020-2028) ($MN)
20 Global Power Grid System Market Outlook, By Solar Power (2020-2028) ($MN)
21 Global Power Grid System Market Outlook, By Tidal Power (2020-2028) ($MN)
22 North America Power Grid System Market Outlook, By Country (2020-2028) ($MN)
23 North America Power Grid System Market Outlook, By Depth (2020-2028) ($MN)
24 North America Power Grid System Market Outlook, By Deepwater (2020-2028) ($MN)
25 North America Power Grid System Market Outlook, By Shallow Water (2020-2028) ($MN)
26 North America Power Grid System Market Outlook, By Component (2020-2028) ($MN)
27 North America Power Grid System Market Outlook, By Variable Speed Drives (2020-2028) ($MN)
28 North America Power Grid System Market Outlook, By Transformers (2020-2028) ($MN)
29 North America Power Grid System Market Outlook, By Switchgears (2020-2028) ($MN)
30 North America Power Grid System Market Outlook, By Cables (2020-2028) ($MN)
31 North America Power Grid System Market Outlook, By Other Components (2020-2028) ($MN)
32 North America Power Grid System Market Outlook, By Actuators (2020-2028) ($MN)
33 North America Power Grid System Market Outlook, By Connectors (2020-2028) ($MN)
34 North America Power Grid System Market Outlook, By Penetrators (2020-2028) ($MN)
35 North America Power Grid System Market Outlook, By Sensors (2020-2028) ($MN)
36 North America Power Grid System Market Outlook, By Application (2020-2028) ($MN)
37 North America Power Grid System Market Outlook, By Wind Power (2020-2028) ($MN)
38 North America Power Grid System Market Outlook, By Captive Generation (2020-2028) ($MN)
39 North America Power Grid System Market Outlook, By Other Applications (2020-2028) ($MN)
40 North America Power Grid System Market Outlook, By Diesel & Gas based Floating Power Plants (2020-2028) ($MN)
41 North America Power Grid System Market Outlook, By Solar Power (2020-2028) ($MN)
42 North America Power Grid System Market Outlook, By Tidal Power (2020-2028) ($MN)
43 Europe Power Grid System Market Outlook, By Country (2020-2028) ($MN)
44 Europe Power Grid System Market Outlook, By Depth (2020-2028) ($MN)
45 Europe Power Grid System Market Outlook, By Deepwater (2020-2028) ($MN)
46 Europe Power Grid System Market Outlook, By Shallow Water (2020-2028) ($MN)
47 Europe Power Grid System Market Outlook, By Component (2020-2028) ($MN)
48 Europe Power Grid System Market Outlook, By Variable Speed Drives (2020-2028) ($MN)
49 Europe Power Grid System Market Outlook, By Transformers (2020-2028) ($MN)
50 Europe Power Grid System Market Outlook, By Switchgears (2020-2028) ($MN)
51 Europe Power Grid System Market Outlook, By Cables (2020-2028) ($MN)
52 Europe Power Grid System Market Outlook, By Other Components (2020-2028) ($MN)
53 Europe Power Grid System Market Outlook, By Actuators (2020-2028) ($MN)
54 Europe Power Grid System Market Outlook, By Connectors (2020-2028) ($MN)
55 Europe Power Grid System Market Outlook, By Penetrators (2020-2028) ($MN)
56 Europe Power Grid System Market Outlook, By Sensors (2020-2028) ($MN)
57 Europe Power Grid System Market Outlook, By Application (2020-2028) ($MN)
58 Europe Power Grid System Market Outlook, By Wind Power (2020-2028) ($MN)
59 Europe Power Grid System Market Outlook, By Captive Generation (2020-2028) ($MN)
60 Europe Power Grid System Market Outlook, By Other Applications (2020-2028) ($MN)
61 Europe Power Grid System Market Outlook, By Diesel & Gas based Floating Power Plants (2020-2028) ($MN)
62 Europe Power Grid System Market Outlook, By Solar Power (2020-2028) ($MN)
63 Europe Power Grid System Market Outlook, By Tidal Power (2020-2028) ($MN)
64 Asia Pacific Power Grid System Market Outlook, By Country (2020-2028) ($MN)
65 Asia Pacific Power Grid System Market Outlook, By Depth (2020-2028) ($MN)
66 Asia Pacific Power Grid System Market Outlook, By Deepwater (2020-2028) ($MN)
67 Asia Pacific Power Grid System Market Outlook, By Shallow Water (2020-2028) ($MN)
68 Asia Pacific Power Grid System Market Outlook, By Component (2020-2028) ($MN)
69 Asia Pacific Power Grid System Market Outlook, By Variable Speed Drives (2020-2028) ($MN)
70 Asia Pacific Power Grid System Market Outlook, By Transformers (2020-2028) ($MN)
71 Asia Pacific Power Grid System Market Outlook, By Switchgears (2020-2028) ($MN)
72 Asia Pacific Power Grid System Market Outlook, By Cables (2020-2028) ($MN)
73 Asia Pacific Power Grid System Market Outlook, By Other Components (2020-2028) ($MN)
74 Asia Pacific Power Grid System Market Outlook, By Actuators (2020-2028) ($MN)
75 Asia Pacific Power Grid System Market Outlook, By Connectors (2020-2028) ($MN)
76 Asia Pacific Power Grid System Market Outlook, By Penetrators (2020-2028) ($MN)
77 Asia Pacific Power Grid System Market Outlook, By Sensors (2020-2028) ($MN)
78 Asia Pacific Power Grid System Market Outlook, By Application (2020-2028) ($MN)
79 Asia Pacific Power Grid System Market Outlook, By Wind Power (2020-2028) ($MN)
80 Asia Pacific Power Grid System Market Outlook, By Captive Generation (2020-2028) ($MN)
81 Asia Pacific Power Grid System Market Outlook, By Other Applications (2020-2028) ($MN)
82 Asia Pacific Power Grid System Market Outlook, By Diesel & Gas based Floating Power Plants (2020-2028) ($MN)
83 Asia Pacific Power Grid System Market Outlook, By Solar Power (2020-2028) ($MN)
84 Asia Pacific Power Grid System Market Outlook, By Tidal Power (2020-2028) ($MN)
85 South America Power Grid System Market Outlook, By Country (2020-2028) ($MN)
86 South America Power Grid System Market Outlook, By Depth (2020-2028) ($MN)
87 South America Power Grid System Market Outlook, By Deepwater (2020-2028) ($MN)
88 South America Power Grid System Market Outlook, By Shallow Water (2020-2028) ($MN)
89 South America Power Grid System Market Outlook, By Component (2020-2028) ($MN)
90 South America Power Grid System Market Outlook, By Variable Speed Drives (2020-2028) ($MN)
91 South America Power Grid System Market Outlook, By Transformers (2020-2028) ($MN)
92 South America Power Grid System Market Outlook, By Switchgears (2020-2028) ($MN)
93 South America Power Grid System Market Outlook, By Cables (2020-2028) ($MN)
94 South America Power Grid System Market Outlook, By Other Components (2020-2028) ($MN)
95 South America Power Grid System Market Outlook, By Actuators (2020-2028) ($MN)
96 South America Power Grid System Market Outlook, By Connectors (2020-2028) ($MN)
97 South America Power Grid System Market Outlook, By Penetrators (2020-2028) ($MN)
98 South America Power Grid System Market Outlook, By Sensors (2020-2028) ($MN)
99 South America Power Grid System Market Outlook, By Application (2020-2028) ($MN)
100 South America Power Grid System Market Outlook, By Wind Power (2020-2028) ($MN)
101 South America Power Grid System Market Outlook, By Captive Generation (2020-2028) ($MN)
102 South America Power Grid System Market Outlook, By Other Applications (2020-2028) ($MN)
103 South America Power Grid System Market Outlook, By Diesel & Gas based Floating Power Plants (2020-2028) ($MN)
104 South America Power Grid System Market Outlook, By Solar Power (2020-2028) ($MN)
105 South America Power Grid System Market Outlook, By Tidal Power (2020-2028) ($MN)
106 Middle East & Africa Power Grid System Market Outlook, By Country (2020-2028) ($MN)
107 Middle East & Africa Power Grid System Market Outlook, By Depth (2020-2028) ($MN)
108 Middle East & Africa Power Grid System Market Outlook, By Deepwater (2020-2028) ($MN)
109 Middle East & Africa Power Grid System Market Outlook, By Shallow Water (2020-2028) ($MN)
110 Middle East & Africa Power Grid System Market Outlook, By Component (2020-2028) ($MN)
111 Middle East & Africa Power Grid System Market Outlook, By Variable Speed Drives (2020-2028) ($MN)
112 Middle East & Africa Power Grid System Market Outlook, By Transformers (2020-2028) ($MN)
113 Middle East & Africa Power Grid System Market Outlook, By Switchgears (2020-2028) ($MN)
114 Middle East & Africa Power Grid System Market Outlook, By Cables (2020-2028) ($MN)
115 Middle East & Africa Power Grid System Market Outlook, By Other Components (2020-2028) ($MN)
116 Middle East & Africa Power Grid System Market Outlook, By Actuators (2020-2028) ($MN)
117 Middle East & Africa Power Grid System Market Outlook, By Connectors (2020-2028) ($MN)
118 Middle East & Africa Power Grid System Market Outlook, By Penetrators (2020-2028) ($MN)
119 Middle East & Africa Power Grid System Market Outlook, By Sensors (2020-2028) ($MN)
120 Middle East & Africa Power Grid System Market Outlook, By Application (2020-2028) ($MN)
121 Middle East & Africa Power Grid System Market Outlook, By Wind Power (2020-2028) ($MN)
122 Middle East & Africa Power Grid System Market Outlook, By Captive Generation (2020-2028) ($MN)
123 Middle East & Africa Power Grid System Market Outlook, By Other Applications (2020-2028) ($MN)
124 Middle East & Africa Power Grid System Market Outlook, By Diesel & Gas based Floating Power Plants (2020-2028) ($MN)
125 Middle East & Africa Power Grid System Market Outlook, By Solar Power (2020-2028) ($MN)
126 Middle East & Africa Power Grid System Market Outlook, By Tidal Power (2020-2028) ($MN)
List of Figures
RESEARCH METHODOLOGY

We at ‘Stratistics’ opt for an extensive research approach which involves data mining, data validation, and data analysis. The various research sources include in-house repository, secondary research, competitor’s sources, social media research, client internal data, and primary research.
Our team of analysts prefers the most reliable and authenticated data sources in order to perform the comprehensive literature search. With access to most of the authenticated data bases our team highly considers the best mix of information through various sources to obtain extensive and accurate analysis.
Each report takes an average time of a month and a team of 4 industry analysts. The time may vary depending on the scope and data availability of the desired market report. The various parameters used in the market assessment are standardized in order to enhance the data accuracy.
Data Mining
The data is collected from several authenticated, reliable, paid and unpaid sources and is filtered depending on the scope & objective of the research. Our reports repository acts as an added advantage in this procedure. Data gathering from the raw material suppliers, distributors and the manufacturers is performed on a regular basis, this helps in the comprehensive understanding of the products value chain. Apart from the above mentioned sources the data is also collected from the industry consultants to ensure the objective of the study is in the right direction.
Market trends such as technological advancements, regulatory affairs, market dynamics (Drivers, Restraints, Opportunities and Challenges) are obtained from scientific journals, market related national & international associations and organizations.
Data Analysis
From the data that is collected depending on the scope & objective of the research the data is subjected for the analysis. The critical steps that we follow for the data analysis include:
- Product Lifecycle Analysis
- Competitor analysis
- Risk analysis
- Porters Analysis
- PESTEL Analysis
- SWOT Analysis
The data engineering is performed by the core industry experts considering both the Marketing Mix Modeling and the Demand Forecasting. The marketing mix modeling makes use of multiple-regression techniques to predict the optimal mix of marketing variables. Regression factor is based on a number of variables and how they relate to an outcome such as sales or profits.
Data Validation
The data validation is performed by the exhaustive primary research from the expert interviews. This includes telephonic interviews, focus groups, face to face interviews, and questionnaires to validate our research from all aspects. The industry experts we approach come from the leading firms, involved in the supply chain ranging from the suppliers, distributors to the manufacturers and consumers so as to ensure an unbiased analysis.
We are in touch with more than 15,000 industry experts with the right mix of consultants, CEO's, presidents, vice presidents, managers, experts from both supply side and demand side, executives and so on.
The data validation involves the primary research from the industry experts belonging to:
- Leading Companies
- Suppliers & Distributors
- Manufacturers
- Consumers
- Industry/Strategic Consultants
Apart from the data validation the primary research also helps in performing the fill gap research, i.e. providing solutions for the unmet needs of the research which helps in enhancing the reports quality.
For more details about research methodology, kindly write to us at info@strategymrc.com
Frequently Asked Questions
In case of any queries regarding this report, you can contact the customer service by filing the “Inquiry Before Buy” form available on the right hand side. You may also contact us through email: info@strategymrc.com or phone: +1-301-202-5929
Yes, the samples are available for all the published reports. You can request them by filling the “Request Sample” option available in this page.
Yes, you can request a sample with your specific requirements. All the customized samples will be provided as per the requirement with the real data masked.
All our reports are available in Digital PDF format. In case if you require them in any other formats, such as PPT, Excel etc you can submit a request through “Inquiry Before Buy” form available on the right hand side. You may also contact us through email: info@strategymrc.com or phone: +1-301-202-5929
We offer a free 15% customization with every purchase. This requirement can be fulfilled for both pre and post sale. You may send your customization requirements through email at info@strategymrc.com or call us on +1-301-202-5929.
We have 3 different licensing options available in electronic format.
- Single User Licence: Allows one person, typically the buyer, to have access to the ordered product. The ordered product cannot be distributed to anyone else.
- 2-5 User Licence: Allows the ordered product to be shared among a maximum of 5 people within your organisation.
- Corporate License: Allows the product to be shared among all employees of your organisation regardless of their geographical location.
All our reports are typically be emailed to you as an attachment.
To order any available report you need to register on our website. The payment can be made either through CCAvenue or PayPal payments gateways which accept all international cards.
We extend our support to 6 months post sale. A post sale customization is also provided to cover your unmet needs in the report.
Request Customization
We offer complimentary customization of up to 15% with every purchase. To share your customization requirements, feel free to email us at info@strategymrc.com or call us on +1-301-202-5929. .
Please Note: Customization within the 15% threshold is entirely free of charge. If your request exceeds this limit, we will conduct a feasibility assessment. Following that, a detailed quote and timeline will be provided.
WHY CHOOSE US ?

Assured Quality
Best in class reports with high standard of research integrity

24X7 Research Support
Continuous support to ensure the best customer experience.

Free Customization
Adding more values to your product of interest.

Safe & Secure Access
Providing a secured environment for all online transactions.

Trusted by 600+ Brands
Serving the most reputed brands across the world.