
Smart Fleet Telematics Market
Smart Fleet Telematics Market Forecasts to 2034 - Global Analysis By Solution (Route Optimization, Driver Behavior Monitoring, Predictive Maintenance, Safety & Compliance and Fuel Management), Hardware, Transportation Mode, Connectivity, Fleet Size, End User and By Geography

|
Years Covered |
2023-2034 |
|
Estimated Year Value (2026) |
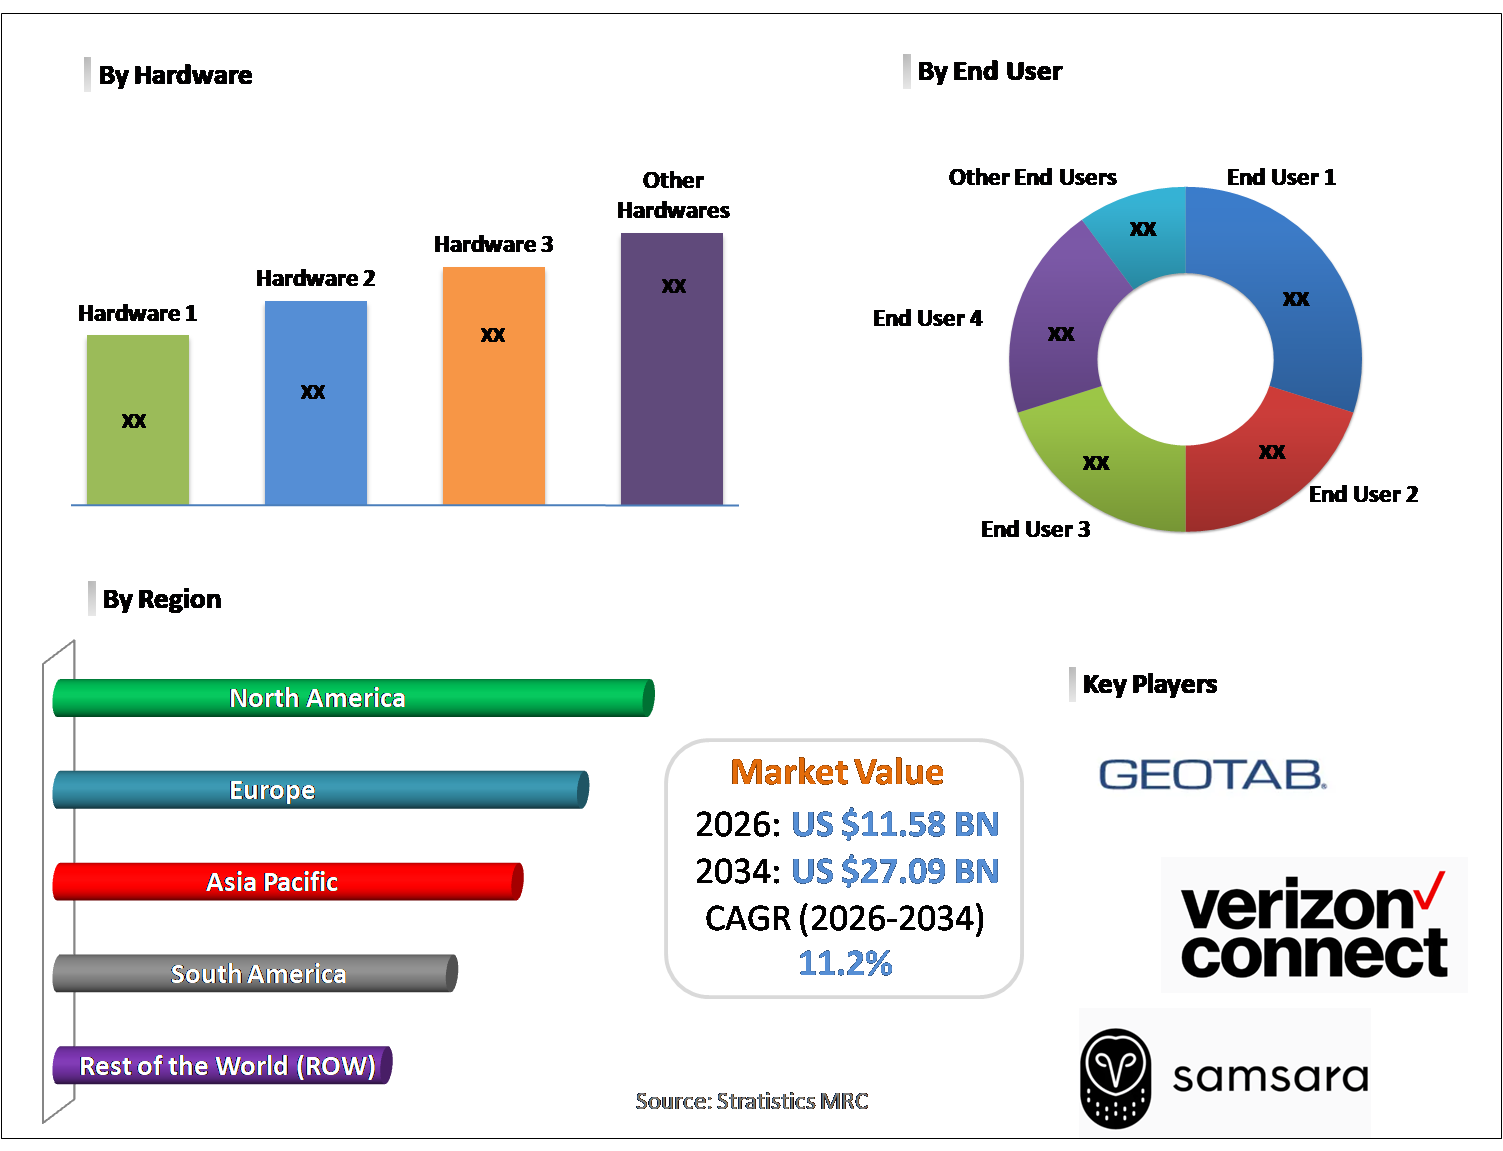
US $11.58 BN |
|
Projected Year Value (2034) |
US $27.09 BN |
|
CAGR (2026-2034) |
11.2% |
|
Regions Covered |
North America, Europe, Asia Pacific, South America, and Rest of the World (RoW) |
|
Countries Covered |
United States, Canada, Mexico, United Kingdom, Germany, France, Italy, Spain, Netherlands, Belgium, Sweden, Switzerland, Poland, Rest of Europe, China, Japan, India, South Korea, Australia, Indonesia, Thailand, Malaysia, Singapore, Vietnam, Rest of Asia Pacific, Brazil, Argentina, Colombia, Chile, Peru, Rest of South America, Saudi Arabia, United Arab Emirates, Qatar, Israel, Rest of Middle East, South Africa, Egypt, Morocco, and Rest of Africa. |
|
Largest Market |
North America |
|
Highest Growing Market |
Asia Pacific |
According to Stratistics MRC, the Global Smart Fleet Telematics Market is accounted for $11.58 billion in 2026 and is expected to reach $27.09 billion by 2034 growing at a CAGR of 11.2% during the forecast period. Smart Fleet Telematics combines GPS technology, IoT devices, and cloud platforms to streamline fleet operations. It allows continuous tracking of vehicles, fuel usage, speed, and driver performance, boosting safety and efficiency. By analyzing collected data, businesses can forecast maintenance, minimize downtime, and cut costs. The technology also facilitates optimized routing, regulatory compliance, and enhanced delivery services. Growing use in logistics and transport is revolutionizing fleet management by offering data-driven insights, better operational decisions, and eco-friendly outcomes through lower fuel consumption and emissions.
According to Berg Insight, about 75 % of all new cars sold worldwide in 2023 were equipped with embedded OEM telematics systems, underscoring the widespread adoption of vehicle connectivity that enables fleet telematics and data services. This reflects how telematics functions are becoming standard features in modern vehicles, not just optional add‑ons, which boosts telematics market penetration.
Market Dynamics:
Driver:
Growing demand for operational efficiency
The need to improve operational efficiency fuels the growth of smart fleet telematics. By monitoring vehicles in real time, companies can optimize routes, cut fuel usage, supervise driver conduct, and enhance scheduling. These capabilities reduce expenses, avoid delays, and improve service delivery. Data-driven insights from telematics allow predictive maintenance and downtime prevention, helping businesses streamline fleet operations. With rising competition, firms adopt telematics to maximize resource use, improve operational workflows, and boost efficiency across logistics and transportation services.
Restraint:
High initial investment costs
Smart fleet telematics adoption is restrained by the substantial initial costs of hardware, software, and installation. Small and mid-sized businesses often struggle with affordability, limiting deployment. Expenses for GPS devices, IoT sensors, connectivity, and platform subscriptions can burden budgets, while integrating with existing systems may demand additional resources. The high upfront cost delays return on investment, discouraging smaller fleets. Although telematics provides long-term efficiency and savings, the initial financial barrier continues to restrict wider acceptance across the market.
Opportunity:
Rising demand for electric and hybrid fleets
The transition to electric and hybrid vehicles opens opportunities for smart fleet telematics. These fleets need monitoring for battery performance, charging schedules, and efficient routing. Telematics platforms can track energy consumption, charging infrastructure, and maintenance needs, boosting operational efficiency. As sustainable transport adoption increases, fleet managers demand tools to optimize uptime and reduce energy costs. Telematics providers can target this emerging market by offering EV- and hybrid-focused solutions, supporting eco-friendly fleet strategies while addressing the growing need for energy-efficient and environmentally sustainable transportation management.
Threat:
Competition from alternative fleet management solutions
Alternative fleet management methods threaten smart fleet telematics growth. Businesses may opt for simpler GPS tracking, manual monitoring, or conventional management tools rather than investing in full telematics platforms. For smaller fleets, these alternatives may be more affordable and easier to deploy. The availability of substitutes can slow market adoption, weaken pricing strategies, and limit customer growth for telematics providers. Vendors must showcase clear advantages, measurable ROI, and distinctive features to compete. Failure to differentiate could allow alternative solutions to capture market share, posing a substantial threat to telematics expansion.
Covid-19 Impact:
The COVID-19 outbreak had a notable impact on the smart fleet telematics market. Initial lockdowns, supply chain interruptions, and reduced transport activity lowered immediate demand for telematics systems. Conversely, the pandemic accelerated the adoption of digital fleet management, remote monitoring, and contactless delivery solutions, emphasizing the importance of real-time tracking and analytics. Businesses turned to telematics to enhance route efficiency, ensure safety, and maintain operational continuity during uncertain times. Though growth slowed at first, COVID-19 ultimately underscored the critical role of smart fleet telematics in building resilient, efficient, and adaptive fleet management strategies worldwide.
The GPS/navigation units segment is expected to be the largest during the forecast period
The GPS/navigation units segment is expected to account for the largest market share during the forecast period because they are crucial for tracking vehicles, optimizing routes, and managing fleet operations. They deliver precise location information, aid in efficient dispatch, and improve overall operational performance. By monitoring vehicle movement, driver performance, and fuel consumption, GPS systems serve as the core of telematics solutions. Their extensive use across logistics, transportation, and delivery fleets reinforces their significance. The essential functionality, dependability, and adaptability of GPS/navigation units ensure their leading position and make them a central component of smart fleet telematics solutions.
The automotive segment is expected to have the highest CAGR during the forecast period
Over the forecast period, the automotive segment is predicted to witness the highest growth rate. Growing adoption of connected and commercial vehicles, along with the need for optimized fleet operations, fuels this expansion. Automotive fleets, including trucks, vans, and delivery vehicles, increasingly utilize telematics for vehicle tracking, driver performance monitoring, fuel optimization, and predictive maintenance. The emphasis on cost reduction, safety improvement, and route efficiency supports accelerated adoption. Advances in IoT, AI, and cloud-based solutions further drive growth, establishing the automotive segment as the fastest-growing area within the smart fleet telematics market.
Region with largest share:
During the forecast period, the North America region is expected to hold the largest market share due to its robust transportation infrastructure, extensive use of connected vehicles, and high fleet technology awareness. The region benefits from leading telematics providers, supportive policies, and expanding logistics and e-commerce activities. Businesses are increasingly adopting telematics for vehicle monitoring, route planning, fuel efficiency, and driver safety management. Technological advancement, strong investment capacity, and early adoption of innovative solutions reinforce North America’s leading position, ensuring it retains the largest share and continues to shape the global smart fleet telematics market.
Region with highest CAGR:
Over the forecast period, the Asia Pacific region is anticipated to exhibit the highest CAGR, fueled by rapid urban growth, expanding logistics and e-commerce sectors, and greater adoption of connected vehicles. Developing transportation infrastructure, the push for operational efficiency, and supportive government policies are encouraging telematics deployment in countries such as China, India, and Japan. SMEs are increasingly utilizing fleet management solutions to improve routing, minimize fuel use, and ensure driver safety. With technological progress, a large fleet population, and growing digitalization, Asia-Pacific is emerging as the fastest-growing region in the global smart fleet telematics market.

Key players in the market
Some of the key players in Smart Fleet Telematics Market include Geotab Inc., Verizon Connect, Samsara Inc., Powerfleet, Trimble Inc., Omnitracs LLC, Motive, Zonar Systems Inc., Continental AG, TomTom Telematics, Teletrac Navman Ltd., Azuga Inc., Platform Science, MiX Telematics, Bosch IoT Fleet Services, Inseego Corp., Sierra Wireless Inc. and IBM Corp.
Key Developments:
In November 2025, IBM and Atruvia AG have sealed a long-term collaboration that paves the way for sustainable and state-of-the-art IT platforms for the banking of tomorrow. Atruvia will use IBM z17, which was announced earlier this year, as a cornerstone supports its mission critical operations including the core banking system.
In October 2025, Continental AG has reached a deal with former managers that will see their insurance pay damages between 40 million and 50 million euros in connection with the diesel scandal. The deal with insurers, subject to shareholder approval, covers only some of the total damages of 300 million euros.
In January 2025, Trimble announced it has extended its technology collaboration with Qualcomm Technologies, Inc. to deliver precise positioning solutions for automated vehicles ranging from automobiles to heavy trucking. Trimble's precise positioning engine, Trimble ProPointⓇ Go™, will be integrated with the SnapdragonⓇ Auto 5G Modem-RF Gen 2, a key platform of the Snapdragon Digital Chassis™ solution, to provide positioning accuracy within 10 centimeters. Vehicles with the joint solution are expected to be on the roads by 2028.
Solutions Covered:
• Route Optimization
• Driver Behavior Monitoring
• Predictive Maintenance
• Safety & Compliance
• Fuel Management
Hardwares Covered:
• Multi-Camera Systems
• GPS/Navigation Units
• Sensors & IoT Devices
• Communication Modules
Transportation Modes Covered:
• Automotive
• Rail
• Marine
• Aviation
Connectivities Covered:
• Short-Range
• Long-Range
Fleet Sizes Covered:
• Small (1-49 vehicles)
• Medium (50-499 vehicles)
• Large (500+ vehicles)
End Users Covered:
• Logistics & Last-Mile Delivery
• Public Transportation
• Construction & Mining
• Utilities & Service Providers
• Government & Defense
Regions Covered:
• North America
o United States
o Canada
o Mexico
• Europe
o United Kingdom
o Germany
o France
o Italy
o Spain
o Netherlands
o Belgium
o Sweden
o Switzerland
o Poland
o Rest of Europe
• Asia Pacific
o China
o Japan
o India
o South Korea
o Australia
o Indonesia
o Thailand
o Malaysia
o Singapore
o Vietnam
o Rest of Asia Pacific
• South America
o Brazil
o Argentina
o Colombia
o Chile
o Peru
o Rest of South America
• Rest of the World (RoW)
o Middle East
§ Saudi Arabia
§ United Arab Emirates
§ Qatar
§ Israel
§ Rest of Middle East
o Africa
§ South Africa
§ Egypt
§ Morocco
§ Rest of Africa
What our report offers:
- Market share assessments for the regional and country-level segments
- Strategic recommendations for the new entrants
- Covers Market data for the years 2023, 2024, 2025, 2026, 2027, 2028, 2030, 2032 and 2034
- Market Trends (Drivers, Constraints, Opportunities, Threats, Challenges, Investment Opportunities, and recommendations)
- Strategic recommendations in key business segments based on the market estimations
- Competitive landscaping mapping the key common trends
- Company profiling with detailed strategies, financials, and recent developments
- Supply chain trends mapping the latest technological advancements
Free Customization Offerings:
All the customers of this report will be entitled to receive one of the following free customization options:
• Company Profiling
o Comprehensive profiling of additional market players (up to 3)
o SWOT Analysis of key players (up to 3)
• Regional Segmentation
o Market estimations, Forecasts and CAGR of any prominent country as per the client's interest (Note: Depends on feasibility check)
• Competitive Benchmarking
o Benchmarking of key players based on product portfolio, geographical presence, and strategic alliances
Table of Contents
1 Executive Summary
1.1 Market Snapshot and Key Highlights
1.2 Growth Drivers, Challenges, and Opportunities
1.3 Competitive Landscape Overview
1.4 Strategic Insights and Recommendations
2 Research Framework
2.1 Study Objectives and Scope
2.2 Stakeholder Analysis
2.3 Research Assumptions and Limitations
2.4 Research Methodology
2.4.1 Data Collection (Primary and Secondary)
2.4.2 Data Modeling and Estimation Techniques
2.4.3 Data Validation and Triangulation
2.4.4 Analytical and Forecasting Approach
3 Market Dynamics and Trend Analysis
3.1 Market Definition and Structure
3.2 Key Market Drivers
3.3 Market Restraints and Challenges
3.4 Growth Opportunities and Investment Hotspots
3.5 Industry Threats and Risk Assessment
3.6 Technology and Innovation Landscape
3.7 Emerging and High-Growth Markets
3.8 Regulatory and Policy Environment
3.9 Impact of COVID-19 and Recovery Outlook
4 Competitive and Strategic Assessment
4.1 Porter's Five Forces Analysis
4.1.1 Supplier Bargaining Power
4.1.2 Buyer Bargaining Power
4.1.3 Threat of Substitutes
4.1.4 Threat of New Entrants
4.1.5 Competitive Rivalry
4.2 Market Share Analysis of Key Players
4.3 Product Benchmarking and Performance Comparison
5 Global Smart Fleet Telematics Market, By Solution
5.1 Route Optimization
5.2 Driver Behavior Monitoring
5.3 Predictive Maintenance
5.4 Safety & Compliance
5.5 Fuel Management
6 Global Smart Fleet Telematics Market, By Hardware
6.1 Multi-Camera Systems
6.2 GPS/Navigation Units
6.3 Sensors & IoT Devices
6.4 Communication Modules
7 Global Smart Fleet Telematics Market, By Transportation Mode
7.1 Automotive
7.2 Rail
7.3 Marine
7.4 Aviation
8 Global Smart Fleet Telematics Market, By Connectivity
8.1 Short-Range
8.2 Long-Range
9 Global Smart Fleet Telematics Market, By Fleet Size
9.1 Small (1-49 vehicles)
9.2 Medium (50-499 vehicles)
9.3 Large (500+ vehicles)
10 Global Smart Fleet Telematics Market, By End User
10.1 Logistics & Last-Mile Delivery
10.2 Public Transportation
10.3 Construction & Mining
10.4 Utilities & Service Providers
10.5 Government & Defense
11 Global Smart Fleet Telematics Market, By Geography
11.1 North America
11.1.1 United States
11.1.2 Canada
11.1.3 Mexico
11.2 Europe
11.2.1 United Kingdom
11.2.2 Germany
11.2.3 France
11.2.4 Italy
11.2.5 Spain
11.2.6 Netherlands
11.2.7 Belgium
11.2.8 Sweden
11.2.9 Switzerland
11.2.10 Poland
11.2.11 Rest of Europe
11.3 Asia Pacific
11.3.1 China
11.3.2 Japan
11.3.3 India
11.3.4 South Korea
11.3.5 Australia
11.3.6 Indonesia
11.3.7 Thailand
11.3.8 Malaysia
11.3.9 Singapore
11.3.10 Vietnam
11.3.11 Rest of Asia Pacific
11.4 South America
11.4.1 Brazil
11.4.2 Argentina
11.4.3 Colombia
11.4.4 Chile
11.4.5 Peru
11.4.6 Rest of South America
11.5 Rest of the World (RoW)
11.5.1 Middle East
11.5.1.1 Saudi Arabia
11.5.1.2 United Arab Emirates
11.5.1.3 Qatar
11.5.1.4 Israel
11.5.1.5 Rest of Middle East
11.5.2 Africa
11.5.2.1 South Africa
11.5.2.2 Egypt
11.5.2.3 Morocco
11.5.2.4 Rest of Africa
12 Strategic Market Intelligence
12.1 Industry Value Network and Supply Chain Assessment
12.2 White-Space and Opportunity Mapping
12.3 Product Evolution and Market Life Cycle Analysis
12.4 Channel, Distributor, and Go-to-Market Assessment
13 Industry Developments and Strategic Initiatives
13.1 Mergers and Acquisitions
13.2 Partnerships, Alliances, and Joint Ventures
13.3 New Product Launches and Certifications
13.4 Capacity Expansion and Investments
13.5 Other Strategic Initiatives
14 Company Profiles
14.1 Geotab Inc.
14.2 Verizon Connect
14.3 Samsara Inc.
14.4 Powerfleet
14.5 Trimble Inc.
14.6 Omnitracs LLC
14.7 Motive
14.8 Zonar Systems Inc.
14.9 Continental AG
14.10 TomTom Telematics
14.11 Teletrac Navman Ltd.
14.12 Azuga Inc.
14.13 Platform Science
14.14 MiX Telematics
14.15 Bosch IoT Fleet Services
14.16 Inseego Corp.
14.17 Sierra Wireless Inc.
14.18 IBM Corp.
List of Tables
1 Global Smart Fleet Telematics Market Outlook, By Region (2023-2034) ($MN)
2 Global Smart Fleet Telematics Market Outlook, By Solution (2023-2034) ($MN)
3 Global Smart Fleet Telematics Market Outlook, By Route Optimization (2023-2034) ($MN)
4 Global Smart Fleet Telematics Market Outlook, By Driver Behavior Monitoring (2023-2034) ($MN)
5 Global Smart Fleet Telematics Market Outlook, By Predictive Maintenance (2023-2034) ($MN)
6 Global Smart Fleet Telematics Market Outlook, By Safety & Compliance (2023-2034) ($MN)
7 Global Smart Fleet Telematics Market Outlook, By Fuel Management (2023-2034) ($MN)
8 Global Smart Fleet Telematics Market Outlook, By Hardware (2023-2034) ($MN)
9 Global Smart Fleet Telematics Market Outlook, By Multi-Camera Systems (2023-2034) ($MN)
10 Global Smart Fleet Telematics Market Outlook, By GPS/Navigation Units (2023-2034) ($MN)
11 Global Smart Fleet Telematics Market Outlook, By Sensors & IoT Devices (2023-2034) ($MN)
12 Global Smart Fleet Telematics Market Outlook, By Communication Modules (2023-2034) ($MN)
13 Global Smart Fleet Telematics Market Outlook, By Transportation Mode (2023-2034) ($MN)
14 Global Smart Fleet Telematics Market Outlook, By Automotive (2023-2034) ($MN)
15 Global Smart Fleet Telematics Market Outlook, By Rail (2023-2034) ($MN)
16 Global Smart Fleet Telematics Market Outlook, By Marine (2023-2034) ($MN)
17 Global Smart Fleet Telematics Market Outlook, By Aviation (2023-2034) ($MN)
18 Global Smart Fleet Telematics Market Outlook, By Connectivity (2023-2034) ($MN)
19 Global Smart Fleet Telematics Market Outlook, By Short-Range (2023-2034) ($MN)
20 Global Smart Fleet Telematics Market Outlook, By Long-Range (2023-2034) ($MN)
21 Global Smart Fleet Telematics Market Outlook, By Fleet Size (2023-2034) ($MN)
22 Global Smart Fleet Telematics Market Outlook, By Small (1-49 vehicles) (2023-2034) ($MN)
23 Global Smart Fleet Telematics Market Outlook, By Medium (50-499 vehicles) (2023-2034) ($MN)
24 Global Smart Fleet Telematics Market Outlook, By Large (500+ vehicles) (2023-2034) ($MN)
25 Global Smart Fleet Telematics Market Outlook, By End User (2023-2034) ($MN)
26 Global Smart Fleet Telematics Market Outlook, By Logistics & Last-Mile Delivery (2023-2034) ($MN)
27 Global Smart Fleet Telematics Market Outlook, By Public Transportation (2023-2034) ($MN)
28 Global Smart Fleet Telematics Market Outlook, By Construction & Mining (2023-2034) ($MN)
29 Global Smart Fleet Telematics Market Outlook, By Utilities & Service Providers (2023-2034) ($MN)
30 Global Smart Fleet Telematics Market Outlook, By Government & Defense (2023-2034) ($MN)
Note: Tables for North America, Europe, APAC, South America, and Rest of the World (RoW) Regions are also represented in the same manner as above.
List of Figures
RESEARCH METHODOLOGY

We at ‘Stratistics’ opt for an extensive research approach which involves data mining, data validation, and data analysis. The various research sources include in-house repository, secondary research, competitor’s sources, social media research, client internal data, and primary research.
Our team of analysts prefers the most reliable and authenticated data sources in order to perform the comprehensive literature search. With access to most of the authenticated data bases our team highly considers the best mix of information through various sources to obtain extensive and accurate analysis.
Each report takes an average time of a month and a team of 4 industry analysts. The time may vary depending on the scope and data availability of the desired market report. The various parameters used in the market assessment are standardized in order to enhance the data accuracy.
Data Mining
The data is collected from several authenticated, reliable, paid and unpaid sources and is filtered depending on the scope & objective of the research. Our reports repository acts as an added advantage in this procedure. Data gathering from the raw material suppliers, distributors and the manufacturers is performed on a regular basis, this helps in the comprehensive understanding of the products value chain. Apart from the above mentioned sources the data is also collected from the industry consultants to ensure the objective of the study is in the right direction.
Market trends such as technological advancements, regulatory affairs, market dynamics (Drivers, Restraints, Opportunities and Challenges) are obtained from scientific journals, market related national & international associations and organizations.
Data Analysis
From the data that is collected depending on the scope & objective of the research the data is subjected for the analysis. The critical steps that we follow for the data analysis include:
- Product Lifecycle Analysis
- Competitor analysis
- Risk analysis
- Porters Analysis
- PESTEL Analysis
- SWOT Analysis
The data engineering is performed by the core industry experts considering both the Marketing Mix Modeling and the Demand Forecasting. The marketing mix modeling makes use of multiple-regression techniques to predict the optimal mix of marketing variables. Regression factor is based on a number of variables and how they relate to an outcome such as sales or profits.
Data Validation
The data validation is performed by the exhaustive primary research from the expert interviews. This includes telephonic interviews, focus groups, face to face interviews, and questionnaires to validate our research from all aspects. The industry experts we approach come from the leading firms, involved in the supply chain ranging from the suppliers, distributors to the manufacturers and consumers so as to ensure an unbiased analysis.
We are in touch with more than 15,000 industry experts with the right mix of consultants, CEO's, presidents, vice presidents, managers, experts from both supply side and demand side, executives and so on.
The data validation involves the primary research from the industry experts belonging to:
- Leading Companies
- Suppliers & Distributors
- Manufacturers
- Consumers
- Industry/Strategic Consultants
Apart from the data validation the primary research also helps in performing the fill gap research, i.e. providing solutions for the unmet needs of the research which helps in enhancing the reports quality.
For more details about research methodology, kindly write to us at info@strategymrc.com
Frequently Asked Questions
In case of any queries regarding this report, you can contact the customer service by filing the “Inquiry Before Buy” form available on the right hand side. You may also contact us through email: info@strategymrc.com or phone: +1-301-202-5929
Yes, the samples are available for all the published reports. You can request them by filling the “Request Sample” option available in this page.
Yes, you can request a sample with your specific requirements. All the customized samples will be provided as per the requirement with the real data masked.
All our reports are available in Digital PDF format. In case if you require them in any other formats, such as PPT, Excel etc you can submit a request through “Inquiry Before Buy” form available on the right hand side. You may also contact us through email: info@strategymrc.com or phone: +1-301-202-5929
We offer a free 15% customization with every purchase. This requirement can be fulfilled for both pre and post sale. You may send your customization requirements through email at info@strategymrc.com or call us on +1-301-202-5929.
We have 3 different licensing options available in electronic format.
- Single User Licence: Allows one person, typically the buyer, to have access to the ordered product. The ordered product cannot be distributed to anyone else.
- 2-5 User Licence: Allows the ordered product to be shared among a maximum of 5 people within your organisation.
- Corporate License: Allows the product to be shared among all employees of your organisation regardless of their geographical location.
All our reports are typically be emailed to you as an attachment.
To order any available report you need to register on our website. The payment can be made either through CCAvenue or PayPal payments gateways which accept all international cards.
We extend our support to 6 months post sale. A post sale customization is also provided to cover your unmet needs in the report.
Request Customization
We offer complimentary customization of up to 15% with every purchase. To share your customization requirements, feel free to email us at info@strategymrc.com or call us on +1-301-202-5929. .
Please Note: Customization within the 15% threshold is entirely free of charge. If your request exceeds this limit, we will conduct a feasibility assessment. Following that, a detailed quote and timeline will be provided.
WHY CHOOSE US ?

Assured Quality
Best in class reports with high standard of research integrity

24X7 Research Support
Continuous support to ensure the best customer experience.

Free Customization
Adding more values to your product of interest.

Safe & Secure Access
Providing a secured environment for all online transactions.

Trusted by 600+ Brands
Serving the most reputed brands across the world.